Why It’s No Longer Enough To Beat Inflation
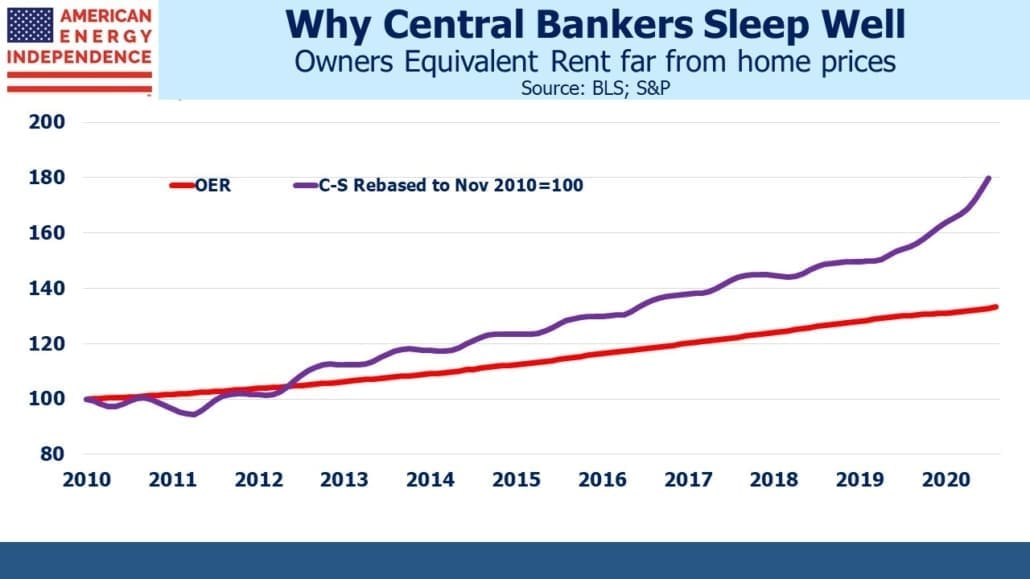
The most recent CPI report was a little better than expected – all-items less food and energy was up 4.3% year-on-year. Used car prices had boosted prior inflation figures but were up just 0.2% in July. Owners’ Equivalent Rent (OER), the statistician’s’ quixotic means of measuring what it costs to attain shelter through home ownership, rose just 0.29% in July. It’s up 2.1% over the past year, compared with the Case Shiller National Home Price index which is +16.6% through May (most recent available).
CPI is important because it’s used to make cost of living adjustments to social security and other government transfer payments. It’s part of the return on inflation—linked bonds and is often used in long-term commercial contracts to make price adjustments. But it’s becoming less relevant as target against which to grow your income. Investing is all about retaining purchasing power for the future. Most interpret this as being able to afford in ten years what you could buy today. It turns out that’s CPI is inadequate for this.
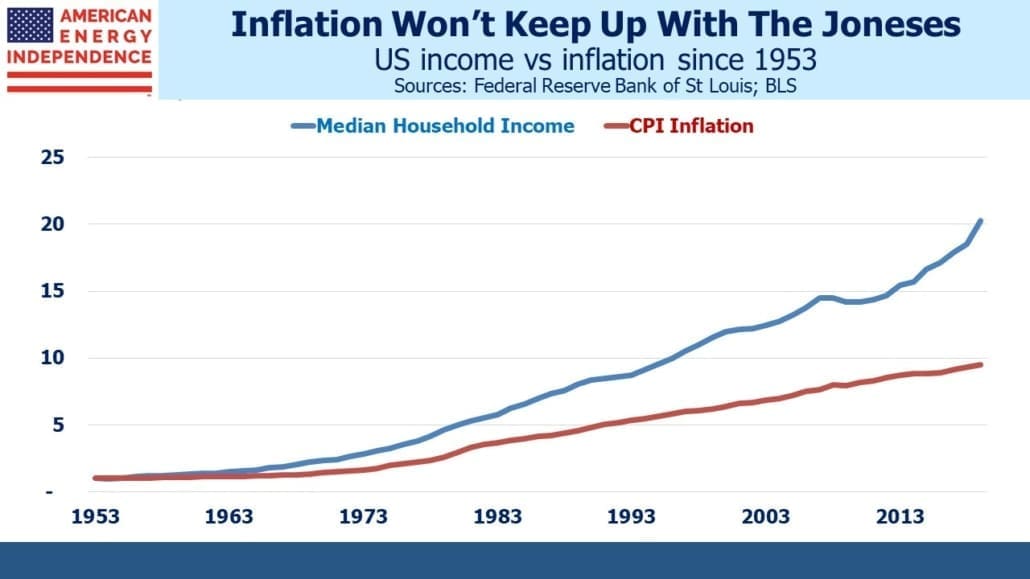
Because incomes grow faster than inflation, if your income fails to keep up with the median, you’ll be relatively poorer. Savers don’t just want to maintain today’s absolute purchasing power – they want to keep the same relative consumption as their peers. If you enjoy the median income today, growing it at CPI means falling below the median, and won’t feel like much fun. Average income has been dragged above the median by “the 1%”, or the increasing income inequality we often read about. So using the median provides a more representative figure for the typical family.
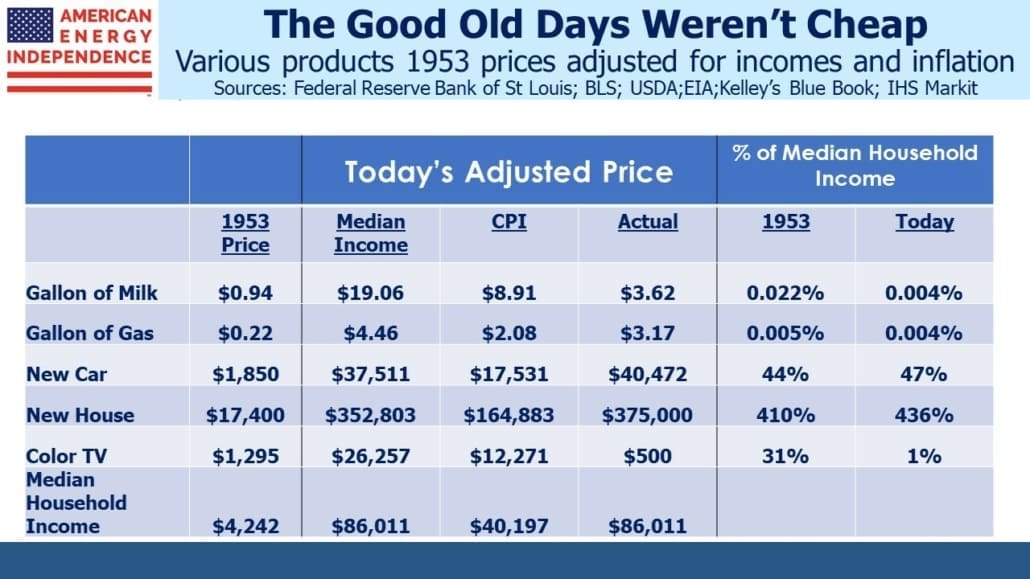
Whenever a writer quotes a price for something decades ago and converts it into “today’s dollars”, he’s using the CPI inflation rate. This understates the effective cost, because it fails to account for the fact that incomes have been rising after inflation. It doesn’t fully capture the chunk of income it cost the median household. For example, a new car in 1953 cost $1,850, which is $17,531 today after adjusting for CPI inflation.
You won’t get much new car for that today – Kelley’s Blue Book reports the average new car costs just over $40K. This is not much different than $37,511, the 1953 price adjusted by income growth. In other words, the average new car cost 44% of the median household’s income in 1953, and it’s 47% today. In relative terms, cars have kept track with incomes, not inflation. Milk and most groceries are much cheaper. Food commands less of a household budget than in the past. Color TVs are dramatically cheaper because they were only just being produced in the early 1950s.
Electronic goods such as TVs have long experienced deflation, because as their quality has improved the Bureau of Labor Statistics (BLS) converts this into a price drop. The CPI measures a basket of goods and services of constant utility, and a better TV at the same price is like a price cut. They try to adjust for the countless quality improvements that market economies deliver. The problem is that this kind of price cut doesn’t free up any cash to buy anything else. The BLS regards TVs as having fallen in price, even if the actual cost hasn’t.
Most products become better over time, and government statisticians expend much effort converting those improvements into imputed price cuts that don’t make you richer even if they add utility. It’s another example of the inflation statistics being theoretically correct and increasingly out of touch with people’s lives.
The average new home costs a little over 4X median household income, not much different than in 1953 although this is twice as much as if houses had simply risen with CPI inflation.
The Financial Times ran an article last week (see Why central bankers keep their cool over rising house prices) which found that separating out the value of shelter that home ownership provides is widely accepted by economists. The US isn’t alone in using a non-cash theoretical input for housing in its inflation statistics.
The article goes on to note that central bankers don’t worry about housing inflation because it rarely shows up in OER and its foreign equivalents. It’s a circular argument – OER is low because it’s not measuring the cash cost of home ownership, and therefore appears well behaved.
Median family incomes have always grown faster than inflation, but that gap has widened in recent years. Over the past decade, incomes grew twice as fast as inflation. This is mostly good news, because higher real incomes mean higher living standards. It’s bad news only for those whose incomes are tied to inflation since they’re slipping behind their peers at a faster rate than before.
The inflation statistics remain important for financial markets and those whose incomes are linked to it, but are steadily losing relevance for anyone who’s saving for the future.
We are invested in all the components of the American Energy Independence Index via the ETF that seeks to track its performance.
Important Disclosures
The information provided is for informational purposes only and investors should determine for themselves whether a particular service, security or product is suitable for their investment needs. The information contained herein is not complete, may not be current, is subject to change, and is subject to, and qualified in its entirety by, the more complete disclosures, risk factors and other terms that are contained in the disclosure, prospectus, and offering. Certain information herein has been obtained from third party sources and, although believed to be reliable, has not been independently verified and its accuracy or completeness cannot be guaranteed. No representation is made with respect to the accuracy, completeness or timeliness of this information. Nothing provided on this site constitutes tax advice. Individuals should seek the advice of their own tax advisor for specific information regarding tax consequences of investments. Investments in securities entail risk and are not suitable for all investors. This site is not a recommendation nor an offer to sell (or solicitation of an offer to buy) securities in the United States or in any other jurisdiction.
References to indexes and benchmarks are hypothetical illustrations of aggregate returns and do not reflect the performance of any actual investment. Investors cannot invest in an index and do not reflect the deduction of the advisor’s fees or other trading expenses. There can be no assurance that current investments will be profitable. Actual realized returns will depend on, among other factors, the value of assets and market conditions at the time of disposition, any related transaction costs, and the timing of the purchase. Indexes and benchmarks may not directly correlate or only partially relate to portfolios managed by SL Advisors as they have different underlying investments and may use different strategies or have different objectives than portfolios managed by SL Advisors (e.g. The Alerian index is a group MLP securities in the oil and gas industries. Portfolios may not include the same investments that are included in the Alerian Index. The S & P Index does not directly relate to investment strategies managed by SL Advisers.)
This site may contain forward-looking statements relating to the objectives, opportunities, and the future performance of the U.S. market generally. Forward-looking statements may be identified by the use of such words as; “believe,” “expect,” “anticipate,” “should,” “planned,” “estimated,” “potential” and other similar terms. Examples of forward-looking statements include, but are not limited to, estimates with respect to financial condition, results of operations, and success or lack of success of any particular investment strategy. All are subject to various factors, including, but not limited to general and local economic conditions, changing levels of competition within certain industries and markets, changes in interest rates, changes in legislation or regulation, and other economic, competitive, governmental, regulatory and technological factors affecting a portfolio’s operations that could cause actual results to differ materially from projected results. Such statements are forward-looking in nature and involves a number of known and unknown risks, uncertainties and other factors, and accordingly, actual results may differ materially from those reflected or contemplated in such forward-looking statements. Prospective investors are cautioned not to place undue reliance on any forward-looking statements or examples. None of SL Advisors LLC or any of its affiliates or principals nor any other individual or entity assumes any obligation to update any forward-looking statements as a result of new information, subsequent events or any other circumstances. All statements made herein speak only as of the date that they were made. r
Certain hyperlinks or referenced websites on the Site, if any, are for your convenience and forward you to third parties’ websites, which generally are recognized by their top level domain name. Any descriptions of, references to, or links to other products, publications or services does not constitute an endorsement, authorization, sponsorship by or affiliation with SL Advisors LLC with respect to any linked site or its sponsor, unless expressly stated by SL Advisors LLC. Any such information, products or sites have not necessarily been reviewed by SL Advisors LLC and are provided or maintained by third parties over whom SL Advisors LLC exercise no control. SL Advisors LLC expressly disclaim any responsibility for the content, the accuracy of the information, and/or quality of products or services provided by or advertised on these third-party sites.
All investment strategies have the potential for profit or loss. Different types of investments involve varying degrees of risk, and there can be no assurance that any specific investment will be suitable or profitable for a client’s investment portfolio.
Past performance of the American Energy Independence Index is not indicative of future returns.


Leave a Reply
Want to join the discussion?Feel free to contribute!