Why It’s No Longer Enough To Beat Inflation
The most recent CPI report was a little better than expected – all-items less food and energy was up 4.3% year-on-year. Used car prices had boosted prior inflation figures but were up just 0.2% in July. Owners’ Equivalent Rent (OER), the statistician’s’ quixotic means of measuring what it costs to attain shelter through home ownership, rose just 0.29% in July. It’s up 2.1% over the past year, compared with the Case Shiller National Home Price index which is +16.6% through May (most recent available).
CPI is important because it’s used to make cost of living adjustments to social security and other government transfer payments. It’s part of the return on inflation—linked bonds and is often used in long-term commercial contracts to make price adjustments. But it’s becoming less relevant as target against which to grow your income. Investing is all about retaining purchasing power for the future. Most interpret this as being able to afford in ten years what you could buy today. It turns out that’s CPI is inadequate for this.
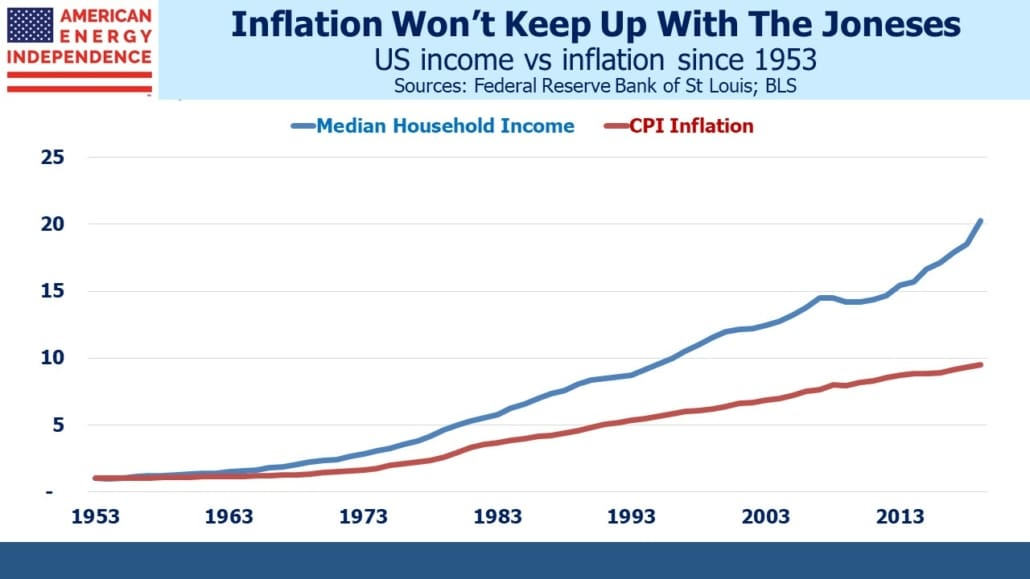
Because incomes grow faster than inflation, if your income fails to keep up with the median, you’ll be relatively poorer. Savers don’t just want to maintain today’s absolute purchasing power – they want to keep the same relative consumption as their peers. If you enjoy the median income today, growing it at CPI means falling below the median, and won’t feel like much fun. Average income has been dragged above the median by “the 1%”, or the increasing income inequality we often read about. So using the median provides a more representative figure for the typical family.
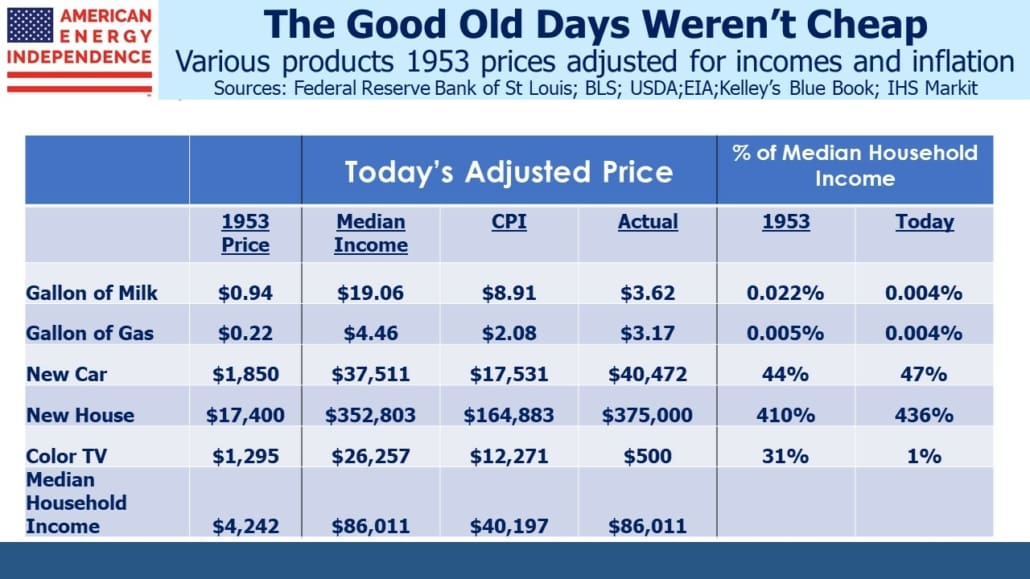
Whenever a writer quotes a price for something decades ago and converts it into “today’s dollars”, he’s using the CPI inflation rate. This understates the effective cost, because it fails to account for the fact that incomes have been rising after inflation. It doesn’t fully capture the chunk of income it cost the median household. For example, a new car in 1953 cost $1,850, which is $17,531 today after adjusting for CPI inflation.
You won’t get much new car for that today – Kelley’s Blue Book reports the average new car costs just over $40K. This is not much different than $37,511, the 1953 price adjusted by income growth. In other words, the average new car cost 44% of the median household’s income in 1953, and it’s 47% today. In relative terms, cars have kept track with incomes, not inflation. Milk and most groceries are much cheaper. Food commands less of a household budget than in the past. Color TVs are dramatically cheaper because they were only just being produced in the early 1950s.
Electronic goods such as TVs have long experienced deflation, because as their quality has improved the Bureau of Labor Statistics (BLS) converts this into a price drop. The CPI measures a basket of goods and services of constant utility, and a better TV at the same price is like a price cut. They try to adjust for the countless quality improvements that market economies deliver. The problem is that this kind of price cut doesn’t free up any cash to buy anything else. The BLS regards TVs as having fallen in price, even if the actual cost hasn’t.
Most products become better over time, and government statisticians expend much effort converting those improvements into imputed price cuts that don’t make you richer even if they add utility. It’s another example of the inflation statistics being theoretically correct and increasingly out of touch with people’s lives.
The average new home costs a little over 4X median household income, not much different than in 1953 although this is twice as much as if houses had simply risen with CPI inflation.
The Financial Times ran an article last week (see Why central bankers keep their cool over rising house prices) which found that separating out the value of shelter that home ownership provides is widely accepted by economists. The US isn’t alone in using a non-cash theoretical input for housing in its inflation statistics.
The article goes on to note that central bankers don’t worry about housing inflation because it rarely shows up in OER and its foreign equivalents. It’s a circular argument – OER is low because it’s not measuring the cash cost of home ownership, and therefore appears well behaved.
Median family incomes have always grown faster than inflation, but that gap has widened in recent years. Over the past decade, incomes grew twice as fast as inflation. This is mostly good news, because higher real incomes mean higher living standards. It’s bad news only for those whose incomes are tied to inflation since they’re slipping behind their peers at a faster rate than before.
The inflation statistics remain important for financial markets and those whose incomes are linked to it, but are steadily losing relevance for anyone who’s saving for the future.
We are invested in all the components of the American Energy Independence Index via the ETF that seeks to track its performance.


