Risk and Return Part Ways
More risk more return is a truism of finance, and much else besides. It makes intuitive sense (why bungee jump unless the rush of near-death exceeds the actual risk?) and also has a place in finance, via the Capital Asset Pricing Model (CAPM). This formalizes the relationship between risk and return, allowing securities to be priced, or shown to be mis-priced, relative to one another.
Finding fault in elegant algebraic solutions to markets occupies the minds of many. CAPM has long been known to be flawed – in reality, it turns out that investors pay more than they should for risky stocks, and pay too little for more stable ones. Many of Warren Buffett’s holdings exploit this inefficient bias.
Since taking more risk for less return should leave an investor poorer over time than following CAPM, why does he do it? An explanation that we’ve always liked relies on the misalignment of interests between many asset managers and their clients.
Funds flow in the direction of performance. It’s much easier to find new clients when things are going up, and in that environment it doesn’t pay to deliver middling performance. The simplest way to beat a rising market is to take more risk – hence, actively managed funds are generally found to have a beta above 1.0 (the market’s beta is 1.0).
Such funds should correspondingly underperform when markets are falling – but since it’s harder finding new clients in such an environment, poor relative performance doesn’t hurt much. The asset manager’s asymmetric business model (“heads I win big, tails I lose a bit”) doesn’t match the investor’s, for whom ups and down of equal magnitude cancel out.
The solution is for clients to reject fund managers who aren’t heavily invested alongside them. This ensures that the linear exposure to market returns is felt by the fund manager and clients, creating a proper alignment of interests. Not surprisingly, your blogger’s fund business fits this model, otherwise you wouldn’t be reading this article.
Recent market performance has turned this relationship on its head – investors seeking more risk are being handsomely rewarded, while those holding more stable names are watching them languish. It’s like CAPM on steroids – not just more return for more risk, but much more. Low vol stocks are delivering less than half of the returns of the market with slightly higher volatility.
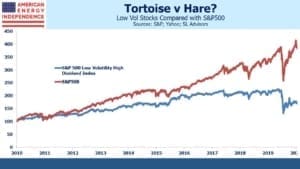
This can be seen by comparing the S&P500 Low Vol High Dividend index (LVHD) with the S&P500.
Through 2016, they mostly tracked one another, with LVHD’s underperformance roughly commensurate with its lower risk. Over the next three years the gap widened. Starting in January, perhaps not coincidentally around the time Covid-19 entered into common conversation, the relationship shifted dramatically. Since then, the S&P500 has made new highs, while LVHD remains 20% off its best levels.
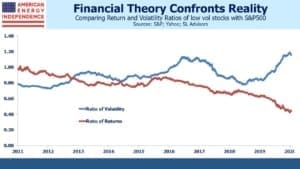
The second chart takes the ratio of returns between the two indices, and volatility (defined here as the average daily move over the prior year). Prior to 2016 the two lines roughly matched each other, confirming the risk/return symmetry of CAPM. Since then, and most dramatically this year, the relationship has broken. Supposedly less risky stocks are moving more than they should relative to the market, and more risky stocks are over-delivering good returns.
It’s well known that the extreme social distancing and other steps to impede virus transmission favored technology stocks, and anything that helps people live without proximity to others. The winners are not low vol stocks, and the recent shift towards growth has been dramatic.
In the late 1990s, tech stocks generated very strong outperformance against the market as investors grasped the internet’s enormous potential. LVHD doesn’t extend back that far, but other work we’ve done shows the same lagging results of stable stocks. Berkshire’s portfolio was among them.
The subsequent 2000-02 bursting of the internet bubble reversed everything.
The market’s inconsiderate recovery since the lows in March (see The Stock Market’s Heartless Optimism) has been driven by the pandemic’s economic winners, even though many find this an incongruous concept during a severe worldwide recession. Nonetheless, as improving treatments and immunity, eventually aided by vaccines, restore much of our former lives, the market will re-sort the winners and losers. Stable businesses with reliable dividends will be back in vogue.
We are invested in all the components of the American Energy Independence Index via the ETF that seeks to track its performance
Important Disclosures
The information provided is for informational purposes only and investors should determine for themselves whether a particular service, security or product is suitable for their investment needs. The information contained herein is not complete, may not be current, is subject to change, and is subject to, and qualified in its entirety by, the more complete disclosures, risk factors and other terms that are contained in the disclosure, prospectus, and offering. Certain information herein has been obtained from third party sources and, although believed to be reliable, has not been independently verified and its accuracy or completeness cannot be guaranteed. No representation is made with respect to the accuracy, completeness or timeliness of this information. Nothing provided on this site constitutes tax advice. Individuals should seek the advice of their own tax advisor for specific information regarding tax consequences of investments. Investments in securities entail risk and are not suitable for all investors. This site is not a recommendation nor an offer to sell (or solicitation of an offer to buy) securities in the United States or in any other jurisdiction.
References to indexes and benchmarks are hypothetical illustrations of aggregate returns and do not reflect the performance of any actual investment. Investors cannot invest in an index and do not reflect the deduction of the advisor’s fees or other trading expenses. There can be no assurance that current investments will be profitable. Actual realized returns will depend on, among other factors, the value of assets and market conditions at the time of disposition, any related transaction costs, and the timing of the purchase. Indexes and benchmarks may not directly correlate or only partially relate to portfolios managed by SL Advisors as they have different underlying investments and may use different strategies or have different objectives than portfolios managed by SL Advisors (e.g. The Alerian index is a group MLP securities in the oil and gas industries. Portfolios may not include the same investments that are included in the Alerian Index. The S & P Index does not directly relate to investment strategies managed by SL Advisers.)
This site may contain forward-looking statements relating to the objectives, opportunities, and the future performance of the U.S. market generally. Forward-looking statements may be identified by the use of such words as; “believe,” “expect,” “anticipate,” “should,” “planned,” “estimated,” “potential” and other similar terms. Examples of forward-looking statements include, but are not limited to, estimates with respect to financial condition, results of operations, and success or lack of success of any particular investment strategy. All are subject to various factors, including, but not limited to general and local economic conditions, changing levels of competition within certain industries and markets, changes in interest rates, changes in legislation or regulation, and other economic, competitive, governmental, regulatory and technological factors affecting a portfolio’s operations that could cause actual results to differ materially from projected results. Such statements are forward-looking in nature and involves a number of known and unknown risks, uncertainties and other factors, and accordingly, actual results may differ materially from those reflected or contemplated in such forward-looking statements. Prospective investors are cautioned not to place undue reliance on any forward-looking statements or examples. None of SL Advisors LLC or any of its affiliates or principals nor any other individual or entity assumes any obligation to update any forward-looking statements as a result of new information, subsequent events or any other circumstances. All statements made herein speak only as of the date that they were made. r
Certain hyperlinks or referenced websites on the Site, if any, are for your convenience and forward you to third parties’ websites, which generally are recognized by their top level domain name. Any descriptions of, references to, or links to other products, publications or services does not constitute an endorsement, authorization, sponsorship by or affiliation with SL Advisors LLC with respect to any linked site or its sponsor, unless expressly stated by SL Advisors LLC. Any such information, products or sites have not necessarily been reviewed by SL Advisors LLC and are provided or maintained by third parties over whom SL Advisors LLC exercise no control. SL Advisors LLC expressly disclaim any responsibility for the content, the accuracy of the information, and/or quality of products or services provided by or advertised on these third-party sites.
All investment strategies have the potential for profit or loss. Different types of investments involve varying degrees of risk, and there can be no assurance that any specific investment will be suitable or profitable for a client’s investment portfolio.
Past performance of the American Energy Independence Index is not indicative of future returns.


Leave a Reply
Want to join the discussion?Feel free to contribute!