Risk and Return Part Ways
More risk more return is a truism of finance, and much else besides. It makes intuitive sense (why bungee jump unless the rush of near-death exceeds the actual risk?) and also has a place in finance, via the Capital Asset Pricing Model (CAPM). This formalizes the relationship between risk and return, allowing securities to be priced, or shown to be mis-priced, relative to one another.
Finding fault in elegant algebraic solutions to markets occupies the minds of many. CAPM has long been known to be flawed – in reality, it turns out that investors pay more than they should for risky stocks, and pay too little for more stable ones. Many of Warren Buffett’s holdings exploit this inefficient bias.
Since taking more risk for less return should leave an investor poorer over time than following CAPM, why does he do it? An explanation that we’ve always liked relies on the misalignment of interests between many asset managers and their clients.
Funds flow in the direction of performance. It’s much easier to find new clients when things are going up, and in that environment it doesn’t pay to deliver middling performance. The simplest way to beat a rising market is to take more risk – hence, actively managed funds are generally found to have a beta above 1.0 (the market’s beta is 1.0).
Such funds should correspondingly underperform when markets are falling – but since it’s harder finding new clients in such an environment, poor relative performance doesn’t hurt much. The asset manager’s asymmetric business model (“heads I win big, tails I lose a bit”) doesn’t match the investor’s, for whom ups and down of equal magnitude cancel out.
The solution is for clients to reject fund managers who aren’t heavily invested alongside them. This ensures that the linear exposure to market returns is felt by the fund manager and clients, creating a proper alignment of interests. Not surprisingly, your blogger’s fund business fits this model, otherwise you wouldn’t be reading this article.
Recent market performance has turned this relationship on its head – investors seeking more risk are being handsomely rewarded, while those holding more stable names are watching them languish. It’s like CAPM on steroids – not just more return for more risk, but much more. Low vol stocks are delivering less than half of the returns of the market with slightly higher volatility.
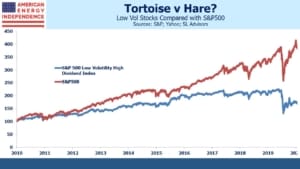
This can be seen by comparing the S&P500 Low Vol High Dividend index (LVHD) with the S&P500.
Through 2016, they mostly tracked one another, with LVHD’s underperformance roughly commensurate with its lower risk. Over the next three years the gap widened. Starting in January, perhaps not coincidentally around the time Covid-19 entered into common conversation, the relationship shifted dramatically. Since then, the S&P500 has made new highs, while LVHD remains 20% off its best levels.
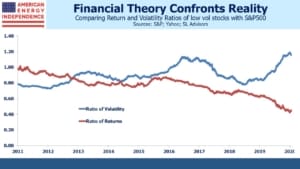
The second chart takes the ratio of returns between the two indices, and volatility (defined here as the average daily move over the prior year). Prior to 2016 the two lines roughly matched each other, confirming the risk/return symmetry of CAPM. Since then, and most dramatically this year, the relationship has broken. Supposedly less risky stocks are moving more than they should relative to the market, and more risky stocks are over-delivering good returns.
It’s well known that the extreme social distancing and other steps to impede virus transmission favored technology stocks, and anything that helps people live without proximity to others. The winners are not low vol stocks, and the recent shift towards growth has been dramatic.
In the late 1990s, tech stocks generated very strong outperformance against the market as investors grasped the internet’s enormous potential. LVHD doesn’t extend back that far, but other work we’ve done shows the same lagging results of stable stocks. Berkshire’s portfolio was among them.
The subsequent 2000-02 bursting of the internet bubble reversed everything.
The market’s inconsiderate recovery since the lows in March (see The Stock Market’s Heartless Optimism) has been driven by the pandemic’s economic winners, even though many find this an incongruous concept during a severe worldwide recession. Nonetheless, as improving treatments and immunity, eventually aided by vaccines, restore much of our former lives, the market will re-sort the winners and losers. Stable businesses with reliable dividends will be back in vogue.
We are invested in all the components of the American Energy Independence Index via the ETF that seeks to track its performance

