2017 Low Vol Outlook
Although we mostly write about the energy infrastructure sector, we also run an investment strategy designed around low volatility stocks. There’s generally less to say on this sector – we long ago concluded that exploiting the relative under-pricing of such stocks could not be improved much with market timing. So we hold securities we’d be happy to hold for years and generally don’t mess with it too much. We define low vol stocks as businesses that have a long history of steady earnings and dividend growth, above average return on invested capital, moderate need for ongoing capital expenditure, dividend yield above 3% and volatility approximately less than half that of the S&P500. We run three versions of this strategy: Low Vol Long Only, Low Vol Hedged and Low Vol Best Ideas. For more detail about this strategy see Why the Tortoise Beats the Hare and check out our Strategies page.
2016 was a good year for this type of investing – last January we had no idea this would turn out to be the case beyond a suspicion that mean reversion would cause 2015’s relatively flat results to be improved upon. Active managers tend to pick stocks that will move more than the market. Otherwise, demonstrating skill at security selection would take too long. Slow moving stocks deliver their results slowly, and if you’re going to fail at something it’s better to do so quickly so you can move on to the next thing. Consequently, low vol stocks experience little love from the CNBC crowd. This in turn makes them interesting if your goal is the best chance of steady, relatively tax efficient appreciation in your portfolio. We sometimes describe it as low octane equity exposure – good for someone who likes stocks but is wary of a big drop. These stocks will drop too, but generally not as far and when they are down at least they won’t give your wife reason to question your sanity (see How To Invest Like A Woman in our June 2014 newsletter).
We check the results of this strategy every day and I can tell you it’s impossible to predict its performance even if you know what the broader market has done. This low correlation with the S&P500 is complemented by a tendency to do relatively poorly in a strong market and relatively well in a weak one. In a hedged format one might expect it to lose money when stocks are up a lot and make money when they’re down, a useful form of diversification to most portfolios.
This brings us to the outlook for 2017. Since we noted in the first paragraph that we don’t see much benefit to timing this strategy, those looking for such insight will be disappointed. However, we have given more thought than normal to this issue because of the election. Trump’s victory didn’t just suggest alternative employment to pollsters; it has led to significant portfolio shifts as investors adjust to a sharply different outlook for many elements of Federal government policy including fiscal, trade, health care, regulatory and defense.
While the direction of Trump’s policies can be reasonably guessed at, their execution and possible unintended consequences are hard to assess at this point. Fiscal expansion with tax cuts will increase Federal borrowing. The Fed’s glacial pace of tightening will quicken, although on their forecast of three hikes in 2017 we’d take the under. A stronger US$ will moderate GDP growth from being quite as high as fiscal stimulus would otherwise drive it. The specific impact of trade conflict is very hard to predict.
It’s quite possible that stocks could deliver double digit returns next year, propelled by a cyclical upswing in earnings. Low vol stocks would not be the sector of choice in such an environment. Hedged low vol stocks might lose money.
The blogging investment manager creates countless opportunities for public embarrassment, and what follows is potentially another. Our inclination not to modify our low vol strategy in this light reflects not arrogant certainty, but instead a modest acknowledgment that tactical shifts are hard to do well. Investing is all about choices – it’s meaningless to describe an asset class as expensive except by reference to another, cheaper one.
It starts with interest rates, since they (1) define the discount rate at which future cashflows are valued, and (2) represent the main alternative to stocks. Yields on ten year U.S. treasuries may have put in their absolute low in 2016, but that doesn’t mean that they will quickly return to a level which discerning investors might consider attractive. We’ve noted before that the Federal Open Market Committee (FOMC) rarely misses an opportunity to do nothing when a previous Fed chair would have acted. Betting on them not doing what they threaten has worked for long enough now that there seems little point in overthinking things. We’d have to be surprised first before changing our view. So on the Fed’s forecast of three tightenings in 2017, we think two is more likely. For more on our past musings on Bonds see Bonds Are Dead Money.

Assume a ten year yield 0.50% higher at around 3%, and 2017 S&P500 Earnings Per Share (EPS) of $131.75 (the average of the FactSet Top-Down and Bottom-Up forecasts). The Equity Risk Premium in the chart above still favors stocks over bonds. We may be in an environment in which real interest rates (i.e. treasury yields minus expected inflation) are permanently low. If so, we’re unlikely to favor bonds anytime soon. The spread between yields and stocks would need to be at least 2% narrower before we’d assess bonds were competitive with stocks. We’re not holding our breath.
So if the S&P500 continues to offer better prospects than bonds, what about low vol stocks? The macro shifts outlined above have prompted many commentators to question their prospects. And yet, on a relative valuation basis using trailing Price/Earnings ratios, low vol stocks if anything look relatively cheap compared with the broad index. The two areas circled show the S&P500’s P/E of just over 21X with the S&P500 Low Vol Index figure of just under 20X, and compares with their history over the past three years.
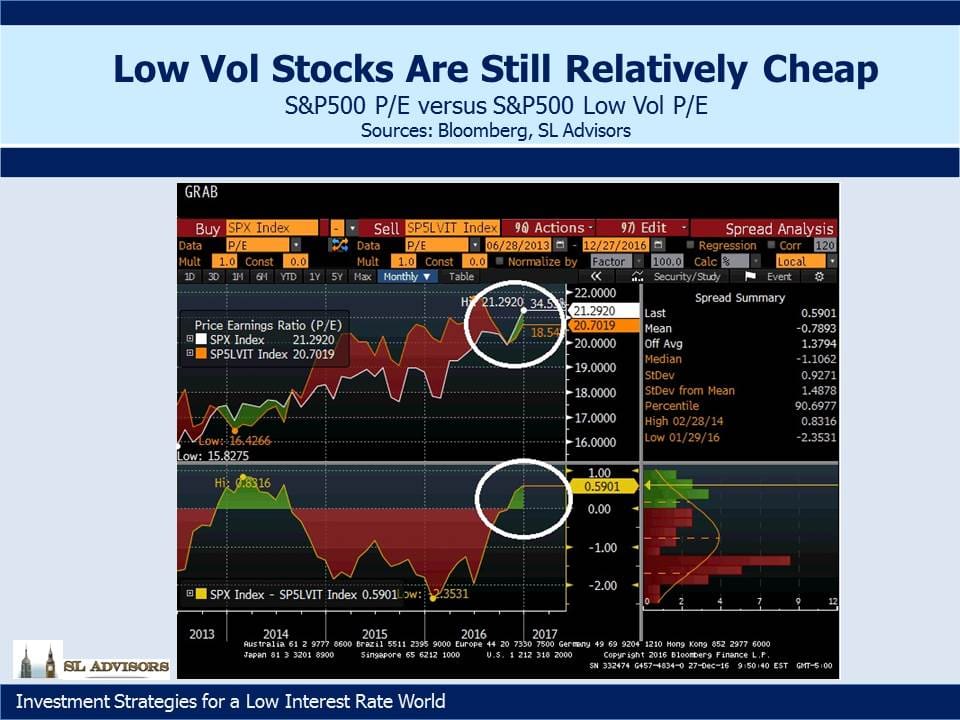
The two charts aren’t definitive, but together they provide us with sufficient basis to be optimistic about the long run performance of our low vol strategies continuing. Forecasting the next couple of quarters is very hard, but over longer periods we believe we are increasingly likely to be happy with the result.

Important Disclosures
The information provided is for informational purposes only and investors should determine for themselves whether a particular service, security or product is suitable for their investment needs. The information contained herein is not complete, may not be current, is subject to change, and is subject to, and qualified in its entirety by, the more complete disclosures, risk factors and other terms that are contained in the disclosure, prospectus, and offering. Certain information herein has been obtained from third party sources and, although believed to be reliable, has not been independently verified and its accuracy or completeness cannot be guaranteed. No representation is made with respect to the accuracy, completeness or timeliness of this information. Nothing provided on this site constitutes tax advice. Individuals should seek the advice of their own tax advisor for specific information regarding tax consequences of investments. Investments in securities entail risk and are not suitable for all investors. This site is not a recommendation nor an offer to sell (or solicitation of an offer to buy) securities in the United States or in any other jurisdiction.
References to indexes and benchmarks are hypothetical illustrations of aggregate returns and do not reflect the performance of any actual investment. Investors cannot invest in an index and do not reflect the deduction of the advisor’s fees or other trading expenses. There can be no assurance that current investments will be profitable. Actual realized returns will depend on, among other factors, the value of assets and market conditions at the time of disposition, any related transaction costs, and the timing of the purchase. Indexes and benchmarks may not directly correlate or only partially relate to portfolios managed by SL Advisors as they have different underlying investments and may use different strategies or have different objectives than portfolios managed by SL Advisors (e.g. The Alerian index is a group MLP securities in the oil and gas industries. Portfolios may not include the same investments that are included in the Alerian Index. The S & P Index does not directly relate to investment strategies managed by SL Advisers.)
This site may contain forward-looking statements relating to the objectives, opportunities, and the future performance of the U.S. market generally. Forward-looking statements may be identified by the use of such words as; “believe,” “expect,” “anticipate,” “should,” “planned,” “estimated,” “potential” and other similar terms. Examples of forward-looking statements include, but are not limited to, estimates with respect to financial condition, results of operations, and success or lack of success of any particular investment strategy. All are subject to various factors, including, but not limited to general and local economic conditions, changing levels of competition within certain industries and markets, changes in interest rates, changes in legislation or regulation, and other economic, competitive, governmental, regulatory and technological factors affecting a portfolio’s operations that could cause actual results to differ materially from projected results. Such statements are forward-looking in nature and involves a number of known and unknown risks, uncertainties and other factors, and accordingly, actual results may differ materially from those reflected or contemplated in such forward-looking statements. Prospective investors are cautioned not to place undue reliance on any forward-looking statements or examples. None of SL Advisors LLC or any of its affiliates or principals nor any other individual or entity assumes any obligation to update any forward-looking statements as a result of new information, subsequent events or any other circumstances. All statements made herein speak only as of the date that they were made. r
Certain hyperlinks or referenced websites on the Site, if any, are for your convenience and forward you to third parties’ websites, which generally are recognized by their top level domain name. Any descriptions of, references to, or links to other products, publications or services does not constitute an endorsement, authorization, sponsorship by or affiliation with SL Advisors LLC with respect to any linked site or its sponsor, unless expressly stated by SL Advisors LLC. Any such information, products or sites have not necessarily been reviewed by SL Advisors LLC and are provided or maintained by third parties over whom SL Advisors LLC exercise no control. SL Advisors LLC expressly disclaim any responsibility for the content, the accuracy of the information, and/or quality of products or services provided by or advertised on these third-party sites.
All investment strategies have the potential for profit or loss. Different types of investments involve varying degrees of risk, and there can be no assurance that any specific investment will be suitable or profitable for a client’s investment portfolio.
Past performance of the American Energy Independence Index is not indicative of future returns.
Leave a Reply
Want to join the discussion?Feel free to contribute!