MLPs: This Time Is Different
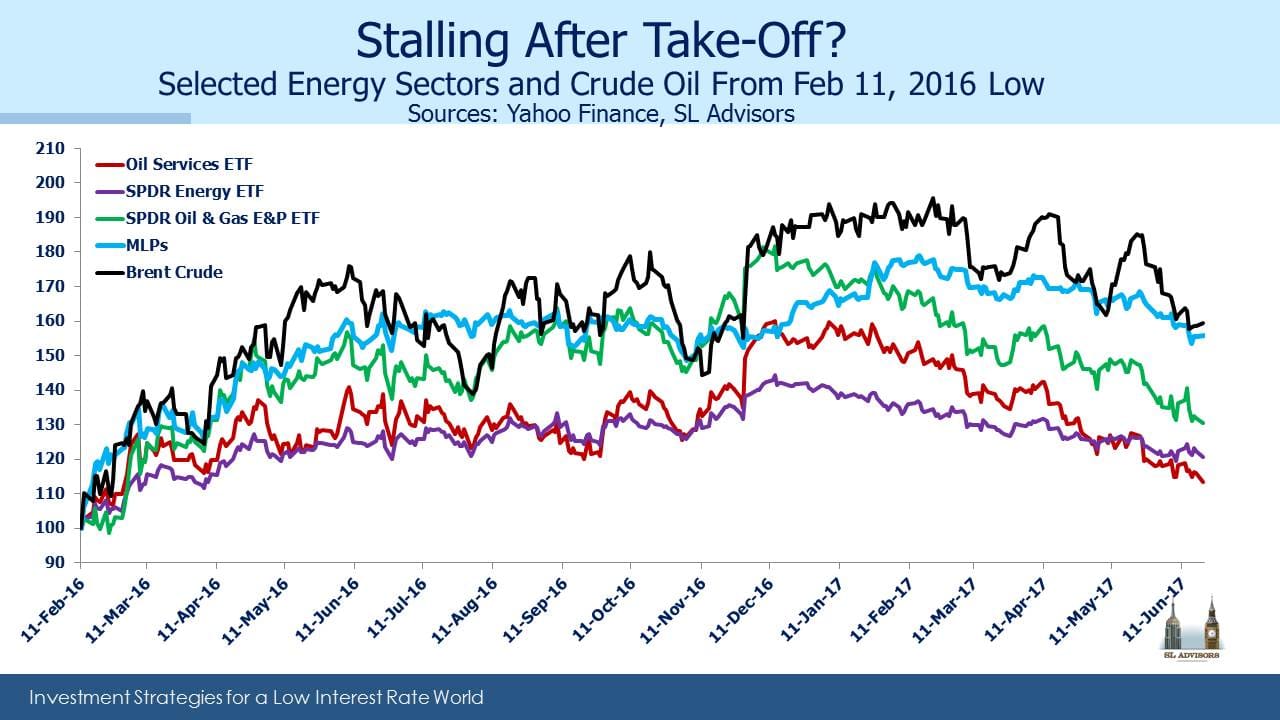
It’ll be no surprise to MLP investors that the correlation of our asset class with crude oil has been rising. Falling crude in 2015 led MLPs to drop 58.2% from high to low, a figure we won’t soon forget. That same institutional memory among investors is imposing a similar relationship today. Last time, lower oil led to lower U.S. production, posing challenges for midstream infrastructure businesses with surplus capacity. This time, higher U.S. production is leading to lower crude prices. In This Time Is Different, Reinhart and Rogoff take readers through the many financial disasters that befell investors who thought it was different. And yet, with due deference to the aforementioned luminaries, we think it is.
Last week we received more questions than usual from investors reviewing the mark-to-market damage inflicted by their MLP allocations. One investor noted that MLPs were responsible for fully all of the YTD losses in one model portfolio they run. If you’re wondering whether the relentless sellers possess an insight you’re missing, you have plenty of company. Higher production of hydrocarbons in the U.S. is bad for lots of players including OPEC, but it’s hard to fathom why it’s bad for the domestic infrastructure that supports the Shale Revolution. American shale oil output is on track to grow by 1 Million Barrels a Day (MMB/D) annually. Shale output of 5.4 MMB/D is now more than half of total U.S. oil production of 9.3 MMB/D, in a global oil market that’s producing 98 MMB/D. Furthermore, the fact that U.S. shale producers are growing production at ever lower costs is more likely bad for the other 95% of global producers.
The market is failing to differentiate U.S midstream energy companies that benefit from this growth in market share from the rest of the global energy losers. At the annual MLPA Conference in Orlando a few weeks ago, MLP managements were similarly puzzled by the weakness in their stock prices. But they were far less worried than most investors, because they generally don’t need to tap the capital markets much to finance their growth plans.
It’s hard to find research that is bearish on MLPs, which is not especially comforting from a contrarian standpoint. The most negative case is probably the view that crude is going to $30 and will take MLPs lower with it. Before ascribing some additional insight to sellers, remember that over $40BN of retail money accesses the asset class inefficiently via taxable, C-corp funds such as AMLP (see Some MLP Investors Get Taxed Twice). Our investors, self-selected as they are, are an intelligent bunch. But they (you) are not representative of an investor base that includes those who accept a 35% corporate tax drag on their returns. Investment insight is going to be rare among this subset, and based on published fund flows they are responsible for some portion of the recent selling.
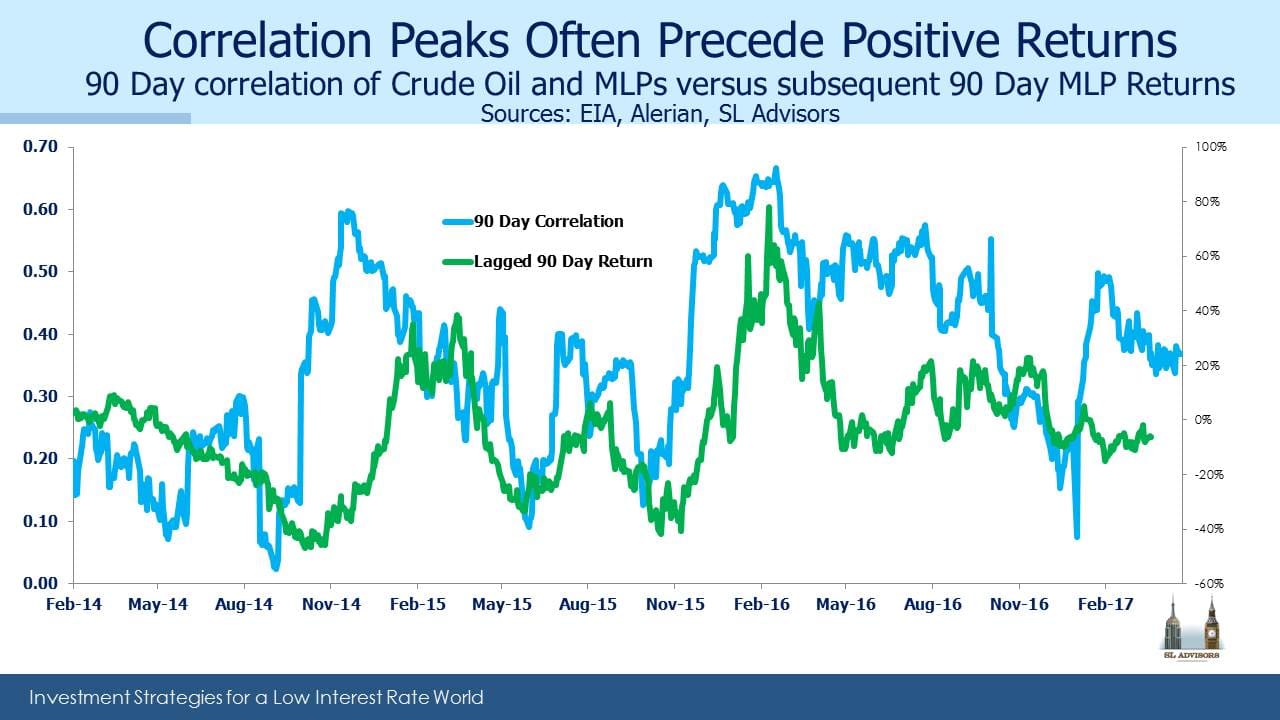
For those who enjoy analyzing statistical qualities of returns, the chart below compares the correlation of MLPs with crude oil and subsequent performance. It turns out that following periods of high MLP/crude correlation, MLPs do rather well. The 30 day correlation is 0.61, so the 90 day correlation used in the chart below is most assuredly heading higher over the next few weeks. A high 90 day correlation is typically followed by a good 90 day return. The correlation of this relationship is 0.63. It’s been said that if you torture the data enough it’ll tell you whatever you like, and some may believe that’s what’s going on here.
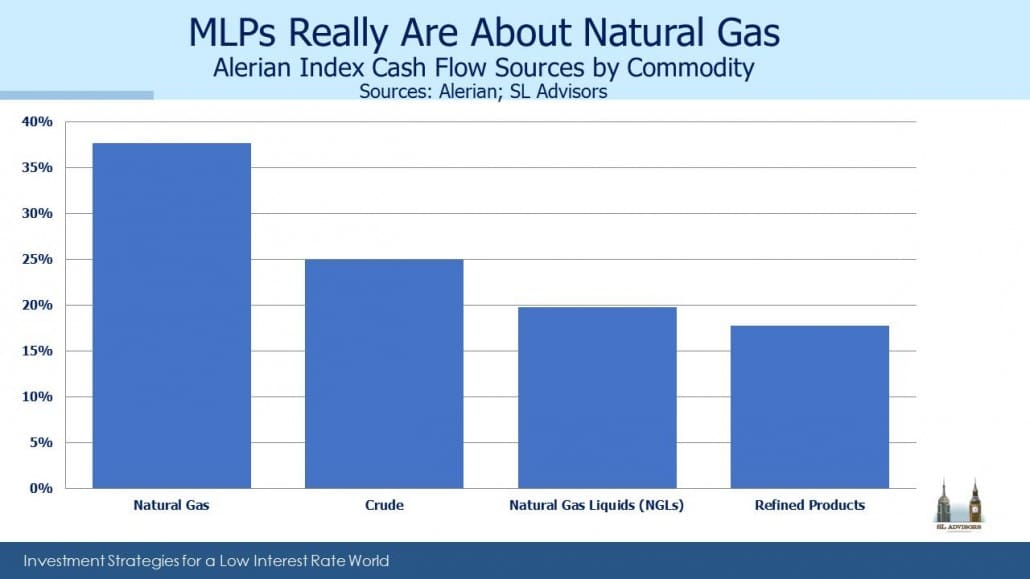
On the other hand, MLPs and crude oil shouldn’t move together nearly as much as they do, so when they dance too closely perhaps nervous sellers create an opportunity. In researching the components of the Alerian MLP Index, we calculate that only 25% of the cashflows are derived from crude oil. Some large MLPs have very little crude exposure, including Enterprise Products (EPD) at 17% and Williams Partners (WPZ) with 5%. Others such as Oneok Partners (OKS) and EQT Midstream (EQMP) have 0%. And this is the percentage of their cashflows derived from volumes of crude passing through their systems, which are only loosely affected by the price of crude. Natural Gas Liquids (mostly Ethane, Propane, Butane, Iso-butane and Pentane) are most commonly separated from the natural gas (Methane) with which they’re extracted. NGL prices tend to move with crude oil, but together these still represent less than half the cashflows of the Alerian index. As with crude, volumes are the principal driver of NGL-related cashflows, with their prices being of secondary importance. Nonetheless, MLP prices move with crude oil, reinforcing the understandable fixation MLP investors have with oil even though it’s hard to justify based on underlying fundamentals. In our fund we have an overweight to crude oil-oriented infrastructure businesses, but we estimate this at around 32%, so 7% higher than the index.
On another topic, last week we fielded a few questions from holders of Rice Midstream Partners (RMP). EQT recently acquired RMP’s General Partner (GP) Rice Energy (RICE). RMP slumped, because it highlighted a theme of our investing, which is that you don’t need to own an MLP to control it; owning the GP is sufficient. RMP investors have few rights, and the supply of accretive dropdowns they were expecting from their GP will now be redirected to EQM, a loss of future value over which RMP investors have little recourse. It’s why we invest in GPs (see MLPs and Hedge Funds Are More Alike Than You Think).
We are invested in EPD, EQGP (GP of EQM), Oneok (OKE, GP of OKS) and Williams Companies (WMB, GP of WPZ).

Important Disclosures
The information provided is for informational purposes only and investors should determine for themselves whether a particular service, security or product is suitable for their investment needs. The information contained herein is not complete, may not be current, is subject to change, and is subject to, and qualified in its entirety by, the more complete disclosures, risk factors and other terms that are contained in the disclosure, prospectus, and offering. Certain information herein has been obtained from third party sources and, although believed to be reliable, has not been independently verified and its accuracy or completeness cannot be guaranteed. No representation is made with respect to the accuracy, completeness or timeliness of this information. Nothing provided on this site constitutes tax advice. Individuals should seek the advice of their own tax advisor for specific information regarding tax consequences of investments. Investments in securities entail risk and are not suitable for all investors. This site is not a recommendation nor an offer to sell (or solicitation of an offer to buy) securities in the United States or in any other jurisdiction.
References to indexes and benchmarks are hypothetical illustrations of aggregate returns and do not reflect the performance of any actual investment. Investors cannot invest in an index and do not reflect the deduction of the advisor’s fees or other trading expenses. There can be no assurance that current investments will be profitable. Actual realized returns will depend on, among other factors, the value of assets and market conditions at the time of disposition, any related transaction costs, and the timing of the purchase. Indexes and benchmarks may not directly correlate or only partially relate to portfolios managed by SL Advisors as they have different underlying investments and may use different strategies or have different objectives than portfolios managed by SL Advisors (e.g. The Alerian index is a group MLP securities in the oil and gas industries. Portfolios may not include the same investments that are included in the Alerian Index. The S & P Index does not directly relate to investment strategies managed by SL Advisers.)
This site may contain forward-looking statements relating to the objectives, opportunities, and the future performance of the U.S. market generally. Forward-looking statements may be identified by the use of such words as; “believe,” “expect,” “anticipate,” “should,” “planned,” “estimated,” “potential” and other similar terms. Examples of forward-looking statements include, but are not limited to, estimates with respect to financial condition, results of operations, and success or lack of success of any particular investment strategy. All are subject to various factors, including, but not limited to general and local economic conditions, changing levels of competition within certain industries and markets, changes in interest rates, changes in legislation or regulation, and other economic, competitive, governmental, regulatory and technological factors affecting a portfolio’s operations that could cause actual results to differ materially from projected results. Such statements are forward-looking in nature and involves a number of known and unknown risks, uncertainties and other factors, and accordingly, actual results may differ materially from those reflected or contemplated in such forward-looking statements. Prospective investors are cautioned not to place undue reliance on any forward-looking statements or examples. None of SL Advisors LLC or any of its affiliates or principals nor any other individual or entity assumes any obligation to update any forward-looking statements as a result of new information, subsequent events or any other circumstances. All statements made herein speak only as of the date that they were made. r
Certain hyperlinks or referenced websites on the Site, if any, are for your convenience and forward you to third parties’ websites, which generally are recognized by their top level domain name. Any descriptions of, references to, or links to other products, publications or services does not constitute an endorsement, authorization, sponsorship by or affiliation with SL Advisors LLC with respect to any linked site or its sponsor, unless expressly stated by SL Advisors LLC. Any such information, products or sites have not necessarily been reviewed by SL Advisors LLC and are provided or maintained by third parties over whom SL Advisors LLC exercise no control. SL Advisors LLC expressly disclaim any responsibility for the content, the accuracy of the information, and/or quality of products or services provided by or advertised on these third-party sites.
All investment strategies have the potential for profit or loss. Different types of investments involve varying degrees of risk, and there can be no assurance that any specific investment will be suitable or profitable for a client’s investment portfolio.
Past performance of the American Energy Independence Index is not indicative of future returns.
And not to mention a bunch of these have new projects coming on line and have a couple of years of expanding cash flows which will either manifest in higher distributions or higher coverage ratios/growth rate in cash flows per share/unit….back up the truck
Thanks, Simon, I’m with you here, and one could also use the exact same logic for the Hydraulic Fracturing Sand miners/suppliers who have been unjustifiably punished recently, whilst growing both top and bottom line revenue as production ramps up.