The Slow Shift in Power
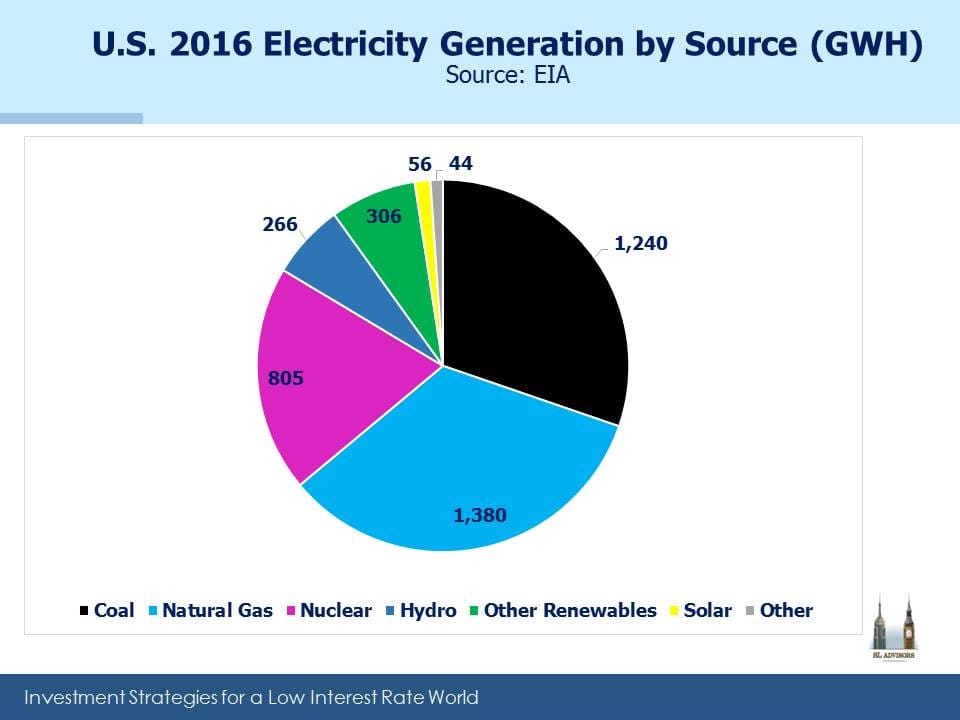
The U.S. produces electricity from diverse sources; burning coal and natural gas each provide just under a third of our needs (natural gas is steadily displacing coal, which is good for those MLPs that transport, process and store natural gas). Nuclear is 19%, with the rest being other renewables of which hydro is the biggest. Solar from all sources (which includes both utility scale production as well as rooftop panels that supply back to the grid) is currently 1.4%. In 2016 we used around 4,100 TWH (Terrawatt Hours).
To explain the dizzying numbers: One Terrawatt (TW) is 1,000 Gigawatts (GW). One Gigawatt is 1,000 Megawatts (MW). Capacity is measured by output capability, while use is measured by quantity consumed per hour. So a 100MW power plant could supply 100MWH if it ran at 100% capacity for sixty minutes.
For those who forecast big shifts in how the U.S. generates electricity, year-to-year change is disappointingly slow. This is because the net additions to electricity generating capacity each year are only a small fraction of total capacity.
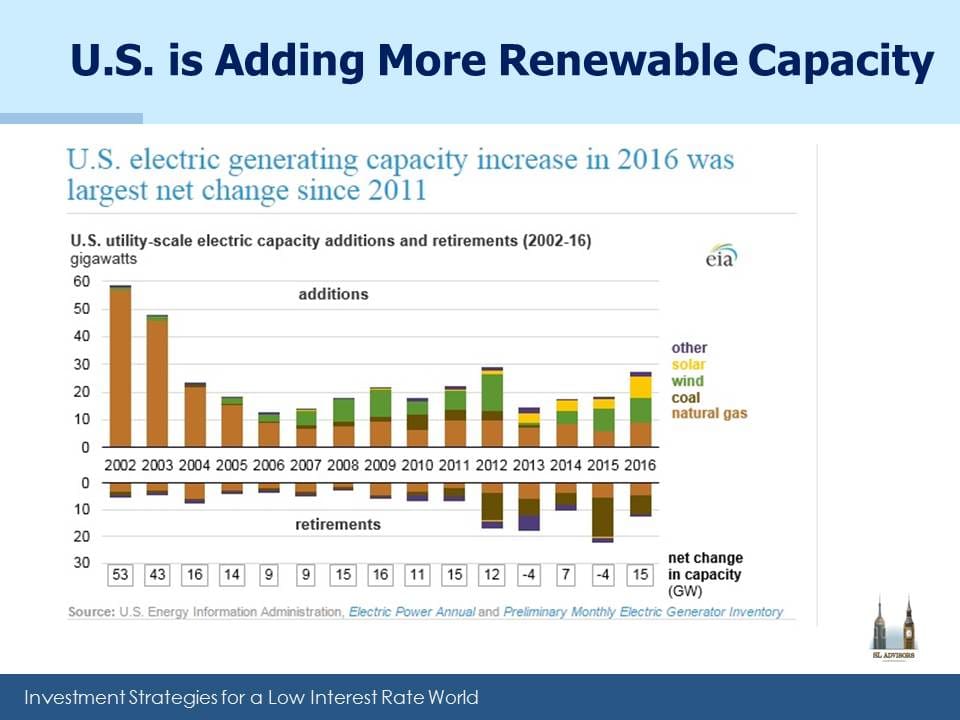
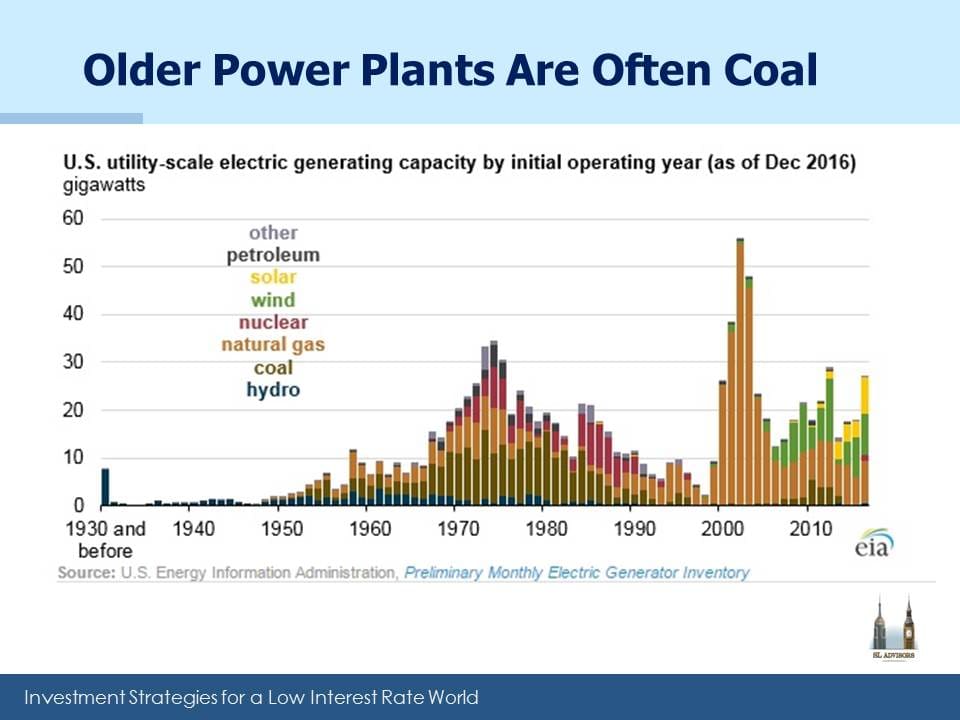
Last year we added 15 GW of net new generating capacity, the biggest in five years including a decent jump in wind and solar. Also notable was the ongoing retirement of coal plants. As the third chart shows, this is likely to continue because older power plants are more likely to be coal-burning. The challenge with wind and solar is that it’s not always windy and sunny, and since commercially viable, large scale storage is still ahead of us, utilization is lower for these categories than others.
To illustrate how slowly the existing electricity generation capacity changes, consider these figures: total generation capacity is 1.1 TW, or 1,100 GW. Very approximately, 1.1TW of capacity could theoretically produce 9,600 TWH in a year if everything ran at 100% (i.e. 1.1 X 365 days X 24 hours in a day is 9,636). So our consumption means we used 42% of this theoretical capacity. Since power needs fluctuate depending on the time of days as well as the seasons, and facilities need to be shut down for periodic maintenance, the industry is more efficient than this sounds.
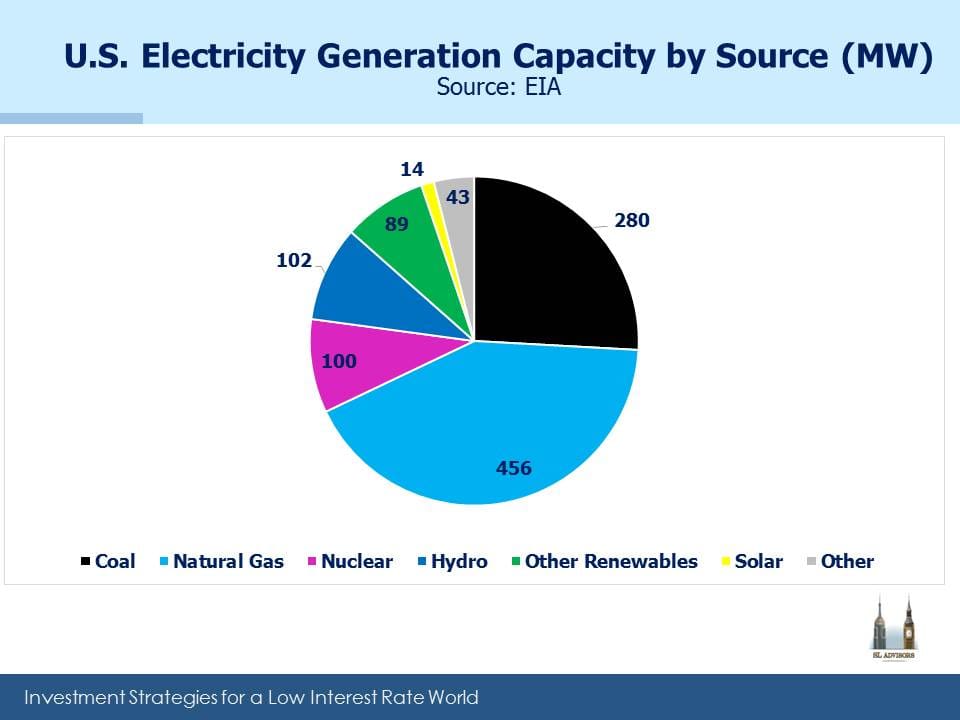
But it puts the 15GW of new capacity in perspective since it represents around 1.5% of the installed base. Even this overstates its impact because of the lower utilization rates of wind and solar.
Change is surely coming to how we source our power. Future generations will almost certainly rely far more heavily on solar. But over the next decade or so, change will appear slow.

Important Disclosures
The information provided is for informational purposes only and investors should determine for themselves whether a particular service, security or product is suitable for their investment needs. The information contained herein is not complete, may not be current, is subject to change, and is subject to, and qualified in its entirety by, the more complete disclosures, risk factors and other terms that are contained in the disclosure, prospectus, and offering. Certain information herein has been obtained from third party sources and, although believed to be reliable, has not been independently verified and its accuracy or completeness cannot be guaranteed. No representation is made with respect to the accuracy, completeness or timeliness of this information. Nothing provided on this site constitutes tax advice. Individuals should seek the advice of their own tax advisor for specific information regarding tax consequences of investments. Investments in securities entail risk and are not suitable for all investors. This site is not a recommendation nor an offer to sell (or solicitation of an offer to buy) securities in the United States or in any other jurisdiction.
References to indexes and benchmarks are hypothetical illustrations of aggregate returns and do not reflect the performance of any actual investment. Investors cannot invest in an index and do not reflect the deduction of the advisor’s fees or other trading expenses. There can be no assurance that current investments will be profitable. Actual realized returns will depend on, among other factors, the value of assets and market conditions at the time of disposition, any related transaction costs, and the timing of the purchase. Indexes and benchmarks may not directly correlate or only partially relate to portfolios managed by SL Advisors as they have different underlying investments and may use different strategies or have different objectives than portfolios managed by SL Advisors (e.g. The Alerian index is a group MLP securities in the oil and gas industries. Portfolios may not include the same investments that are included in the Alerian Index. The S & P Index does not directly relate to investment strategies managed by SL Advisers.)
This site may contain forward-looking statements relating to the objectives, opportunities, and the future performance of the U.S. market generally. Forward-looking statements may be identified by the use of such words as; “believe,” “expect,” “anticipate,” “should,” “planned,” “estimated,” “potential” and other similar terms. Examples of forward-looking statements include, but are not limited to, estimates with respect to financial condition, results of operations, and success or lack of success of any particular investment strategy. All are subject to various factors, including, but not limited to general and local economic conditions, changing levels of competition within certain industries and markets, changes in interest rates, changes in legislation or regulation, and other economic, competitive, governmental, regulatory and technological factors affecting a portfolio’s operations that could cause actual results to differ materially from projected results. Such statements are forward-looking in nature and involves a number of known and unknown risks, uncertainties and other factors, and accordingly, actual results may differ materially from those reflected or contemplated in such forward-looking statements. Prospective investors are cautioned not to place undue reliance on any forward-looking statements or examples. None of SL Advisors LLC or any of its affiliates or principals nor any other individual or entity assumes any obligation to update any forward-looking statements as a result of new information, subsequent events or any other circumstances. All statements made herein speak only as of the date that they were made. r
Certain hyperlinks or referenced websites on the Site, if any, are for your convenience and forward you to third parties’ websites, which generally are recognized by their top level domain name. Any descriptions of, references to, or links to other products, publications or services does not constitute an endorsement, authorization, sponsorship by or affiliation with SL Advisors LLC with respect to any linked site or its sponsor, unless expressly stated by SL Advisors LLC. Any such information, products or sites have not necessarily been reviewed by SL Advisors LLC and are provided or maintained by third parties over whom SL Advisors LLC exercise no control. SL Advisors LLC expressly disclaim any responsibility for the content, the accuracy of the information, and/or quality of products or services provided by or advertised on these third-party sites.
All investment strategies have the potential for profit or loss. Different types of investments involve varying degrees of risk, and there can be no assurance that any specific investment will be suitable or profitable for a client’s investment portfolio.
Past performance of the American Energy Independence Index is not indicative of future returns.
Leave a Reply
Want to join the discussion?Feel free to contribute!