The Slow Shift in Power
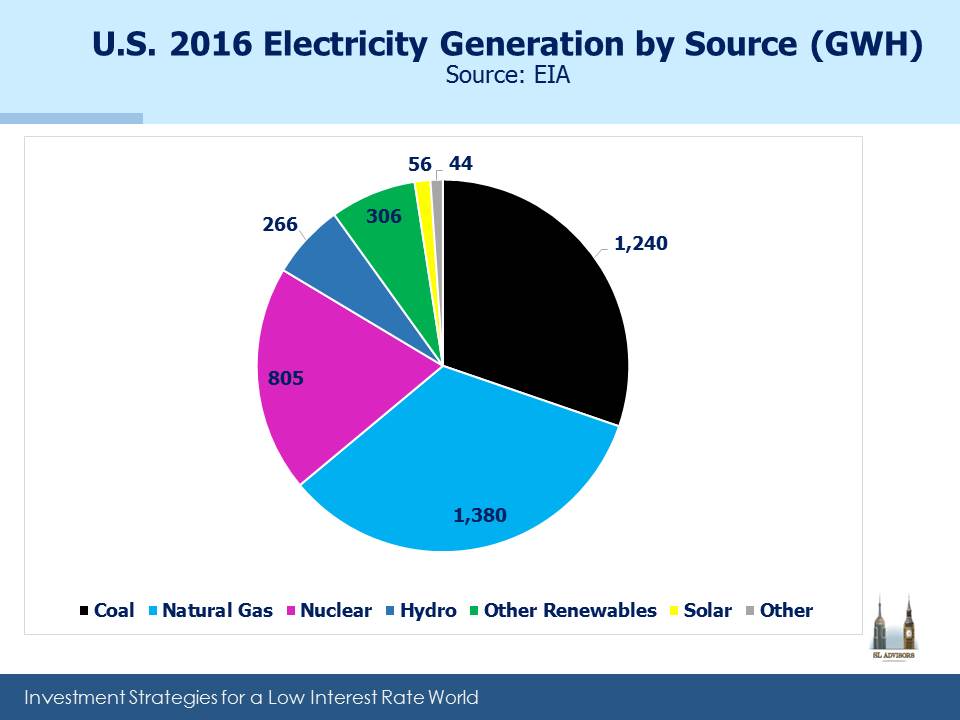
The U.S. produces electricity from diverse sources; burning coal and natural gas each provide just under a third of our needs (natural gas is steadily displacing coal, which is good for those MLPs that transport, process and store natural gas). Nuclear is 19%, with the rest being other renewables of which hydro is the biggest. Solar from all sources (which includes both utility scale production as well as rooftop panels that supply back to the grid) is currently 1.4%. In 2016 we used around 4,100 TWH (Terrawatt Hours).
To explain the dizzying numbers: One Terrawatt (TW) is 1,000 Gigawatts (GW). One Gigawatt is 1,000 Megawatts (MW). Capacity is measured by output capability, while use is measured by quantity consumed per hour. So a 100MW power plant could supply 100MWH if it ran at 100% capacity for sixty minutes.
For those who forecast big shifts in how the U.S. generates electricity, year-to-year change is disappointingly slow. This is because the net additions to electricity generating capacity each year are only a small fraction of total capacity.
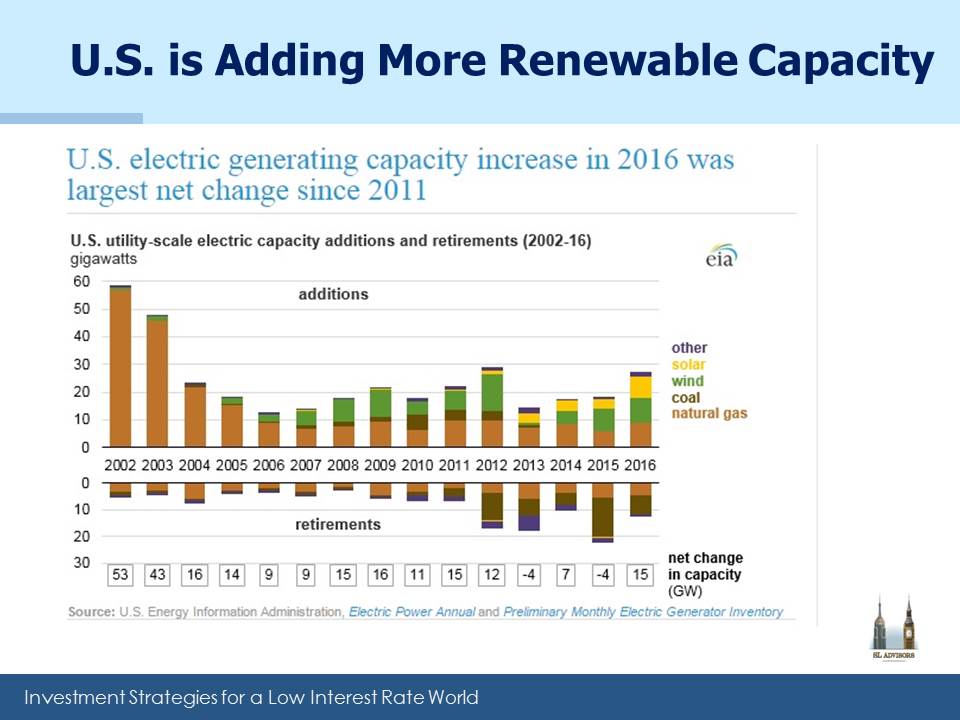
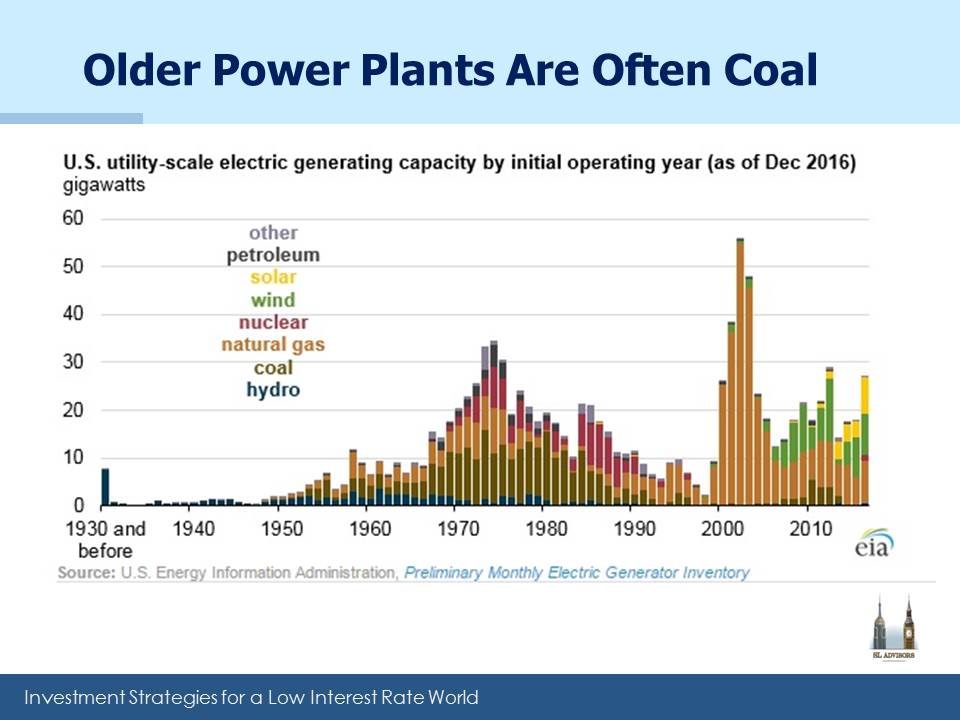
Last year we added 15 GW of net new generating capacity, the biggest in five years including a decent jump in wind and solar. Also notable was the ongoing retirement of coal plants. As the third chart shows, this is likely to continue because older power plants are more likely to be coal-burning. The challenge with wind and solar is that it’s not always windy and sunny, and since commercially viable, large scale storage is still ahead of us, utilization is lower for these categories than others.
To illustrate how slowly the existing electricity generation capacity changes, consider these figures: total generation capacity is 1.1 TW, or 1,100 GW. Very approximately, 1.1TW of capacity could theoretically produce 9,600 TWH in a year if everything ran at 100% (i.e. 1.1 X 365 days X 24 hours in a day is 9,636). So our consumption means we used 42% of this theoretical capacity. Since power needs fluctuate depending on the time of days as well as the seasons, and facilities need to be shut down for periodic maintenance, the industry is more efficient than this sounds.
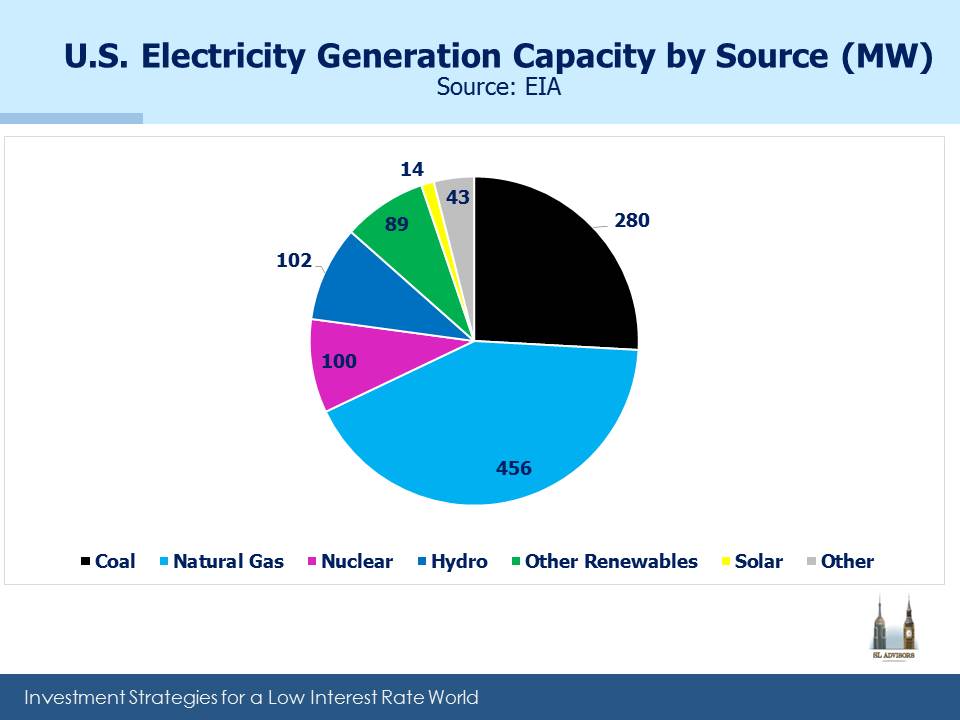
But it puts the 15GW of new capacity in perspective since it represents around 1.5% of the installed base. Even this overstates its impact because of the lower utilization rates of wind and solar.
Change is surely coming to how we source our power. Future generations will almost certainly rely far more heavily on solar. But over the next decade or so, change will appear slow.