Rising Rates and MLPs: Not What You Think
Five years ago my book Bonds Are Not Forever; The Crisis Facing Fixed Income Investors argued that interest rates were likely to stay lower for longer. Excessive debt led to the 2008 Financial Crisis, and our thinking was that low rates were part of the necessary healing process, allowing the burden of debt to be managed down.
Rates have indeed remained low, helped by the Federal Reserve’s very measured steps to “normalize” the Federal Funds rate with periodic hikes. Most forecasters, including the rate-setting members of the Federal Open Market Committee, have consistently expected rates to rise faster than they have.
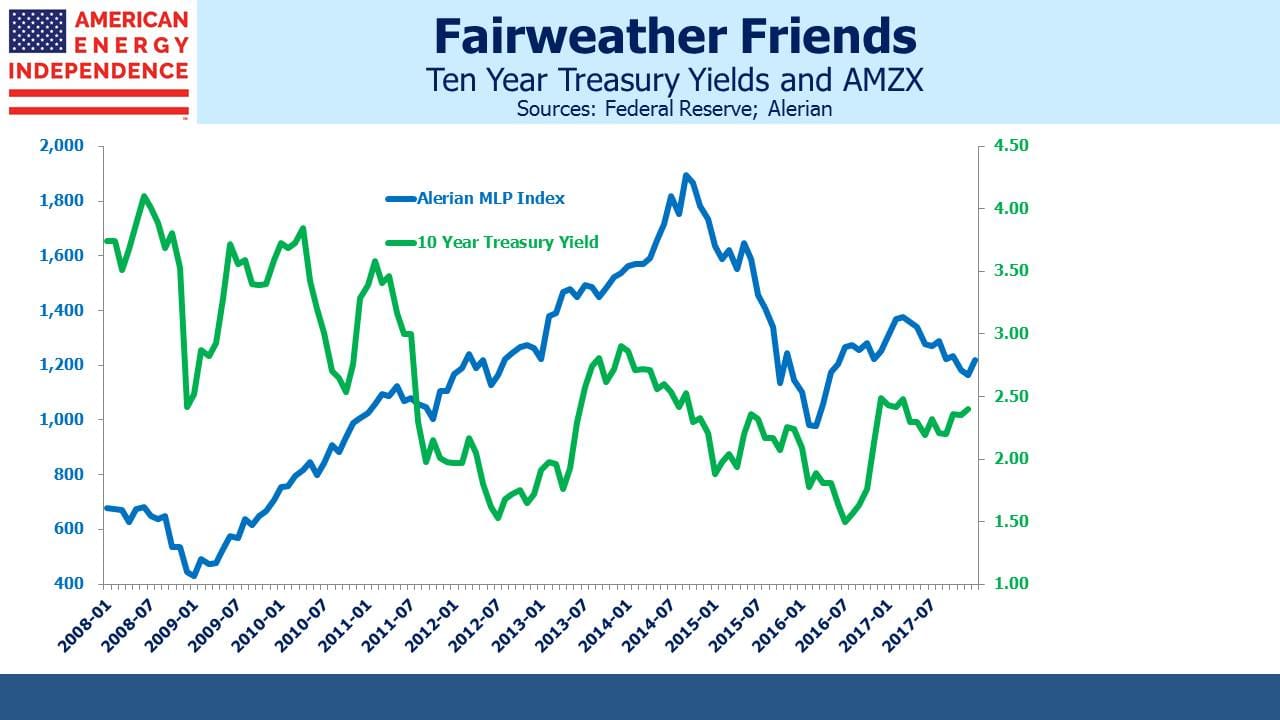
Nonetheless, ten year treasury yields have been drifting up and recently touched 2.6%. Unemployment remains very low if not yet inflationary. GDP growth and corporate profits are strong. The recent tax changes are fiscally stimulative. Bill Gross has declared that we’re in a bond bear market, and Jeffrey Gundlach sounds equally cautious. It’s likely that this will be an increasing topic of conversation among investors.
We have no view on the near-term direction of bond yields, beyond noting that current yields are too paltry to justify an investment. It’s been a long time since bonds looked attractive. As we noted in our 2017 Year-end Review and Outlook, interest rates are what make stocks attractive. The Equity Risk Premium (S&P500 earnings yield minus the yield on ten year treasury notes) favors stocks, but if rates rose 2% bonds would offer meaningful competition. Although a 4-4.5% ten year treasury yield is a long way off, the historic real return (i.e. yield minus inflation) going back to 1928 is 1.9%. So 2% above an inflation rate of 2% that’s rising wouldn’t be historically out of line.
Energy infrastructure investors will begin considering how rising rates might affect the sector. Traditionally, MLPs were categorized as an income-generating asset class along with REITs and Utilities. Rising bond yields have in the past represented a headwind for all these sectors, although MLP cashflows are not that sensitive to rate movements. Debt is predominantly fixed rate, and certain elements of the business, such as pipelines that cross state lines, operate under highly regulated tariffs which include annual inflation-linked increases.
But energy infrastructure has undergone substantial changes over the past three years. Although yields are historically attractive, the volatility of 2015-16 was inconsistent with the stable, income-generating asset class investors had sought. As we’ve noted before (see The Changing MLP Investor), the Shale Revolution created growth opportunities that upset the business model and led many MLPs to “simplify,” their structure, which in practice meant they cut distributions in order to finance new investments. Consequently, the path of U.S. hydrocarbon production growth is more important than in the past.
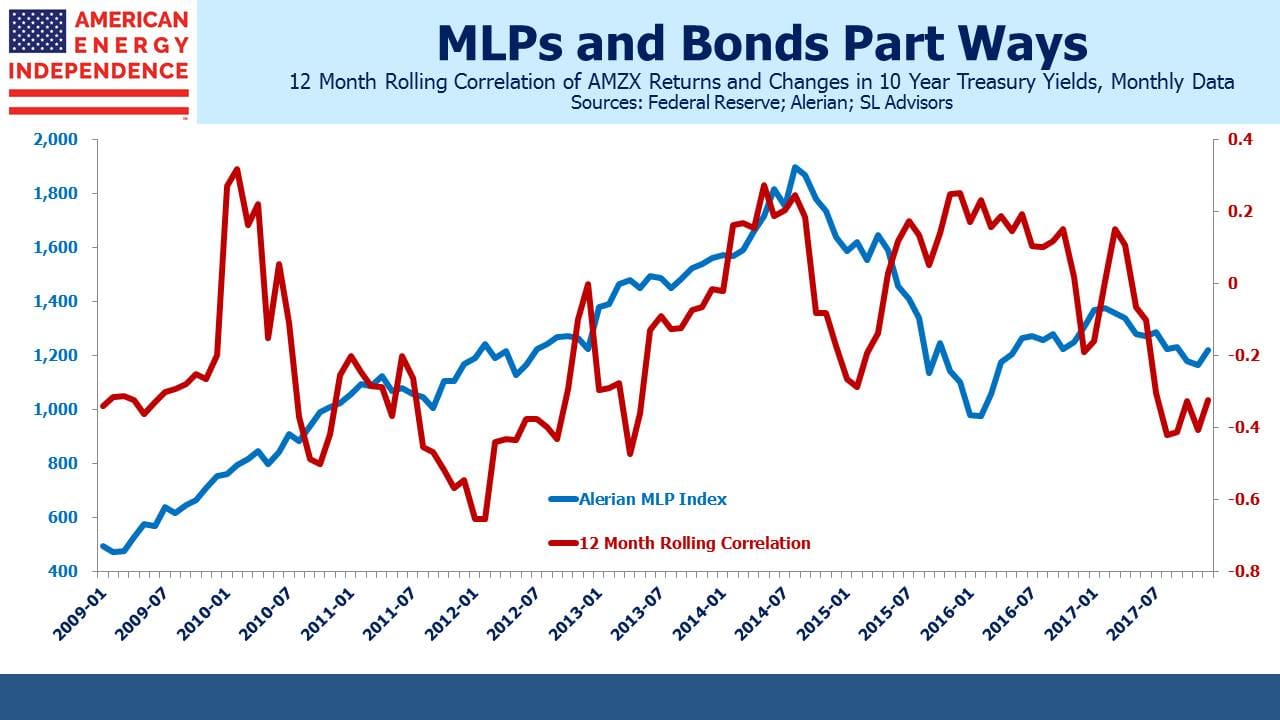
The long term relationship between MLPs and treasury yields is not a stable one. The correlation between rate changes and MLP returns has fluctuated over the years, reflecting that there’s a weak economic connection between the two. Initial moves up in rates have often led to short term weakness in energy infrastructure, probably due to competing fund flows as noted above with REITs and Utilities. However, recent bond market weakness has led to the opposite result. The correlation is becoming negative.
This is likely because the strengthening economy, which is driving up rates, is improving the outlook for the energy sector as well. Energy infrastructure is more sensitive to volume growth, since this increases capacity utilization of existing facilities as well as the likelihood of further growth. A stronger economy will, at the margin, consume more energy. The 12 month rolling correlation (through December 2017) is the most negative it’s been since the sector peaked in August 2014. In January this relationship has persisted, with rates and MLPs both moving higher. So far, the economic forces that are causing weaker bond prices have been positive for energy infrastructure.
The investable American Energy Independence Index (AEITR) finished the week +1.9%. Since the November 29th low in the sector, the AEITR has rebounded 13.9%.
Important Disclosures
The information provided is for informational purposes only and investors should determine for themselves whether a particular service, security or product is suitable for their investment needs. The information contained herein is not complete, may not be current, is subject to change, and is subject to, and qualified in its entirety by, the more complete disclosures, risk factors and other terms that are contained in the disclosure, prospectus, and offering. Certain information herein has been obtained from third party sources and, although believed to be reliable, has not been independently verified and its accuracy or completeness cannot be guaranteed. No representation is made with respect to the accuracy, completeness or timeliness of this information. Nothing provided on this site constitutes tax advice. Individuals should seek the advice of their own tax advisor for specific information regarding tax consequences of investments. Investments in securities entail risk and are not suitable for all investors. This site is not a recommendation nor an offer to sell (or solicitation of an offer to buy) securities in the United States or in any other jurisdiction.
References to indexes and benchmarks are hypothetical illustrations of aggregate returns and do not reflect the performance of any actual investment. Investors cannot invest in an index and do not reflect the deduction of the advisor’s fees or other trading expenses. There can be no assurance that current investments will be profitable. Actual realized returns will depend on, among other factors, the value of assets and market conditions at the time of disposition, any related transaction costs, and the timing of the purchase. Indexes and benchmarks may not directly correlate or only partially relate to portfolios managed by SL Advisors as they have different underlying investments and may use different strategies or have different objectives than portfolios managed by SL Advisors (e.g. The Alerian index is a group MLP securities in the oil and gas industries. Portfolios may not include the same investments that are included in the Alerian Index. The S & P Index does not directly relate to investment strategies managed by SL Advisers.)
This site may contain forward-looking statements relating to the objectives, opportunities, and the future performance of the U.S. market generally. Forward-looking statements may be identified by the use of such words as; “believe,” “expect,” “anticipate,” “should,” “planned,” “estimated,” “potential” and other similar terms. Examples of forward-looking statements include, but are not limited to, estimates with respect to financial condition, results of operations, and success or lack of success of any particular investment strategy. All are subject to various factors, including, but not limited to general and local economic conditions, changing levels of competition within certain industries and markets, changes in interest rates, changes in legislation or regulation, and other economic, competitive, governmental, regulatory and technological factors affecting a portfolio’s operations that could cause actual results to differ materially from projected results. Such statements are forward-looking in nature and involves a number of known and unknown risks, uncertainties and other factors, and accordingly, actual results may differ materially from those reflected or contemplated in such forward-looking statements. Prospective investors are cautioned not to place undue reliance on any forward-looking statements or examples. None of SL Advisors LLC or any of its affiliates or principals nor any other individual or entity assumes any obligation to update any forward-looking statements as a result of new information, subsequent events or any other circumstances. All statements made herein speak only as of the date that they were made. r
Certain hyperlinks or referenced websites on the Site, if any, are for your convenience and forward you to third parties’ websites, which generally are recognized by their top level domain name. Any descriptions of, references to, or links to other products, publications or services does not constitute an endorsement, authorization, sponsorship by or affiliation with SL Advisors LLC with respect to any linked site or its sponsor, unless expressly stated by SL Advisors LLC. Any such information, products or sites have not necessarily been reviewed by SL Advisors LLC and are provided or maintained by third parties over whom SL Advisors LLC exercise no control. SL Advisors LLC expressly disclaim any responsibility for the content, the accuracy of the information, and/or quality of products or services provided by or advertised on these third-party sites.
All investment strategies have the potential for profit or loss. Different types of investments involve varying degrees of risk, and there can be no assurance that any specific investment will be suitable or profitable for a client’s investment portfolio.
Past performance of the American Energy Independence Index is not indicative of future returns.


The real issue with MLPs and interest is not correlation. It is the tax deductibility under the formula for the 30% cap in the new tax law. For three years it’s based on EBITDA and thereafter it’s based on net income after depreciation and amortization. To the extent interest isn’t deductible that may be compensated by the immediate expensing of capital assets, but that ends in 5 years.