Pipelines Still Linked With Inflation
The link with crude oil is a familiar topic for investors in pipelines, who have often been told that the two are uncorrelated only to experience both inconveniently plunging together.
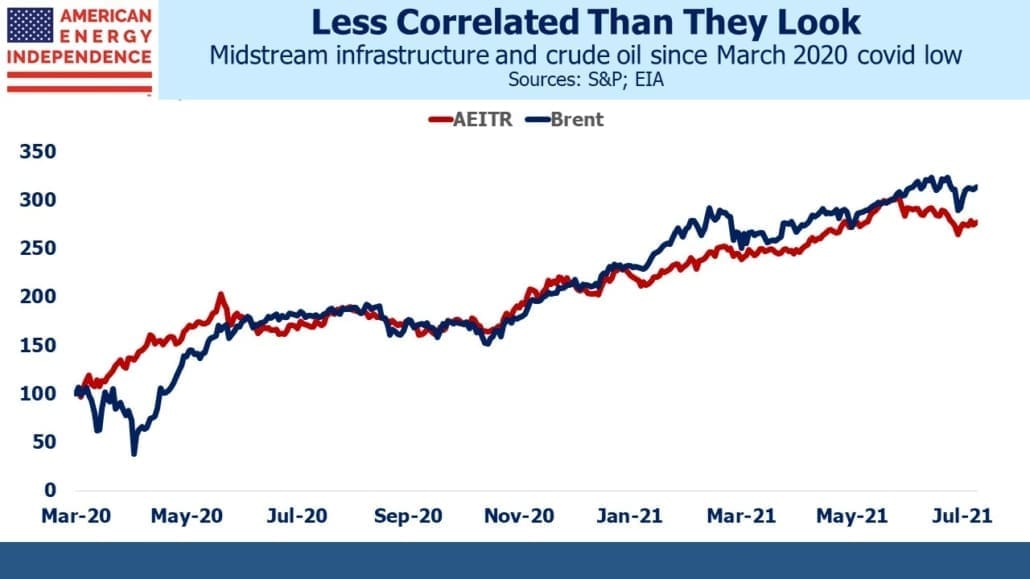
Since the Covid bottom in March, crude oil and midstream energy infrastructure have conveniently tracked each other higher – until the last several weeks during which the sector has slid while crude oil has held its gains. Visually, the last 16 months looks as if the two are closely linked. But the correlation of daily returns over that period is surprisingly low at only 0.28.
Episodes such as April 2020, when the two diverged sharply as crude went briefly negative, have an outsized impact on this statistic. As we’ve also noted, 2020 operating performance for most big pipeline companies came in within a few % of pre-Covid operating performance. It remains the case that stock prices move far more with oil than cash flows.
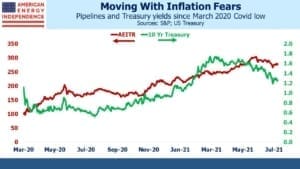
One reason for the relative weakness in midstream recently has been the drop in bond yields. The rise in inflation expectations increased interest in businesses with pricing power, and many pipelines have agreements that link price hikes to PPI. The ability to increase prices with inflation used to be an attractive feature years ago when MLPs were bought for their stable yields.
The volatility ushered in by the Shale Revolution took focus elsewhere, but this feature of contracts has remained and will likely become more important in the years ahead. In research last month (see Market Underprices Rate Hike Risks), Wells Fargo calculated that 60% of midstream EBITDA was exposed to inflation escalators, and with a 5.5% 2021 PPI estimate they calculated a 3% lift to sector EBITDA.
The recent moderation in inflation fears reflected in lower bond yields has similarly depressed the pipeline sector. This is likely to be temporary. As we noted last week, Fed bond buying took up almost all available net new supply in July (see Behind The Fed’s Benign Inflation Outlook). Inflation concerns are everywhere, with both fiscal and monetary policy being managed without regard to rising prices. The government will get what it wants, and the coincident drop in bond yields and pipelines serves to confirm the latter’s use as protection against inflation.
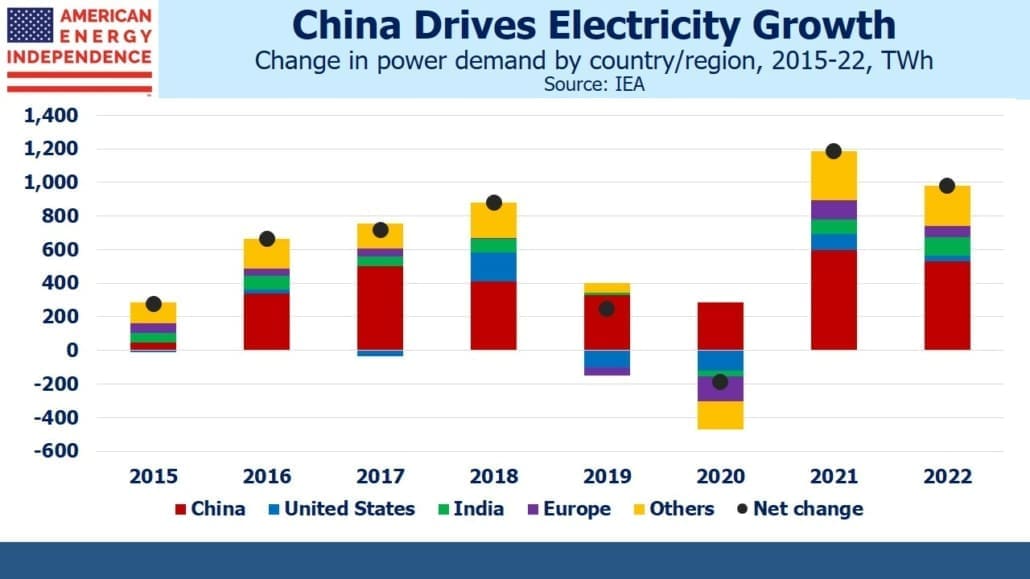
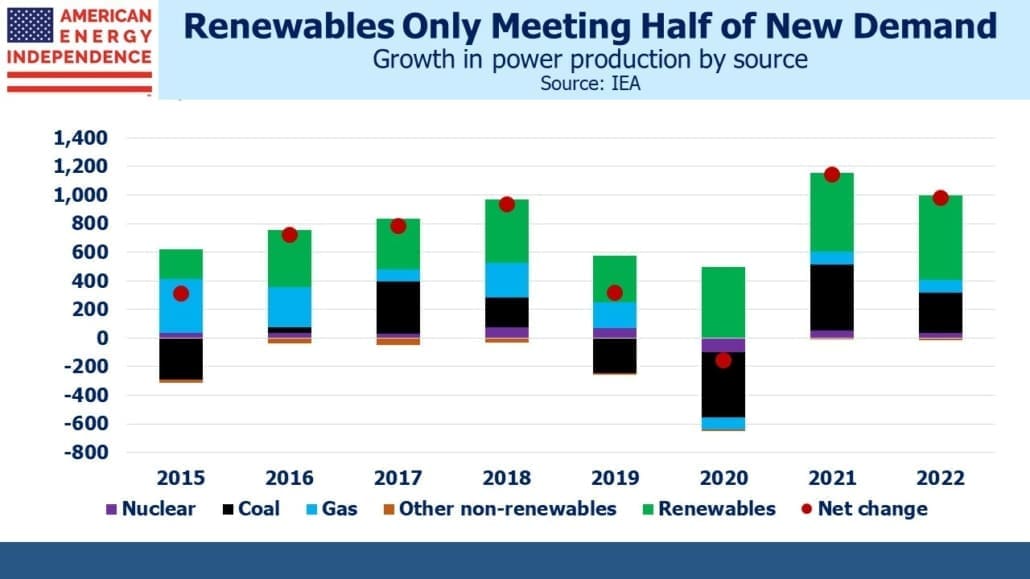
On a different topic, the International Energy Agency (IEA) recently issued a report on global electricity demand growth. It’s easy to conclude that renewables will soon be providing the majority of our power based on today’s popular press. The IEA noted that global electricity demand is increasing faster than renewables-supplied power. Since the power sector is renewables’ most important target, inability to even match demand growth reveals how unrealistic it is to think windmills and solar panels are going to fully solve the problem of climate change.
Moreover, because the growth in global electricity demand is centered in emerging Asia where coal use is high, this dirtiest form of energy is benefitting from strong demand. China represents half the worlds’s growth in power demand. Even last year they saw healthy growth, contrasting with widespread reductions due to Covid.
40% of this year’s growth in electricity demand will be provided by coal. China’s refusal to agree to a G20 communique phasing out coal is easily understood when considered alongside these figures from the IEA.
Even though coal continues to retain its outsized share of world electricity production, the opportunity for natural gas to offer a meaningful alternative remains immense.
Tellurian CEO Charif Souki mentioned this in a recent video. Confirming the positive long term outlook for natural gas, Shell became the third company to sign up with Tellurian to purchase 3 million tons per annum of natural gas.
The American Energy Independence Index (AEITR) includes North America’s biggest pipeline companies. We believe the sector offers solid inflation protection as well as continued upside from growing global demand for US natural gas.
We are invested in all the components of the American Energy Independence Index via the ETF that seeks to track its performance.
We have three funds that seek to profit from this environment:
Important Disclosures
The information provided is for informational purposes only and investors should determine for themselves whether a particular service, security or product is suitable for their investment needs. The information contained herein is not complete, may not be current, is subject to change, and is subject to, and qualified in its entirety by, the more complete disclosures, risk factors and other terms that are contained in the disclosure, prospectus, and offering. Certain information herein has been obtained from third party sources and, although believed to be reliable, has not been independently verified and its accuracy or completeness cannot be guaranteed. No representation is made with respect to the accuracy, completeness or timeliness of this information. Nothing provided on this site constitutes tax advice. Individuals should seek the advice of their own tax advisor for specific information regarding tax consequences of investments. Investments in securities entail risk and are not suitable for all investors. This site is not a recommendation nor an offer to sell (or solicitation of an offer to buy) securities in the United States or in any other jurisdiction.
References to indexes and benchmarks are hypothetical illustrations of aggregate returns and do not reflect the performance of any actual investment. Investors cannot invest in an index and do not reflect the deduction of the advisor’s fees or other trading expenses. There can be no assurance that current investments will be profitable. Actual realized returns will depend on, among other factors, the value of assets and market conditions at the time of disposition, any related transaction costs, and the timing of the purchase. Indexes and benchmarks may not directly correlate or only partially relate to portfolios managed by SL Advisors as they have different underlying investments and may use different strategies or have different objectives than portfolios managed by SL Advisors (e.g. The Alerian index is a group MLP securities in the oil and gas industries. Portfolios may not include the same investments that are included in the Alerian Index. The S & P Index does not directly relate to investment strategies managed by SL Advisers.)
This site may contain forward-looking statements relating to the objectives, opportunities, and the future performance of the U.S. market generally. Forward-looking statements may be identified by the use of such words as; “believe,” “expect,” “anticipate,” “should,” “planned,” “estimated,” “potential” and other similar terms. Examples of forward-looking statements include, but are not limited to, estimates with respect to financial condition, results of operations, and success or lack of success of any particular investment strategy. All are subject to various factors, including, but not limited to general and local economic conditions, changing levels of competition within certain industries and markets, changes in interest rates, changes in legislation or regulation, and other economic, competitive, governmental, regulatory and technological factors affecting a portfolio’s operations that could cause actual results to differ materially from projected results. Such statements are forward-looking in nature and involves a number of known and unknown risks, uncertainties and other factors, and accordingly, actual results may differ materially from those reflected or contemplated in such forward-looking statements. Prospective investors are cautioned not to place undue reliance on any forward-looking statements or examples. None of SL Advisors LLC or any of its affiliates or principals nor any other individual or entity assumes any obligation to update any forward-looking statements as a result of new information, subsequent events or any other circumstances. All statements made herein speak only as of the date that they were made. r
Certain hyperlinks or referenced websites on the Site, if any, are for your convenience and forward you to third parties’ websites, which generally are recognized by their top level domain name. Any descriptions of, references to, or links to other products, publications or services does not constitute an endorsement, authorization, sponsorship by or affiliation with SL Advisors LLC with respect to any linked site or its sponsor, unless expressly stated by SL Advisors LLC. Any such information, products or sites have not necessarily been reviewed by SL Advisors LLC and are provided or maintained by third parties over whom SL Advisors LLC exercise no control. SL Advisors LLC expressly disclaim any responsibility for the content, the accuracy of the information, and/or quality of products or services provided by or advertised on these third-party sites.
All investment strategies have the potential for profit or loss. Different types of investments involve varying degrees of risk, and there can be no assurance that any specific investment will be suitable or profitable for a client’s investment portfolio.
Past performance of the American Energy Independence Index is not indicative of future returns.


It is also irrational for the equities of midstream energy infrastructure companies (partnerships and corporations) with three quarters or more of their revenues, gross operating margins and EBITDA based on natural gas, NGLs, LNG, LPG and petrochemicals, to trade correlative with crude oil futures, yet this frequently occurs. Trading algorithms don’t do much by way of reasoning.