Natural Gas Liquids — the Lesser Known Side of the Shale Revolution
Many people think of fossil fuels as coal, crude oil and natural gas, with the nastiness of their toxic emissions lying in that order. Among the less colorful comments during the second Presidential debate was Hillary Clinton’s reference to natural gas as a “bridge” fuel, sitting between today’s reliance on hydrocarbons and a future of renewables (solar, wind and so on). Methane (or, to use its Chemical symbols, CH4 since it combines four hydrogen atoms with one Carbon atom), is colloquially known as natural gas, and is the simplest and cleanest burning fuel. It is helping the U.S. limit its carbon footprint since as the Shale Revolution has made it plentiful domestically, it’s replacing far dirtier coal as the fuel of choice for power plants.
Natural Gas Liquids (NGLs) are a set of hydrocarbons that lie between Methane (also called “Dry” Gas”) and the lightest blends of crude oil (such as Naphtha). Methane is often extracted mixed with NGLs and crude oil. It’s used for residential gas stoves and heating, electricity generation and, when chilled to -260F turns to Liquid Natural Gas (LNG) in which form it can be transported by ship. The mix of NGLs and oil found in a well with methane affects the value of the play since after being separated from the dry gas the NGLs can be put to other purposes. “Wet” gas wells that contain more NGLs often generate more attractive returns as NGLs fetch higher prices.
The energy infrastructure business provides the ability to gather and process the mix of hydrocarbons into Gas, NGLs and Crude Oil. Dry gas then is piped to customers, crude oil heads to storage & refiners, and NGLs are sent to fractionation plants. By exploiting their different boiling points the NGLs are then separated into into their components: Ethane (C2H6), Propane (C3H8), Butane(C4H10), Iso-Butane (C4H10 with tertiary carbon), and natural gasoline (C5+). Although NGLs are gases, their production is usually expressed in barrels a day, like oil. The conversion is based on energy equivalence, so a barrel of an NGL has the same energy output measured in BTUs (British Thermal Units) as a barrel of oil. Nothing gets moved in barrels anymore, but the industry has retained it as a common measure of volume.
Although often ignored, NGLs are significant. The U.S currently produces 3.6MMBD (Millions of Barrels a Day) of NGLs. Compare this with U.S shale oil production of 4.5MMBD and it’s a big business in its own right.
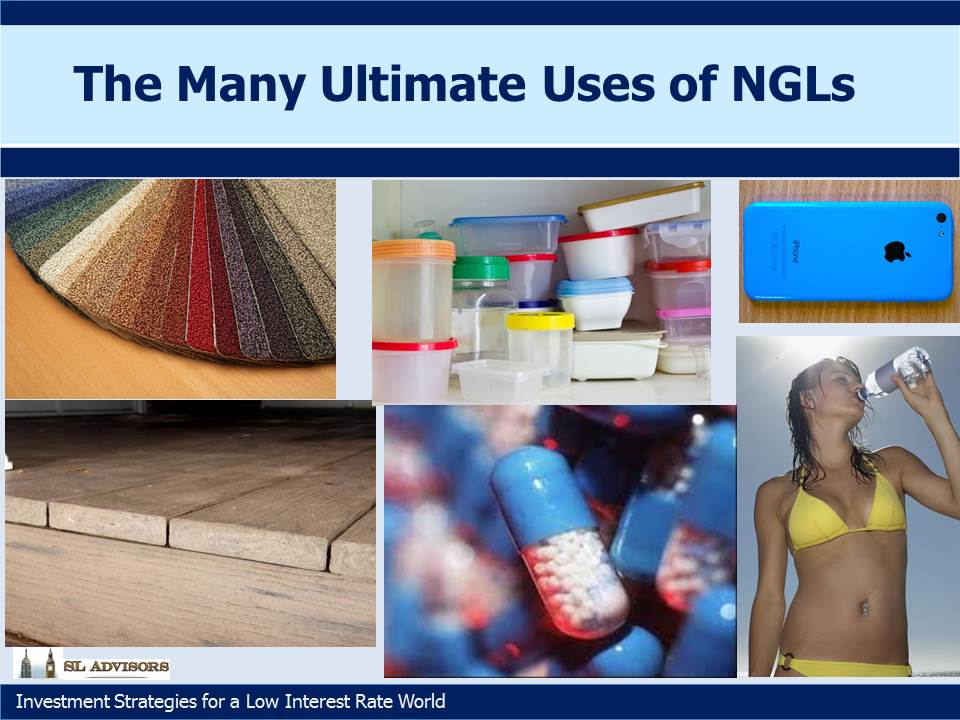
Ethane is most readily found with methane, although it’s also a by-product of refining crude oil. Some portion of ethane can be left in the gas stream for residential and commercial use if its price doesn’t justify separating it out. However, by far its most important use is as a feedstock for petrochemical plants to produce polyethylene, the most commonly created organic compound in the world. It winds up as plastics in various forms with thousands of ultimate uses across consumer products as packaging, containers, plastic bags carpeting and clothing (including swimwear). As the U.S. steps up its production of ethane, the low price caused by America’s shift towards energy independence is leading to a substantial cost advantage in polyethylene production. Currently the U.S produces 1.3MMBD of ethane.
Credit for the first industrial synthesis of polyethylene generally goes to Imperial Chemical Industries (ICI) in the UK in 1933.
Propane exists as a gas at temperatures above -44F, but turns to a liquid under pressure when it occupies 1/270th of the space, allowing it to be stored in propane tanks and bottles (such as the one under your gas grill outside). It has many other uses as a fuel from heating homes (particularly mobile homes which often lack a permanent connection to the local gas supply) to drying crops. The U.S produces 1.15MMBD of Propane. Butane is the fuel in pocket lighters, the propellant in aerosols, and is blended with gasoline during the summer to reduce pollution (it’s the vapors that come out while you’re pumping). Iso-butane is primarily used to increase the octane in gasoline while making it cleaner burning. The U.S produces 300MMBD each of butane and i-butane.
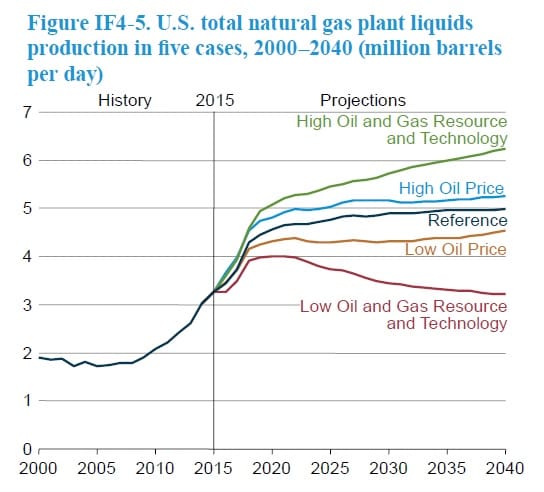
The chart below shows forecast growth in NGLs (referred to as “Natural Gas Plant Liquids”) provided by the U.S. Energy Information Administration (EIA) in their 2016 Annual Energy Outlook.
The first point of this brief summary on NGLs is to illustrate that the composition and uses of the hydrocarbons we produce vary enormously. Master Limited Partnerships (MLPs) own and operate the pipelines, storage assets and processing facilities that handle this output, which includes providing treatment and separation of methane from the NGLs with which it’s found. They process the mixed NGLs into their individual components, providing storage and then transportation of the pure products to their end users.
The second point is that, just as natural gas and crude oil production look set to continue growing in the U.S., so does NGL output. Their increasing use is another side to the story of energy independence. Moreover, exports are increasingly driving this growth; as recently as 2014 the U.S. was a net importer of ethane, and marine exports were not considered economically viable.
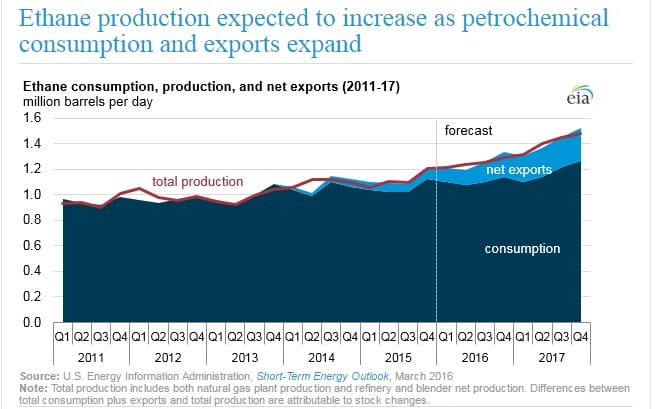
According to the EIA, U.S. production of ethane and propane have substantially exceeded demand in recent years. This has led to ethane at times being “rejected,” meaning some portion of it is left with the methane in the natural gas supply rather than being separated out. But the growing supply of ethane has also has led to significant investments in petrochemical plants and export capacity.
Ethane exports were non-existent before 2014 when two pipelines came online to ship it to petrochemical complexes in Canada. Pembina’s (PBA) Vantage pipeline recently added 70KBD (Thousands of Barrels a Day) of capacity from North Dakota, and Sunoco Logistics (SXL) moves 50KBD from their Mariner West line in southwestern Pennsylvania. In March of this year the first waterborne ethane left SXL’s Marcus Hook terminal on the Delaware River just south of Philadelphia, headed for Norway. Subsequent shipments for Norway have also left from Texas. Just as the U.S. is selling methane to the Middle East, a region not exactly short of it (see Coals to Newcastle), we’re able to sell to Norway even though they produce almost 4MMBD equivalent of crude oil, NGLs and natural gas.
In July, refrigerated ships began taking ethane from Enterprise Products Partners’ (EPD) 200KBD Morgan’s Point terminal, now the largest ethane export facility in the world, on the Houston Ship Channel. We are in the middle of the ramp-up now as ethane export capacity is expected to increase from 65KBD in 2015 to almost 400KBD by the end of next year. Additionally, Kinder Morgan’s (KMI) 50KBD pipeline from eastern Ohio is expected to come online early 2018. Adding in propane & butane docks, the U.S will have waterborne Liquid Petroleum Gas (LPG, NGLs when they’re condensed to liquid form for transport) capacity of 1.5MMBD by 2017. This includes 1.2MMBD on the gulf coast held by Targa Resources (TRGP), EPD, Phillips 66 (PSX), Occidental Petroleum (OXY), and SXL. There’s an additional 275KBD in the northeast being developed by Energy Transfer Partners (ETP) and SXL. In other words, there’s a lot of energy infrastructure being built that will increase MLP cashflows.
Domestic processing of ethane into ethylene has risen by almost a third in the last three years. Demand from ethylene producers for ethane feedstock is expected to soak up another 600KBD in the next five years, a more than 50% jump from today’s level. Propane can be converted into polypropylene, with similarly wide application in plastics to polyethylene although polypropylene is produced as a clear plastic whereas polyethylene is opaque, like a milk jug. Polypropylene production capacity has tripled since 2013 and is expected to consume another 135KBD of propane in the next five years. With all the new demand for NGLs, pipeline capacity is being expanded in multiple regions. Examples include Oneok Partners’ (OKS) Bakken NGL network; EPD’s Aegis system on the Gulf of Mexico and EPD’s ATEX line from the Northeast to the gulf; SXL’s Mariner East line.
New pipelines are being built, such as KMI’s Utica Marcellus Texas pipeline, and idle ones re-purposed, including a JV between EPD and Marathon Petroleum (MPC) called Centennial. Another example is NuStar’s (NS) Mont Belvieu line to Corpus Christi.
The picture of widespread investment in new midstream energy assets is clear enough. Last year’s sellers of MLPs gave no heed to the secular theme that is unfolding.
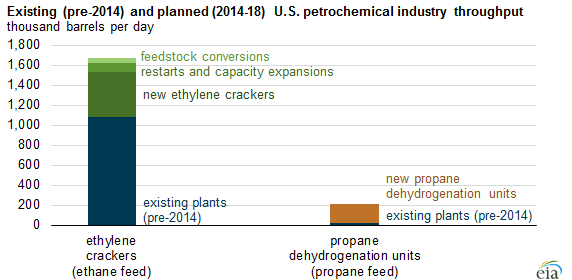
The chart below shows how the petrochemical industry is gearing up to process increasing volumes of ethan and propane into plastics.
Natural gas and crude oil for power generation tend to dominate the headlines about the Shale Revolution. But the associated production of NGLs and their use in wide-scale production of plastics represents a growing and increasingly important part of the economics of domestic hydrocarbon production. Fully utilizing this resource is another driver of demand for new energy infrastructure, another source of growth for MLPs. Unsurprisingly, we are invested in many of the names listed, often through their General Partner (GP) since that’s where the returns to growth are best realized. Of the names mentioned above, we are invested in the following:
EPD, Energy Transfer Equity (ETE, GP of ETP and SXL), KMI, NuStar GP Holdings (NSH, the GP of NS), Oneok (OKE, the GP of OKS), PBA, PSX (GP to PSXP) and TRGP.

Important Disclosures
The information provided is for informational purposes only and investors should determine for themselves whether a particular service, security or product is suitable for their investment needs. The information contained herein is not complete, may not be current, is subject to change, and is subject to, and qualified in its entirety by, the more complete disclosures, risk factors and other terms that are contained in the disclosure, prospectus, and offering. Certain information herein has been obtained from third party sources and, although believed to be reliable, has not been independently verified and its accuracy or completeness cannot be guaranteed. No representation is made with respect to the accuracy, completeness or timeliness of this information. Nothing provided on this site constitutes tax advice. Individuals should seek the advice of their own tax advisor for specific information regarding tax consequences of investments. Investments in securities entail risk and are not suitable for all investors. This site is not a recommendation nor an offer to sell (or solicitation of an offer to buy) securities in the United States or in any other jurisdiction.
References to indexes and benchmarks are hypothetical illustrations of aggregate returns and do not reflect the performance of any actual investment. Investors cannot invest in an index and do not reflect the deduction of the advisor’s fees or other trading expenses. There can be no assurance that current investments will be profitable. Actual realized returns will depend on, among other factors, the value of assets and market conditions at the time of disposition, any related transaction costs, and the timing of the purchase. Indexes and benchmarks may not directly correlate or only partially relate to portfolios managed by SL Advisors as they have different underlying investments and may use different strategies or have different objectives than portfolios managed by SL Advisors (e.g. The Alerian index is a group MLP securities in the oil and gas industries. Portfolios may not include the same investments that are included in the Alerian Index. The S & P Index does not directly relate to investment strategies managed by SL Advisers.)
This site may contain forward-looking statements relating to the objectives, opportunities, and the future performance of the U.S. market generally. Forward-looking statements may be identified by the use of such words as; “believe,” “expect,” “anticipate,” “should,” “planned,” “estimated,” “potential” and other similar terms. Examples of forward-looking statements include, but are not limited to, estimates with respect to financial condition, results of operations, and success or lack of success of any particular investment strategy. All are subject to various factors, including, but not limited to general and local economic conditions, changing levels of competition within certain industries and markets, changes in interest rates, changes in legislation or regulation, and other economic, competitive, governmental, regulatory and technological factors affecting a portfolio’s operations that could cause actual results to differ materially from projected results. Such statements are forward-looking in nature and involves a number of known and unknown risks, uncertainties and other factors, and accordingly, actual results may differ materially from those reflected or contemplated in such forward-looking statements. Prospective investors are cautioned not to place undue reliance on any forward-looking statements or examples. None of SL Advisors LLC or any of its affiliates or principals nor any other individual or entity assumes any obligation to update any forward-looking statements as a result of new information, subsequent events or any other circumstances. All statements made herein speak only as of the date that they were made. r
Certain hyperlinks or referenced websites on the Site, if any, are for your convenience and forward you to third parties’ websites, which generally are recognized by their top level domain name. Any descriptions of, references to, or links to other products, publications or services does not constitute an endorsement, authorization, sponsorship by or affiliation with SL Advisors LLC with respect to any linked site or its sponsor, unless expressly stated by SL Advisors LLC. Any such information, products or sites have not necessarily been reviewed by SL Advisors LLC and are provided or maintained by third parties over whom SL Advisors LLC exercise no control. SL Advisors LLC expressly disclaim any responsibility for the content, the accuracy of the information, and/or quality of products or services provided by or advertised on these third-party sites.
All investment strategies have the potential for profit or loss. Different types of investments involve varying degrees of risk, and there can be no assurance that any specific investment will be suitable or profitable for a client’s investment portfolio.
Past performance of the American Energy Independence Index is not indicative of future returns.
Leave a Reply
Want to join the discussion?Feel free to contribute!