Momentum Crash Supports Pipeline Sector
Breaking News — Drone attack disables Saudi crude ouput
Although we don’t normally highlight the favorable geopolitics of U.S. midstream energy infrastructure, this news does emphasize that much of the world’s crude oil comes from unstable regions. See WSJ story U.S. Insulated From Possible Supply Shock After Saudi Attack
Momentum Crash Supports Pipeline Sector
The action in equity markets last week was beneath the surface. Daily moves in the S&P500 were unremarkable, but a sharp turn in momentum stocks caused lots of churning.
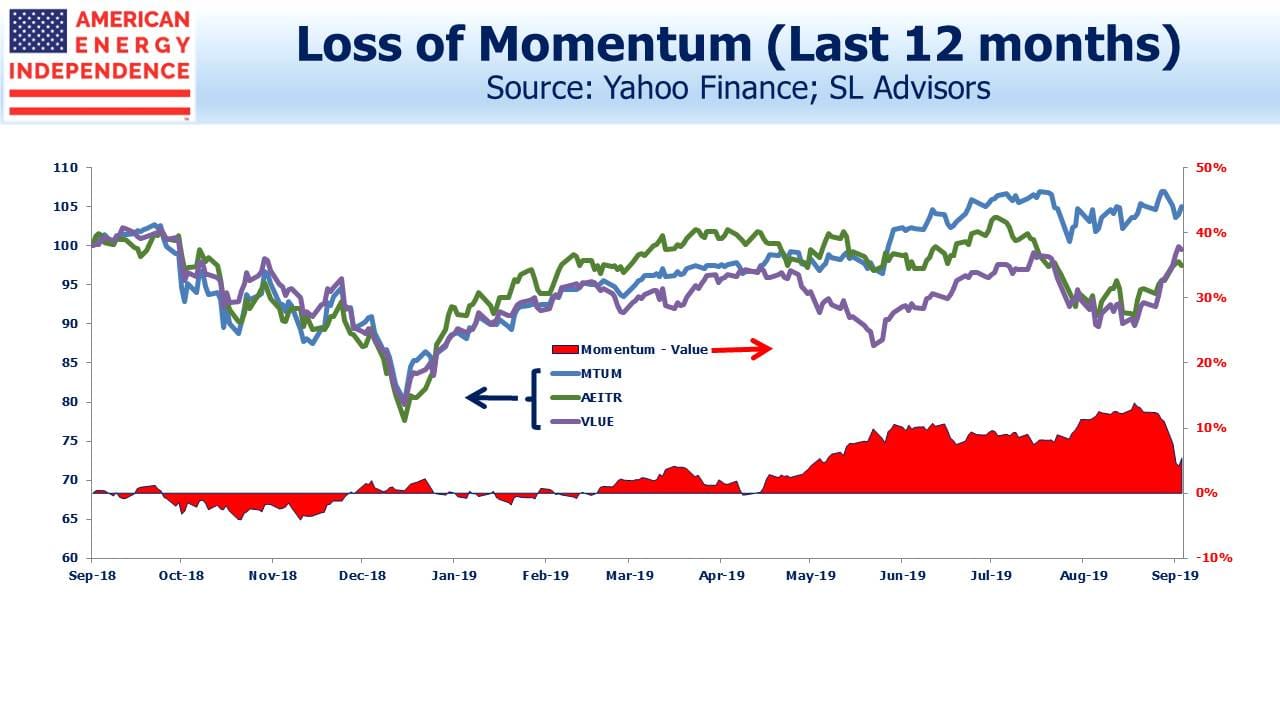
The resulting shift into value was welcome news for energy investors. Momentum and Value had tracked each other reasonably well for the past year until May, when Momentum began to outperform.
Eventually midstream energy infrastructure (defined as the American Energy Independence Index, AEITR), and Value both weakened during the summer. By late August, Momentum had opened up a 14% gap against Value over the prior five months, with similar outperformance against AEITR.
As portfolio managers in the pipeline sector we often struggle to explain the moves in the stocks we own. Apart from earnings season, macroeconomic developments and fund flows dominate. This past period was especially hard to understand because 2Q19 earnings reports were generally as expected.
In September this trend has reversed (see Drop in hot stocks stirs memories of ‘quant quake’), for reasons no clearer than those that preceded it. Value is 8% ahead of Momentum since Labor Day, lifting the AEITR with it.
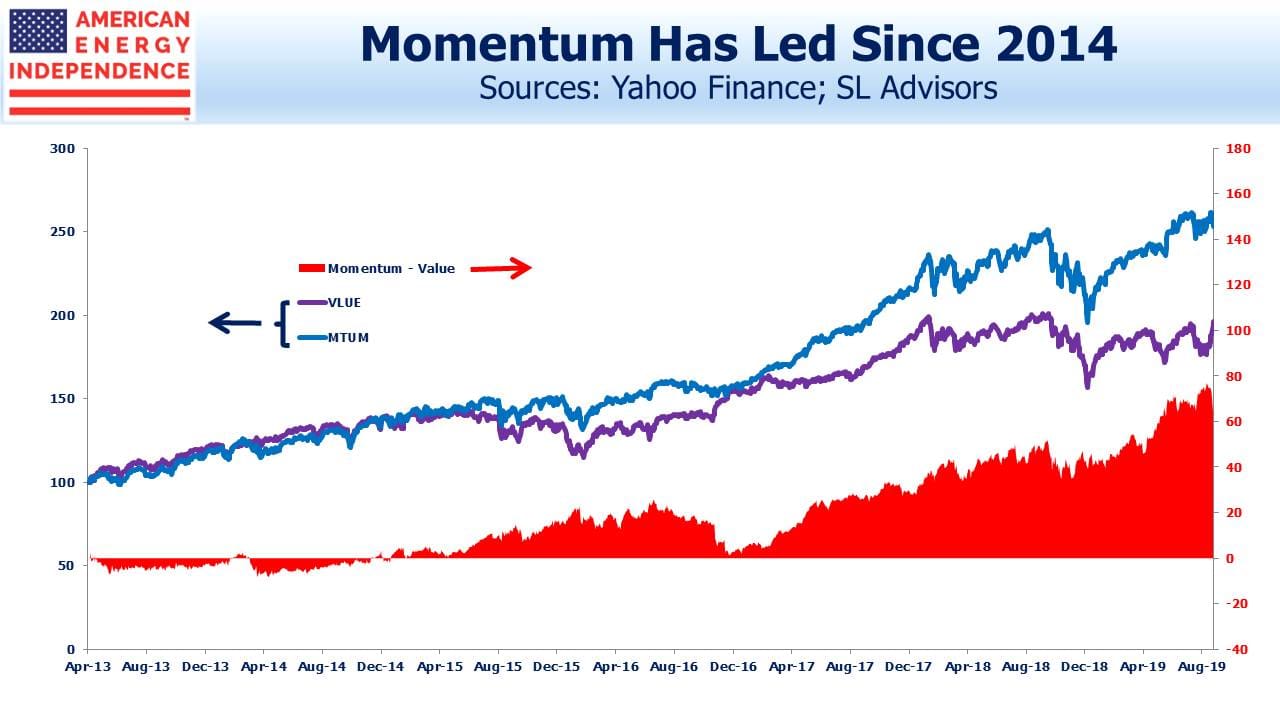
What’s behind this? Large pools of capital are deployed based on factor bets like Momentum and Value, relying on research that ascribes long term equity returns to them. Momentum has been outperforming Value for several years – since the peak in oil in 2014, which partly explains negative sentiment towards the energy sector since then.
During the summer, the difference in relative performance jumped sharply, leading to the recent correction. Perhaps slowing global growth has caused a reassessment of high fliers. It increasingly looks as if trade tariffs, which are simply import taxes, are spreading a chill across the world economy.
Momentum has slipped 9% against Value since August 29. This is an unusually fast correction. In 2016, Value outperformed Momentum by 10%. This lifted MLPs, with the Alerian MLP Index returning 18% that year.
If Value starts to regain favor, investors will find plenty of cheap stocks among midstream energy infrastructure.
Blackstone — Tallgrass
Two weeks ago Blackstone offered to acquire the 56% of Tallgrass Energy (TGE) it didn’t already own. The $19.50 per share price was below the $22.47 at which Blackstone had bought 44% earlier this year. But the sideletter allowing TGE management to sell at $26.25, regardless of the price received by other TGE shareholders, is unethical.
As we noted in Blackstone and Tallgrass Further Discredit the MLP Model, the deal exposed an ethical gulf between the prevailing standards at asset managers and the public companies we invest in. If we treated our investors the way TGE proposes to, our careers would be brief.
What’s surprising is the silence among other TGE investors as well as sell-side analysts. Few wish to risk upsetting either Blackstone or Tallgrass by pointing out the obvious. This failure to speak out is itself a disservice to clients.
Although there have been no further announcements since the proposal was made public, TGE’s stock has edged above the deal price. Some traders are betting that Blackstone will sweeten its offer. If that turns out to be the case, we’ll be happy to have helped.
We are invested in TGE
Important Disclosures
The information provided is for informational purposes only and investors should determine for themselves whether a particular service, security or product is suitable for their investment needs. The information contained herein is not complete, may not be current, is subject to change, and is subject to, and qualified in its entirety by, the more complete disclosures, risk factors and other terms that are contained in the disclosure, prospectus, and offering. Certain information herein has been obtained from third party sources and, although believed to be reliable, has not been independently verified and its accuracy or completeness cannot be guaranteed. No representation is made with respect to the accuracy, completeness or timeliness of this information. Nothing provided on this site constitutes tax advice. Individuals should seek the advice of their own tax advisor for specific information regarding tax consequences of investments. Investments in securities entail risk and are not suitable for all investors. This site is not a recommendation nor an offer to sell (or solicitation of an offer to buy) securities in the United States or in any other jurisdiction.
References to indexes and benchmarks are hypothetical illustrations of aggregate returns and do not reflect the performance of any actual investment. Investors cannot invest in an index and do not reflect the deduction of the advisor’s fees or other trading expenses. There can be no assurance that current investments will be profitable. Actual realized returns will depend on, among other factors, the value of assets and market conditions at the time of disposition, any related transaction costs, and the timing of the purchase. Indexes and benchmarks may not directly correlate or only partially relate to portfolios managed by SL Advisors as they have different underlying investments and may use different strategies or have different objectives than portfolios managed by SL Advisors (e.g. The Alerian index is a group MLP securities in the oil and gas industries. Portfolios may not include the same investments that are included in the Alerian Index. The S & P Index does not directly relate to investment strategies managed by SL Advisers.)
This site may contain forward-looking statements relating to the objectives, opportunities, and the future performance of the U.S. market generally. Forward-looking statements may be identified by the use of such words as; “believe,” “expect,” “anticipate,” “should,” “planned,” “estimated,” “potential” and other similar terms. Examples of forward-looking statements include, but are not limited to, estimates with respect to financial condition, results of operations, and success or lack of success of any particular investment strategy. All are subject to various factors, including, but not limited to general and local economic conditions, changing levels of competition within certain industries and markets, changes in interest rates, changes in legislation or regulation, and other economic, competitive, governmental, regulatory and technological factors affecting a portfolio’s operations that could cause actual results to differ materially from projected results. Such statements are forward-looking in nature and involves a number of known and unknown risks, uncertainties and other factors, and accordingly, actual results may differ materially from those reflected or contemplated in such forward-looking statements. Prospective investors are cautioned not to place undue reliance on any forward-looking statements or examples. None of SL Advisors LLC or any of its affiliates or principals nor any other individual or entity assumes any obligation to update any forward-looking statements as a result of new information, subsequent events or any other circumstances. All statements made herein speak only as of the date that they were made. r
Certain hyperlinks or referenced websites on the Site, if any, are for your convenience and forward you to third parties’ websites, which generally are recognized by their top level domain name. Any descriptions of, references to, or links to other products, publications or services does not constitute an endorsement, authorization, sponsorship by or affiliation with SL Advisors LLC with respect to any linked site or its sponsor, unless expressly stated by SL Advisors LLC. Any such information, products or sites have not necessarily been reviewed by SL Advisors LLC and are provided or maintained by third parties over whom SL Advisors LLC exercise no control. SL Advisors LLC expressly disclaim any responsibility for the content, the accuracy of the information, and/or quality of products or services provided by or advertised on these third-party sites.
All investment strategies have the potential for profit or loss. Different types of investments involve varying degrees of risk, and there can be no assurance that any specific investment will be suitable or profitable for a client’s investment portfolio.
Past performance of the American Energy Independence Index is not indicative of future returns.


Some time ago you did a fascinating piece on the parabolic rise in Free Cash Flow within the MLP infrastructure stocks from a base of $1 B in 2018.
Now that we are half way thru 2019, are free cash flows increasing as a result of projects coming on line and reductions in Cap X .as foreseen in your article? Thank you for all your insights.
Yes, we still see the sector as broadly on track for that FCF growth.