Energy Demand Drives Earnings Higher
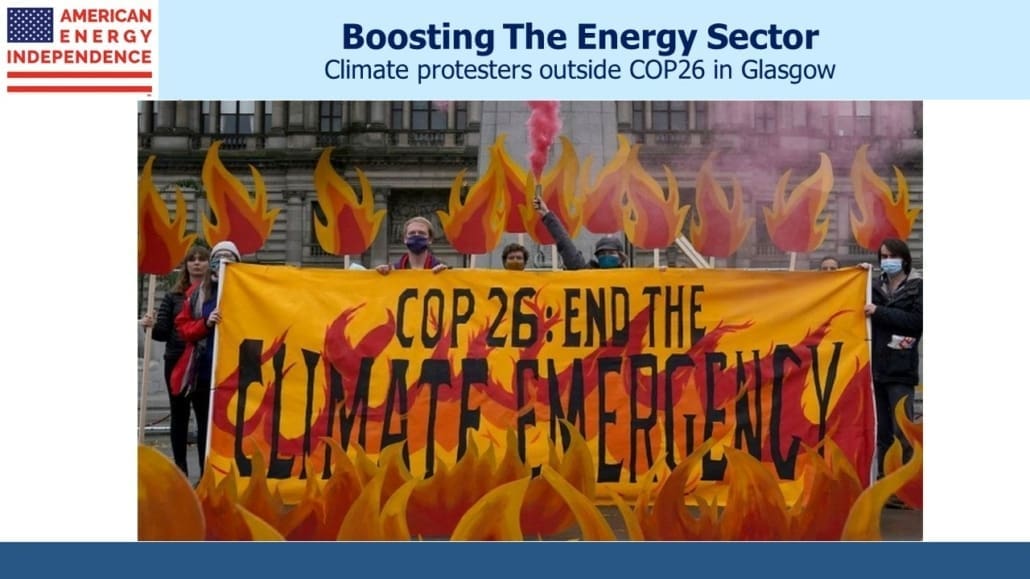
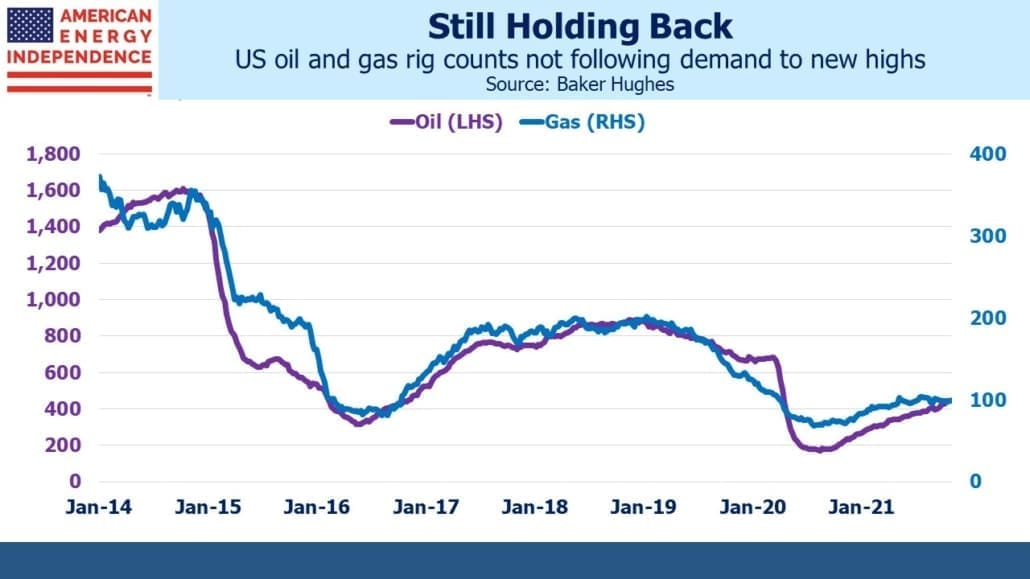
The global energy crisis is turning out to be the catalyst driving the sector higher. Years of under-investment in new oil and gas output are finally colliding with relentless demand growth. Energy investors are enjoying growing free cash flow because of reduced capex. The credit for this shareholder-friendly behavior should be shared with climate extremists – although Wall Street has lost interest in non-accretive production growth, executives have also been forced to acknowledge the reality of the energy transition by a relentless barrage of protests, court challenges, noisy activists and media.
The consequent improvement in financial performance has investors cheering while management teams proclaim that they were always planning to adapt. The irony is that the resurgence of the energy sector on the back of high prices is one of the most tangible results of Greta et al. The inability of oil and gas producers to respond to rising energy demand by increasing output was supposed to be made irrelevant by greater penetration of solar and wind power. That traditional fuels have seen their prices rising while solar panels and windmills are not reported to be in short supply highlights both the effectiveness of climate extremists as protesters and the ineffectiveness of their policy prescriptions.
Williams Companies (WMB) reported another strong quarter after Monday’s close. Natural gas volumes in their gathering business (14 Billion Cubic Feet per Day, BCF/D) and pipeline transportation segment (23.8 BCF/D) underpinned results. Asian buyers have paid as much as $56 per Million BTUs for shipments of Liquified Natural Gas (LNG), an enormous premium to US prices of around $6. China has returned as a significant buyer of US LNG exports, and is likely to replace Japan this year as the world’s biggest importer.
The price gulf reflects constraints on US liquefaction infrastructure. Adding capacity takes years. Cheniere, America’s biggest LNG exporter, is one of the biggest beneficiaries. They are now reducing growth capex with commensurate improvement in free cash flow after many years of developing its export facilities.
US LNG exports averaged 9.3 BCF/D during September – down from August but the most ever for that month. Poor weather in Louisiana delayed some shipments and Cove Point was down for annual maintenance.
Given the price differential, foreign buyers are desperate for higher volumes from the US. The Energy Information Administration expects LNG exports to average 10.7 BCF/D during the winter months, buoyed by continued global demand.
Regular readers know we have long favored natural gas over crude oil pipeline exposure. Natural gas has a more visible growth path. The shift to electrification of energy consumption provides strong support, as does weaning power stations off coal. Growth in renewables also increases the need for “dispatchable” power — i.e. electricity that can be transmitted when needed and not just when the weather co-operates. Most serious long term forecasts of global natural gas demand show growth of 1-2% p.a. for the next three decades (generally the forecast horizon).
I spent the last couple of days visiting with clients in SW Florida. Bigger firms are seeing close to normal return to the office. Commutes in the Tampa Bay area are typically less than 30 minutes – a far cry from the 75-90 minute twice-daily trip I endured commuting between NJ and NYC for 25 years – so the case for remote work is less compelling.
In conversations with Investors, it’s clear that the income offered by pipeline stocks is regaining its former appeal. Dividend coverage continues to grow. For example, WMB expects its adjusted funds from operations to exceed dividend payments and growth capex. Their dividend is +2.5% on a year ago and they announced a $1.5BN stock buyback program.
The COP26 climate change conference in Glasgow is exposing the fault lines between OECD countries, that generally want lower CO2 emissions now, and emerging economies like China and India that prioritize raising huge swathes of their populations out of poverty. This requires increased energy use, most starkly shown by China and India’s refusal to curb domestic coal consumption.
Just as attendees at the Davos Global Economic Forum appear tone-deaf by arriving in private jets to preach reduced emissions to the proletariat, so are political leaders in Glasgow. Photos of dozens of limousines with their engines idling and President Biden’s 85-car motorcade on a recent tour of Rome suggest that lifestyle changes are still expected to apply to others.
One might think that rich world efforts to reduce emissions would lose momentum if the world’s #1 and #3 CO2 generators plan to keep increasing theirs. What seems more likely is that developed countries will maintain their efforts to decarbonize. Therefore, energy demand is likely to keep rising as living standards improve in poorer countries while publicly held oil and gas companies maintain their relatively parsimonious control over capex budgets. Higher prices over the medium term seem inevitable. Bank of America expects crude oil to reach $120 per barrel by next summer. BP said global demand is back to 100 million barrels per day and is likely to be higher next year. US production remains 1.7 MMB/D below where it was when world demand was last at this level, as drillers remain cautious about capex.
Methane leaks from natural gas production face new more stringent regulation in the US from the EPA, which is another constraint on new infrastructure investments to support higher production.
Firm oil and gas markets combined with still attractive valuations and continued financial discipline are why midstream energy infrastructure remains a compelling investment.
We have three funds that seek to profit from this environment:
Important Disclosures
The information provided is for informational purposes only and investors should determine for themselves whether a particular service, security or product is suitable for their investment needs. The information contained herein is not complete, may not be current, is subject to change, and is subject to, and qualified in its entirety by, the more complete disclosures, risk factors and other terms that are contained in the disclosure, prospectus, and offering. Certain information herein has been obtained from third party sources and, although believed to be reliable, has not been independently verified and its accuracy or completeness cannot be guaranteed. No representation is made with respect to the accuracy, completeness or timeliness of this information. Nothing provided on this site constitutes tax advice. Individuals should seek the advice of their own tax advisor for specific information regarding tax consequences of investments. Investments in securities entail risk and are not suitable for all investors. This site is not a recommendation nor an offer to sell (or solicitation of an offer to buy) securities in the United States or in any other jurisdiction.
References to indexes and benchmarks are hypothetical illustrations of aggregate returns and do not reflect the performance of any actual investment. Investors cannot invest in an index and do not reflect the deduction of the advisor’s fees or other trading expenses. There can be no assurance that current investments will be profitable. Actual realized returns will depend on, among other factors, the value of assets and market conditions at the time of disposition, any related transaction costs, and the timing of the purchase. Indexes and benchmarks may not directly correlate or only partially relate to portfolios managed by SL Advisors as they have different underlying investments and may use different strategies or have different objectives than portfolios managed by SL Advisors (e.g. The Alerian index is a group MLP securities in the oil and gas industries. Portfolios may not include the same investments that are included in the Alerian Index. The S & P Index does not directly relate to investment strategies managed by SL Advisers.)
This site may contain forward-looking statements relating to the objectives, opportunities, and the future performance of the U.S. market generally. Forward-looking statements may be identified by the use of such words as; “believe,” “expect,” “anticipate,” “should,” “planned,” “estimated,” “potential” and other similar terms. Examples of forward-looking statements include, but are not limited to, estimates with respect to financial condition, results of operations, and success or lack of success of any particular investment strategy. All are subject to various factors, including, but not limited to general and local economic conditions, changing levels of competition within certain industries and markets, changes in interest rates, changes in legislation or regulation, and other economic, competitive, governmental, regulatory and technological factors affecting a portfolio’s operations that could cause actual results to differ materially from projected results. Such statements are forward-looking in nature and involves a number of known and unknown risks, uncertainties and other factors, and accordingly, actual results may differ materially from those reflected or contemplated in such forward-looking statements. Prospective investors are cautioned not to place undue reliance on any forward-looking statements or examples. None of SL Advisors LLC or any of its affiliates or principals nor any other individual or entity assumes any obligation to update any forward-looking statements as a result of new information, subsequent events or any other circumstances. All statements made herein speak only as of the date that they were made. r
Certain hyperlinks or referenced websites on the Site, if any, are for your convenience and forward you to third parties’ websites, which generally are recognized by their top level domain name. Any descriptions of, references to, or links to other products, publications or services does not constitute an endorsement, authorization, sponsorship by or affiliation with SL Advisors LLC with respect to any linked site or its sponsor, unless expressly stated by SL Advisors LLC. Any such information, products or sites have not necessarily been reviewed by SL Advisors LLC and are provided or maintained by third parties over whom SL Advisors LLC exercise no control. SL Advisors LLC expressly disclaim any responsibility for the content, the accuracy of the information, and/or quality of products or services provided by or advertised on these third-party sites.
All investment strategies have the potential for profit or loss. Different types of investments involve varying degrees of risk, and there can be no assurance that any specific investment will be suitable or profitable for a client’s investment portfolio.
Past performance of the American Energy Independence Index is not indicative of future returns.


The proposed methane regulations would preclude venting and flaring from oil wells and compel; associated gas to be either stored or put into pipelines, according to a story in today’s WSJ. That is excellent for midstream infrastructure partnerships and corporations.
Please ignore the semi-colon in my comment. Bad typing on my part.