Comparing Conoco Phillips with MLPs
 Around ten days ago Conoco Phillips (COP) and Magellan Midstream (MMP) both released their 4Q15 earnings, and held conference calls on February 4th to discuss them. This coincidence of reporting is about all they have in common, but it caused us to look a bit more closely at an energy company (COP) that truly has commodity price exposure and what it’s doing about it.
COP announced a two-thirds cut in their dividend, a completely understandable move because they really are financing it with debt. The problem with an Exploration and Production (E&P) company like COP is that they have to keep replacing their assets. Hydrocarbons produced are assets no longer available to generate future revenues, and so they keep investing in new future production. Consequently, COP’s $3.3BN of 2015 EBITDA was dwarfed by $10BN of capex resulting in negative free cashflow (FCF). They lost $3.50 per share. The company closed out the year with half the cash with which it started ($2.4BN versus $5.1BN) and on top of that their proved reserves fell by 19%, from 8.9 BBOE (Billions of Barrels of Oil Equivalent) to 8.2 BBOE. Incidentally, COP’s 2015 Depreciation, Depletion and Amortization (DD&A) was $9BN, pretty close to their capex. Their new investments were approximately equal to the hydrocarbon assets they extracted and sold. In 2016 their DD&A is likely to exceed their capex by $2BN. They are running very hard and not even moving forward. 2015 was a year COP will happily forget – they lost money, used up half their cash and saw their reserves drop. They have nothing to show for it.
It’s hard to know how to value COP, and especially hard to compare them with an MLP (which is where we’re going). Neither their free cashflow yield nor their P/E multiple are meaningful since both are negative. On an Enterprise Value/EBITDA (EV/EBITDA) basis they’re priced at 15.4X based on 2016 guidance, which incorporates a 36% slashing of their capex budget to $6.4BN. This multiple flatters COP and all E&P companies though, because it backs out depletion and depreciation although their future EBITDA is dependent on continuing growth capex to replace what’s gone.
COP’s dividend cut was a belated acknowledgment of the obvious, which is that they don’t generate any cash to pay a dividend so are funding it with debt. In fact, COP operates in the way that many MLP critics assert is prevalent with midstream infrastructure businesses, although there are substantial differences between the assets of an E&P company (hydrocarbon reserves which are used up) and pipelines which last for decades and don’t require perennial replacement (although they do require maintenance).
MMP reported solid earnings and generates Distributable Cash Flow (DCF), a measure somewhat analogous to COP’s FCF (although MLP critics will disagree on this point). MMP’s DCF covers their distribution, whereas COP really has no business paying a dividend. MMP’s EV/EBITDA, in which their EBITDA is more reflective of FCF generation because its assets are not naturally depleting, is 15.3X on 2016 guidance, roughly the same as COP’s.
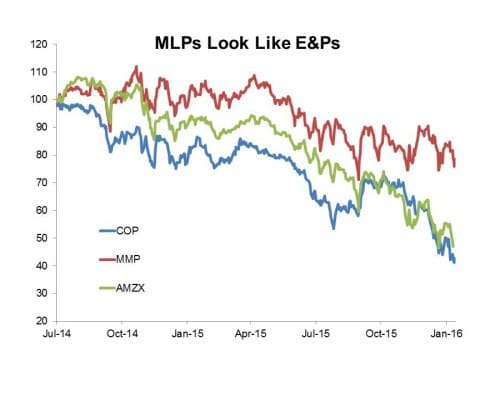
Now it’s true that COP has tracked the Alerian Index (AMZX) more reliably than MMP, which is to say MLPs have behaved like an enormous cash-consuming owner of depleting assets rather than the cash-generative owner of sustainable assets that they are (chart source: SL Advisors). The few E&P names in the Alerian index have been dumped following distribution cuts (reliable distributions are one of the the rules for inclusion), so AMZX no longer includes E&P businesses. MMP has outperformed AMZX, and yet its valuation fails to differentiate it from COP. It has been dragged down by its sector.
We continue to think that the ongoing collapse in MLPs is reflective of their financing model and rigidity of the investor base (see The 2015 MLP Crash; Why and What’s Next). Traditional MLP investors are U.S. taxable, high net worth (HNW) individuals. The arrival of smaller retail investors through mutual funds and ETFs for a time met the increased need for growth capex that traditional MLP investors, who like their distributions, didn’t want to finance by reinvesting everything they received. The retail investor was the marginal buyer, for a while. The surprise has been that upon his exit, new sources of financing have required a substantial price discount. MLP proponents have written for years about the institutionalization of the sector. The evidence clearly shows that once you exclude institutional money managers of retail money, the true institutional investors of public equities (pension funds, sovereign wealth funds, endowments and foundations) are not natural MLP investors because of the tax barriers.
Deciding the sector is cheap and then identifying a manager and implementing is a deliberate process, and while we see some evidence that it is under way, the buyer of an MLP today is most likely still the traditional HNW taxable investor. Given the collapse in prices, he’s not very enthusiastic. In this way, the MLP sector is unlike any other sector of the U.S. equity markets where capital can move in more opportunistically. Eventually, institutional investors will commit more meaningful capital, but it takes time. Most of the publicly listed MLP funds are terribly tax-inefficient (see The Sky High Expenses of MLP Funds), although not ours. As well as selecting a manager to oversee an MLP portfolio, a non-tax paying pension fund must decide to file a tax return (as direct holdings of MLPs would require). These are not trivial decisions. Count the cheerleaders for the “institutionalization” of the MLP sector among those whose views were aspirational rather than realistic.
We are invested in MMP.

Important Disclosures
The information provided is for informational purposes only and investors should determine for themselves whether a particular service, security or product is suitable for their investment needs. The information contained herein is not complete, may not be current, is subject to change, and is subject to, and qualified in its entirety by, the more complete disclosures, risk factors and other terms that are contained in the disclosure, prospectus, and offering. Certain information herein has been obtained from third party sources and, although believed to be reliable, has not been independently verified and its accuracy or completeness cannot be guaranteed. No representation is made with respect to the accuracy, completeness or timeliness of this information. Nothing provided on this site constitutes tax advice. Individuals should seek the advice of their own tax advisor for specific information regarding tax consequences of investments. Investments in securities entail risk and are not suitable for all investors. This site is not a recommendation nor an offer to sell (or solicitation of an offer to buy) securities in the United States or in any other jurisdiction.
References to indexes and benchmarks are hypothetical illustrations of aggregate returns and do not reflect the performance of any actual investment. Investors cannot invest in an index and do not reflect the deduction of the advisor’s fees or other trading expenses. There can be no assurance that current investments will be profitable. Actual realized returns will depend on, among other factors, the value of assets and market conditions at the time of disposition, any related transaction costs, and the timing of the purchase. Indexes and benchmarks may not directly correlate or only partially relate to portfolios managed by SL Advisors as they have different underlying investments and may use different strategies or have different objectives than portfolios managed by SL Advisors (e.g. The Alerian index is a group MLP securities in the oil and gas industries. Portfolios may not include the same investments that are included in the Alerian Index. The S & P Index does not directly relate to investment strategies managed by SL Advisers.)
This site may contain forward-looking statements relating to the objectives, opportunities, and the future performance of the U.S. market generally. Forward-looking statements may be identified by the use of such words as; “believe,” “expect,” “anticipate,” “should,” “planned,” “estimated,” “potential” and other similar terms. Examples of forward-looking statements include, but are not limited to, estimates with respect to financial condition, results of operations, and success or lack of success of any particular investment strategy. All are subject to various factors, including, but not limited to general and local economic conditions, changing levels of competition within certain industries and markets, changes in interest rates, changes in legislation or regulation, and other economic, competitive, governmental, regulatory and technological factors affecting a portfolio’s operations that could cause actual results to differ materially from projected results. Such statements are forward-looking in nature and involves a number of known and unknown risks, uncertainties and other factors, and accordingly, actual results may differ materially from those reflected or contemplated in such forward-looking statements. Prospective investors are cautioned not to place undue reliance on any forward-looking statements or examples. None of SL Advisors LLC or any of its affiliates or principals nor any other individual or entity assumes any obligation to update any forward-looking statements as a result of new information, subsequent events or any other circumstances. All statements made herein speak only as of the date that they were made. r
Certain hyperlinks or referenced websites on the Site, if any, are for your convenience and forward you to third parties’ websites, which generally are recognized by their top level domain name. Any descriptions of, references to, or links to other products, publications or services does not constitute an endorsement, authorization, sponsorship by or affiliation with SL Advisors LLC with respect to any linked site or its sponsor, unless expressly stated by SL Advisors LLC. Any such information, products or sites have not necessarily been reviewed by SL Advisors LLC and are provided or maintained by third parties over whom SL Advisors LLC exercise no control. SL Advisors LLC expressly disclaim any responsibility for the content, the accuracy of the information, and/or quality of products or services provided by or advertised on these third-party sites.
All investment strategies have the potential for profit or loss. Different types of investments involve varying degrees of risk, and there can be no assurance that any specific investment will be suitable or profitable for a client’s investment portfolio.
Past performance of the American Energy Independence Index is not indicative of future returns.
As usual your comments are incisive and analytically accurate. Why don’t you copy the Editors of Barrons’ who seem to have some inexplicable crusade to denigrate MLPs and use half-truths an innuendo, but not the kind of facts contained in your posts, to do so?
Because thats where the value lies….why ruin a good thing?
Yes, another very good piece. I was curious, news that Tepper got in has moved the market apparently. ETP and KMI were understandable picks but I was curious about his decision to buy AMLP. Clearly, he wanted some broad-based exposure as well but I was wondering about what a hedge fund manager piling into a product like that would be thinking besides liquidity. Has AMLP lost enough money that with the DTA he won’t actually have to give up the 35% tax for a while. I.e. is the threshold for tax paying is high enough above the current market price that he can cash out without worrying about taxes too much?
I know you have discussed AMLP various times and I think I have a fairly good handle on how it works. Surprised that Tepper would choose it but perhaps as short term kind of tactical play it makes sense.
AMLP has a DTA of just over $1BN with NAV of $5.4MM. At a 35% corp tax rate, I’d estimate that it won’t start paying taxes again until it’s risen 50%. Maybe Tepper doesn’t expect to own it beyond that.
That makes sense and thanks very much for the reply.
What about asset prices? Have they been holding up in the down turn?
I only ask this because back in the oil down turn in 2001 Companies like Paterson-UTI and Ensco Int. owned rigs which was well above the market cap.
Market transactions could be a nice indicator and its nice to purchase things that arnt dependent on oil prices.