Drilling Down on Shale Depletion Rates

The Shale Revolution has substantially increased America’s output of oil, natural gas and natural gas liquids. We often use the chart below to highlight this exponential growth.

.avia-image-container.av-jb3v99-6293e44219e48a01597de723e6844b62 img.avia_image{ box-shadow:none; } .avia-image-container.av-jb3v99-6293e44219e48a01597de723e6844b62 .av-image-caption-overlay-center{ color:#ffffff; }

Those exponential curves are going to flatten, not only because nothing can rise that fast indefinitely, but also because of the high initial depletion rates of fracked wells.

.avia-image-container.av-1msokd9-05585c146dd9db55cf64ed294a4bb28d img.avia_image{ box-shadow:none; } .avia-image-container.av-1msokd9-05585c146dd9db55cf64ed294a4bb28d .av-image-caption-overlay-center{ color:#ffffff; }

The chart above from Goldman Sachs provides a useful picture of shale oil production, which shows a gently flattening growth curve. It can be helpful to examine more closely how the lifecycles of cumulative wells combine to render growth ever harder to achieve.

The chart below is a theoretical model, showing a shale oil play in which production drops at 50% annually from previously drilled wells, while at the same time new wells are fracked each year with initial production of 1.6 million barrels per day (MMB/D).

.avia-image-container.av-12xa3vh-94da7578ca4bcba2b881d517decbe7e3 img.avia_image{ box-shadow:none; } .avia-image-container.av-12xa3vh-94da7578ca4bcba2b881d517decbe7e3 .av-image-caption-overlay-center{ color:#ffffff; }

It’s a busy chart but worth a moment to examine carefully.

Year 1 production of 1.6 MMB/D experiences 50% depletion in Year 2, of 0.8 MMB/D. But new production of another 1.6 MMB/D raises Year 2 total productioln to 2.4 MMB/D, a 50% jump.

Follow the successive depletion arrows from Year 1 production through Years 3-5, and you’ll see that they’re joined by depletion from later years of production. By Year 5, depletion from the four prior years totals 1.5 MMB/D, almost negating that year’s new production.

This illustrates a fundamental advantage of “tight” oil over conventional production. Output can rise very quickly and capital is invested over time in successive wells. This creates the short-cycle feature since capital is recycled very quickly (see Shale Cycles Faster, Boosting Returns). Moreover, if prices drop in, say, Year 3 the E&P company in this example can simply stop drilling. Production quickly plummets, since New Production is at least half of Total Production.

The model is intended to provide a couple of insights. One is that after an initial ramp up, production has to flatten. The other is that production can quickly fall, and following an initial sharp recovery starts to plateau again. This is visible on the Goldman chart during the 2014-16 oil collapse.

Our model is simplistic to illustrate a point. Productivity continues to improve, technology enhancements are regularly found, and the most productive areas are often drilled first. These and other factors will all obscure the depletion effect illustrated.

.avia-image-container.av-vosypp-29c0f62d4c4607e37da96075692bf9da img.avia_image{ box-shadow:none; } .avia-image-container.av-vosypp-29c0f62d4c4607e37da96075692bf9da .av-image-caption-overlay-center{ color:#ffffff; }

The chart above is an estimate of what we expect U.S. shale oil production growth to be from now until 2025.

.avia-image-container.av-vhu6xp-1516417ce60c7880056c605248e1d1f4 img.avia_image{ box-shadow:none; } .avia-image-container.av-vhu6xp-1516417ce60c7880056c605248e1d1f4 .av-image-caption-overlay-center{ color:#ffffff; }

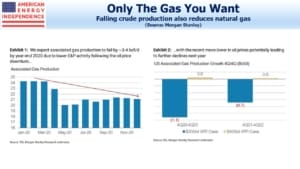
A final interesting note is that this depletion effect is much more pronounced with oil wells versus natural gas. Crude wells experience faster initial depletion. This tends to shift the Oil-Gas ratio in favor of the latter, and also means that the inexorable drag on total output caused by depletion is less pronounced for natural gas wells compared with crude oil. The pair of charts above illustrate this. It’s partly why natural gas output is likely to continue growing, keeping prices depressed. By contrast, growth in U.S. crude output is likely to moderate. This is net bearish for natural gas prices and bullish for oil.

If you missed our webinar last week, titled “Volumes, Cashflow and ESG”, here’s a link to a replay.

SL Advisors is the sub-advisor to the Catalyst MLP & Infrastructure Fund. To learn more about the Fund, please click here.

SL Advisors is also the advisor to an ETF (USAIETF.com).


Unicorns Not Working

The rapid transition of WeWork from IPO in early September to almost bankrupt says something about the superficial due diligence of bankers prior to a roadshow. Reports suggest that co-founder Adam Neumann’s $1.7BN million payoff in exchange for much of his stock and his board seat will save him from having to file for personal bankruptcy. Like the late Aubrey McClendon when he ran Chesapeake, Neumann bet everything by borrowing heavily against his equity holdings. Meanwhile, Softbank has invested over $10BN into a company whose equity is now worth at $8BN. In January, WeWork was valued at $47BN. Another report suggested that layoffs were delayed because the company didn’t have the cash for severance payments.

Few will shed a tear for Neumann or Softbank. If you aim high and miss, down’s a long way. Founders and investors in a company can be expected to talk up its valuation.

.avia-image-container.av-w5j8sh-869da408cd015d838468b4edd7a75fe2 img.avia_image{ box-shadow:none; } .avia-image-container.av-w5j8sh-869da408cd015d838468b4edd7a75fe2 .av-image-caption-overlay-center{ color:#ffffff; }

But what about the bankers, who only a few weeks ago were out there pitching a hot growth stock that in reality was desperately in need of cash simply to stay afloat? We’re not natural IPO buyers, but doesn’t this company just sign long term property leases and then sub-lease for shorter terms?

Stocks can dip after an IPO, but it’s rare for bankers to so misread investor sentiment that the deal is cancelled. Early this year there were over 300 high growth, private companies valued at over $1BN (“unicorns”). Some mutual funds sought to boost returns on their public equity portfolios with a sprinkling of unicorns. That strategy has recently backfired, as Uber, Lyft and Peloton all slumped following their recent IPOs.

.avia-image-container.av-1qxen9d-e9f5dcd851cf2e04ec1be1b4c31a1d93 img.avia_image{ box-shadow:none; } .avia-image-container.av-1qxen9d-e9f5dcd851cf2e04ec1be1b4c31a1d93 .av-image-caption-overlay-center{ color:#ffffff; }

Investors seem to be recovering a protective layer of cynicism.

A close family member is an astute investor with an age-appropriate, conservative portfolio. She allocates a small portion for interesting, risky ideas, and bought into Tilray (TLRY) in its Canadian IPO in July 2018. CFA charterholders shouldn’t bother looking at marijuana stocks. Farmers all over the world rely on enormous government subsidies, without which their businesses apparently couldn’t survive. This simple observation, along with TLRY’s stratospheric multiples, supported my advice to my wife not to follow our relative’s lead. TLRY quickly soared to almost six times its IPO.

.avia-image-container.av-1bel6v5-113c11db7065d8f35cdf1bc8361cfe6f img.avia_image{ box-shadow:none; } .avia-image-container.av-1bel6v5-113c11db7065d8f35cdf1bc8361cfe6f .av-image-caption-overlay-center{ color:#ffffff; }

Our family’s most ruthless trader sold enough near the high to cover her cost within three months, as one of the most beautiful short squeezes in recent years swept away those who had shorted TLRY based on fundamentals. It’s been an occasional topic in our house at breakfast, along the lines of “Do you know what I could have bought if you hadn’t told me to avoid that pot stock?” Responding that my wife doesn’t pay enough in fees to warrant an account review while I’m eating my cereal draws a predictable retort.

.avia-image-container.av-jdsbgh-a607bd3bcb3fbe5d50fa704bc608d022 img.avia_image{ box-shadow:none; } .avia-image-container.av-jdsbgh-a607bd3bcb3fbe5d50fa704bc608d022 .av-image-caption-overlay-center{ color:#ffffff; }

The time for frothy stocks has passed. In a year of strong equity returns, low volatility stocks are ahead, even though they’d be expected to lag at such times. The American Energy Independence Index, jammed full of cheap stocks and with nothing remotely unicorn-like, is keeping up the pace. Investors are turning towards tangible values with proven business models.


Pipeline Stocks Are Quietly Recovering

“Horrific. Terrible. Abysmal. The worst. Those are terms equity analysts are using to describe investors’ attitude toward energy stocks.”

This is from a recent Wall Street Journal article (see Energy Stocks Fall Faster Than Oil Prices).

Sentiment in the energy patch is poor. Too much spending with too little returned to shareholders is the main gripe, along with what seems like a tendency for the sector to follow crude prices lower but then fail to participate in any recovery.

The WSJ article goes on to note that over the past year, crude has dropped 26% while the S&P Exploration and Production index (denoted in the chart by its ETF, XOP) has lost almost half its value.

It’s especially odd when E&P operating performance has been improving. In I Can’t Make You Love Me – E&Ps’ Performance Belies Negative Investor Sentiment, RBN Energy walks through metrics including profitability, reserve replacement and shareholder returns (buybacks and dividends) to illustrate that domestic energy companies are heeding the criticisms of investors. So far, it’s not helping their stock prices.

The gloom is overshadowing the improving outlook for midstream energy infrastructure stocks. Earnings season will provide another opportunity to confirm that the sector remains on track to grow free cash flow (see The Coming Pipeline Cash Gusher). But it’s already becoming clear that the performance of pipeline stocks is deviating markedly from the upstream E&P companies that are their customers.

.avia-image-container.av-1751hxk-61145dd88b3b7cf3765a7e8e5a19eaf9 img.avia_image{ box-shadow:none; } .avia-image-container.av-1751hxk-61145dd88b3b7cf3765a7e8e5a19eaf9 .av-image-caption-overlay-center{ color:#ffffff; }

While XOP is down 49% over the past year, the American Energy Independence Index (AEITR) is close to flat, and was briefly positive following the attack on Saudi Arabia’s oil infrastructure. Although still lagging the S&P500, the sector has recovered from the 20% swoon during last year’s fourth quarter. E&P stocks remain a long way from recovery.

The AEITR is also 7% ahead of the Alerian MLP Index (AMZX) since last October, helped by inflows from ESG funds with their focus on standards of environmental, social and governance practices. The partnership-heavy AMZX holds little appeal to ESG investors, compared with the corporation-heavy AEITR where corporate governance provides stronger investor protections.

Weak commodity prices are another problem for E&P names. Natural gas gets less attention than crude oil, but prices for the benchmark Henry Hub recently sank to $2.25 per MCF (Thousand Cubic Feet). Production continues to grow strongly in the northeast, thanks to the Marcellus and Utica shale formations in Pennsylvania. But a shortage of pipeline capacity has recently led to a discount of as much as $1 per MCF, meaning Marcellus natural gas was worth as little as $1.25 per MCF locally.

Some E&P stocks are almost worthless. Range Resources (RRC) is a company we followed almost a decade ago. In the years preceding the 2014 peak in the energy sector, RRC traded above $50 and was briefly above $90. We liked the management team very much, but noticed that they continued to sell their own shares even while quietly confiding that they thought they could be acquired for $120. We sold out.

.avia-image-container.av-ktxw14-61bee61244af249dc5576b880c6c9613 img.avia_image{ box-shadow:none; } .avia-image-container.av-ktxw14-61bee61244af249dc5576b880c6c9613 .av-image-caption-overlay-center{ color:#ffffff; }

Today, RRC is at $3. In a recent presentation they claimed resource potential of 40 TCF (Trillion Cubic Feet) of natural gas, enough to meet all U.S. domestic consumption for around 16 months. In our write-up from a 2010 RRC presentation, we noted their claim to 30 TCF of resource potential at that time. Holders from nine years ago (if any remain) have lost 90% or more of their investment, and RRC has access to ever more copious volumes of natural gas.

The Shale Revolution has produced enormous output, but profits for upstream investors have been elusive. The sorry history of RRC reflects the frustration investors feel with energy stocks, with abundant resources coinciding with capital destruction.

That’s why it’s a welcome sight to see midstream stocks performing so much better than their customers – the link to commodity prices has been weakening over the past couple of years, and the toll-model of pipelines is once again providing some differentiation.


Pipeline Earnings in a Market Focused Elsewhere

Earnings season for midstream energy infrastructure kicks off with Kinder Morgan (KMI) on Wednesday. In April we identified growing free cash flow (see The Coming Pipeline Cash Gusher) as the most important catalyst for higher security prices. We’ll be reviewing quarterly earnings for evidence that the sector remains on track to generate increasing amounts of excess cash that can be used to reduce debt, increase payouts and buy back stock. There should also be some useful guidance on activity from the sector’s upstream customers. Investors and analysts seems weary of persistent low valuations, so any positive surprises should draw buyers.

The American Energy Independence Index (AEITR) is +16.9% YTD, having pulled back around 3.5% so far in October. It’s 11% ahead of the Alerian MLP Index, because its 80% weighting towards corporations (more ESG-friendly) better reflects investor preferences, which is to favor pipeline corporations over MLPs (see MLPs No Longer Represent Pipelines and ESG Investors Like Pipelines)

.avia-image-container.av-2dqpjy-451949c65f2dc11dc5b82467697ea73f img.avia_image{ box-shadow:none; } .avia-image-container.av-2dqpjy-451949c65f2dc11dc5b82467697ea73f .av-image-caption-overlay-center{ color:#ffffff; }

Although earnings and company guidance ought to dominate sector performance in the weeks ahead, there are a growing number of macro and geopolitical issues that are impacting investor sentiment.

  • Making a deal with China in time to eliminate this as a potential election-year negative seems obvious (see Trade Wars: End in Sight). However, the latest signs of agreement have left the market nonplussed given the fitful journey followed so far.
  • Middle East. Like many observers, we were surprised at how quickly crude oil prices retraced gains following the attack on Saudi infrastructure. Clearly, oil traders regard any disruption of supplies as unlikely, even after the more recent missile attack on an Iranian tanker in the Red Sea near Jeddah. Nonetheless, American midstream energy infrastructure doesn’t face similar risks from terrorists or foreign powers.
  • Another EU deadline approaches in this most riveting drama (see Another Gripping Episode of Brexit). This is of little global consequence unless the UK somehow leaves the EU without an agreement (a “hard Brexit”). This is unlikely, but not impossible if one bluff too many is called.

Earnings may be overshadowed by developments. Global slowdown fears continue to spread. 2019 S&P500 earnings estimates have been softening all year, from $178 per share last October to $164 now, according to Factset. Bond yields remain highly unattractive. The Equity Risk Premium still shows stocks as a far preferable investment (see Stocks Offer Bond Investors an Opening).

Bill Gross recently recommended investors load up on high quality dividend-yielding stocks rather than negative-yielding government debt. We think bond markets are distorted in part by rigid investment guidelines followed by pension funds that require them to maintain large fixed income allocations regardless of return prospects (see Pension Funds Keep Interest Rates Low).

Equities remain attractive, and pipeline stocks exceptionally so.

We are invested in KMI.


Criticizing MLPs Helps Them

Wednesday’s blog, Energy Transfer’s Weak Governance Costs Them drew a record number of pageviews within a few hours of being posted. It’s not just because Energy Transfer (ET) is a large, widely held MLP. Much of the writing in the sector is from cheerleaders who don’t criticize the companies they follow, because it’ll hurt their business model. Commentary is largely anodyne, and useless. Running an investment firm that doesn’t have a complex web of relationships with its portfolio companies provides a wonderfully liberating writing environment.

Sometimes readers ask why we own a stock if we’ve just been critical of its management. It’s possible to find a stock attractively cheap, and yet lament prior actions of its executives. That’s often why it’s cheap. ET is a well-run company. CEO Kelcy Warren has assembled a team that knows how to execute. If investors trusted him more, the stock would be higher. It’s worth pointing out.

Pageviews on our blog reveal that investors find criticism far more helpful than sycophantic platitudes. For those who desire an irreverent spin on the energy sector delivered with rapier-like wit, follow @Mrs_Skilling, an anonymous and astute energy insider who will simultaneously educate and amuse you. Often, posts are laugh out loud funny.

.avia-image-container.av-pc4d65-0fec55968227e7cbf4497c5ae159c79f img.avia_image{ box-shadow:none; } .avia-image-container.av-pc4d65-0fec55968227e7cbf4497c5ae159c79f .av-image-caption-overlay-center{ color:#ffffff; }

In case it gets lost in the cut and thrust of calling out bad management behavior, U.S. midstream energy infrastructure is a compelling investment opportunity. The Shale Revolution is almost entirely an American success story (see Why the Shale Revolution Could Only Happen in America). The technology behind fracking was developed in America because new business formation, access to capital and constant striving for success are more present here than anywhere. Add to those advantages an already substantial energy sector with thousands of skilled workers supported by extensive infrastructure.

Privately-owned mineral rights are an additional unique feature that allows landowners to negotiate with energy companies to extract what lies beneath on mutually beneficial terms. Mineral rights belong to the government all over the world, including in the UK, whose legal system is the basis for much of ours.

The result has been an American energy renaissance that has released new supplies of oil and gas, and made the U.S. the world’s biggest producer. Ten years ago few thought such an outcome possible.

Moreover, shale production is short cycle (see Shale Cycles Faster, Boosting Returns). Because the deployment of capital is more synchronized with production than conventional projects (think years and $BNs spent before production emerges as the traditional model), it’s less risky. Capital is recycled more rapidly, allowing production to be more responsive to price changes.

This is why it’s attracting the world’s biggest oil and gas companies. Exxon Mobil (XOM) is the most active driller in the Permian basin in Texas, where it is targeting one million barrels per day (MMB/D) of output in five years. Chevron (CVX) is close behind, with a 0.9 MMB/D goal.

Warren Buffett famously quipped that, had he been at Kitty Hawk in 1903 he could have shot down the Wright Brothers’ plane, thereby saving future airline investors from losing $BNs over the following decades. History is full of great ideas that didn’t immediately profit their inventors, often because too much capital followed the opportunity.

U.S. shale production of oil, gas and natural gas liquids will find a level at which returns on invested capital are adequate. It may already be there. It’s not always clear whose investment in upstream production will be most profitable. In the Barnett Shale, where the shale boom began, production peaked in late 2011 and only a handful of rigs remain active today.

Output will ultimately calibrate to a sustainable level of capital investment. Countless companies have provided proof of concept, although investment returns have been frustratingly disappointing. The growing presence of XOM and CVX is substantial confirmation that this is a permanent piece of the world’s energy markets.

Shale production has performed far better than investments in it. Midstream infrastructure, the pipelines, storage assets and processing facilities that sit between the wellhead and the customer, remains out of favor despite record volumes. This is also largely an issue of capital allocation, with the original income-seeking investors understandably alienated as the sector cut distributions to pay for new growth projects (see It’s the Distributions, Stupid!). But capex is falling, finally setting the stage for a surge in free cash flow (see The Coming Pipeline Cash Gusher).

Criticism of individual companies is intended to draw attention to ways they could improve their behavior, lifting stock prices to the benefit of all investors. The Shale Revolution remains a huge success story for production, highlighting much that is great about America.  The companies that own these critical pipelines linking producers to consumers will continue to benefit from these growing volumes. Those who focus on valuations rather than past performance are likely to realize commensurate returns in the midstream.

We are invested in ET


ESG Investors Like Pipelines

.flex_column.av-17sm9ef-8e844c695d08e631d2e090b6e4bb861a{ border-radius:0px 0px 0px 0px; padding:0px 0px 0px 0px; }

.flex_column.av-rjq0pj-4effdcc6882a8bd7ca36cbf423532423{ border-radius:0px 0px 0px 0px; padding:0px 0px 0px 0px; }


Review Of Russell Gold’s Superpower

Five years ago Russell Gold published The Boom: How Fracking Ignited the American Energy Revolution and Changed the World, one of several books that chronicled the Shale Revolution. Gold provided first-hand descriptions of fracking after persuading Marathon Oil to let him visit a site in North Dakota. He offers a fascinating description of the process that has transformed America’s energy production. We reviewed his book here. Gold displays his green credentials as he wrestles with the tradeoffs he perceives between abundant natural gas and the renewables growth it impedes. But on balance, he concludes that Shale has been good for America.

Russell Gold’s latest book, Superpower: One Man’s Quest to Transform American Energy seems at first to challenge the supremacy of the Shale Revolution and America’s energy renaissance. It follows Michael Skelly in his quest to harness wind power across the south eastern U.S. to provide electricity.

Gold recounts the early use of electricity, back in 1881 when J. P. Morgan’s New York townhouse was one of the first installations. The house was lit every day at 4pm, powered by a coal-burning steam generator whose noise and smoke upset the neighbors.

Highlighting the advantages of wind power may have been Gold’s intent, but after following Michael’s Skelly’s frustrating and ultimately unsuccessful attempt to transform power generation, this reader found the challenges more substantial than the opportunity.

The impediments Michael Skelly encountered were not technical. Texas produces a quarter of America’s wind powered electricity. On March 17, 2017 50% of all the electricity used in Texas came from wind. Renewables such as solar and wind suffer from intermittency (i.e. it’s not always sunny and windy). This can play havoc with grids juggling multiple sources of power. But ERCOT, the grid that covers Texas, has figured out how to maintain consistent power while allowing wind to increase its share beyond what many thought possible.

Size brings economies of scale, but with it comes concentrated power generation in wind areas with delivery over hundreds of miles of high voltage lines to those than need it. Skelly’s vision was to invest in extensive, large windmills that would sell their power across several states. But erecting huge electricity pylons to connect with users generated local opposition that often proved insurmountable.

Michael Skelly’s company, Clean Line, applied to Arkansas to operate as a public utility, since his fledgling company needed to build power lines linking Oklahoma and Tennessee. Back in 1935, Arkansas Power had been granted a monopoly by the state in return for building out the state’s grid.

It was a cleverly designed Catch 22 type regulatory structure designed by then-CEO of Arkansas Power, Harvey Couch – in order to be granted a public utility license, a company had to be a utility “owning or operating” power equipment serving customers. But you couldn’t be a utility without first having customers. The legislation had never contemplated the entry of a new company into the state’s power business. Nonetheless, the Public Service Commission denied Clean Line a license. The beneficiary was Entergy Arkansas, a descendent of Arkansas Power.

Clean Line’s frustration in Arkansas showed the fragmented nature of the U.S. electricity grid. Although it operates as three regions covering the eastern U.S., western U.S. and Texas, in reality each state approves local construction. Utilities in Oklahoma opposed Clean Line’s plans to construct transmission lines across the state, relying on a similar statute.  Whereas the Federal Energy Regulatory Commission oversees inter-state pipelines, there is no equivalent Federal agency responsible for inter-state transmission lines.

Political opposition arose in surprising places. Tennessee senator Lamar Alexander, who might have been expected to favor clean, cheap wind power for his state, instead came out publicly against the “…giant fifty-story wind turbines that they want to string along the Appalachian mountaintops…” Alexander had also opposed offshore wind turbines that threatened the view from his home in Nantucket.

Superpower sets out to show that technology exists, and that entrenched interests are the only barrier to far greater use of wind power. This glass half full interpretation sits alongside the half empty one – large scale construction of wind turbines and the high voltage power lines to connect windy, remote regions with population centers faces endless NIMBY opposition and barriers from entrenched interests. Arkansas didn’t care to allow power lines moving clean energy across its state with little in-state benefit. Wind power clearly works, as Texas has shown, and will continue to grow. Despite passionate employees, hundreds of millions of dollars and a decade of work a single HVDC line couldn’t even connect economic wind power from Oklahoma to Tennessee. The institutional barriers, large required investment in physical infrastructure and local opposition mean a national grid is unlikely to replicate the U.S. pipeline system anytime soon.

Superpower is an absorbing read, and well worthwhile to anyone interested in the development of renewal energy.


The Complex Politics of Climate Change

Greta Thunberg’s speech at the United Nations may have grabbed the climate change headlines. But for those who find policy prescriptions from someone not yet out of high school a publicity stunt, the Energy Information Administration’s (EIA) 2019 International Energy Outlook was more interesting.

.avia-image-container.av-2g814sx-24b2b367e3b1e170348b1c370edcb9fb img.avia_image{ box-shadow:none; } .avia-image-container.av-2g814sx-24b2b367e3b1e170348b1c370edcb9fb .av-image-caption-overlay-center{ color:#ffffff; }

.avia-image-container.av-211arzl-1b87ee365830591456fa83875c615dd0 img.avia_image{ box-shadow:none; } .avia-image-container.av-211arzl-1b87ee365830591456fa83875c615dd0 .av-image-caption-overlay-center{ color:#ffffff; }

The UN’s Intergovernmental Panel on Climate Change (IPCC) wants the world to reduce man-made net CO2 emissions to zero by 2050, in order to limit global warming to a further 1.5 degrees C. By contrast, the EIA expects energy-related CO2 emissions to grow at 0.6% annually, a third of the 1990-2018 rate but nonetheless in the wrong direction. This is because the EIA forecasts world energy use to increase by nearly 50%, with virtually all that growth in non-OECD Asia (often referred to as Asia ex-Japan).

According to Climate Tracker, only two countries (Morocco and Gambia) are on track to meet their goals under the 2015 Paris Agreement, which turned the IPCC’s recommendations into governmental commitments.

The goal of lowering emissions is at conflict with many other UN goals, such as eliminating poverty and hunger, and ensuring access to clean water and sanitation. Non-OECD countries are generally where these goals need to be met, and their pursuit is increasing energy consumption. The rich-country OECD world wants reduced CO2 emissions while poorer non-OECD countries additionally want higher living standards.

.avia-image-container.av-61qi6p-f96bdd721753f9c33b3c234dd0a8ab8e img.avia_image{ box-shadow:none; } .avia-image-container.av-61qi6p-f96bdd721753f9c33b3c234dd0a8ab8e .av-image-caption-overlay-center{ color:#ffffff; }

The charts in the EIA’s outlook provide a sobering picture of the incompatibility of these objectives. Rising non-OECD living standards will by 2050 remain still 25% less than in the OECD today, and less than half the 2050 rich world level. This is in spite of growth in world energy consumption being fully taken up by non-OECD countries. Indian per capita residential energy consumption is still expected to be less than a quarter of U.S. by 2050.

Emerging Asia is the major source of this growth. India’s population is projected to surpass China’s over the next couple of decades, driving India’s faster GDP growth and also making India the fastest growing user of coal. China will remain biggest overall.

Growth in Indian electricity demand will be primarily met with renewables. It’s easier to shift your mix of power generation when consumption is growing. Yet India will still double its output from coal-fired power plants.

The reason almost none of the signatories to the Paris Agreement are on track to achieve their emission goals is that public support is broad but shallow. One survey found most U.S. households wouldn’t spend more than $10 per month to fight climate change.

.avia-image-container.av-10t0h1t-7b3ad26a3b184767dbfc4e6aff86e65a img.avia_image{ box-shadow:none; } .avia-image-container.av-10t0h1t-7b3ad26a3b184767dbfc4e6aff86e65a .av-image-caption-overlay-center{ color:#ffffff; }

Yet, dramatic reductions in emissions require substantial lifestyle changes with more expensive energy. Renewables are slowly gaining market share, but regardless of the promises of environmental extremists, all serious forecasts show fossil fuels remaining the world’s dominant source of energy. The EIA projects that we’ll be using more of all sources of energy. Consumption of petroleum and other liquid fuels will grow by 20%; natural gas by 40%. Renewables are expected to almost double their share of world energy, to around 28% by 2050, but satisfying growing global energy demand will require substantial growth in hydrocarbons.

.avia-image-container.av-ijf7e9-587722a3ca30a31fab27ad4084b84fd6 img.avia_image{ box-shadow:none; } .avia-image-container.av-ijf7e9-587722a3ca30a31fab27ad4084b84fd6 .av-image-caption-overlay-center{ color:#ffffff; }

Few Americans realize that the U.S. would need to reduce its CO2 emissions by around 15% over the next decade to meet its pledge, and that we’re generating 3.5X the amount that’s scientists believe is consistent with 1.5 degree planetary warming. If the U.S. had a plan to meet its pledge on emissions reduction, cost would quickly become an issue.

A big shift to renewables in the U.S. would raise the cost of energy. This is indisputable, because otherwise renewables would already be dominant. Climate extremists rarely discuss the costs, whereas we’ll need to make informed decisions about costs versus benefits.

Moreover, those most exposed to rising sea levels live in poor countries where emissions will continue to increase in order to raise living standards. Rich countries are far better able to manage the effects of changing climate. No U.S. politician has yet had to explain why Americans should pay more for energy in order to protect other countries from rising sea levels, even while those countries increase CO2 emissions. Trump’s planned withdrawal from the Paris Agreement next year is grounded in domestic political reality.

Paris pledges allow India, China and other non-OECD countries to continue increasing their emissions, acknowledging that increased living standards require more energy. While there is a moral argument in support of higher CO2 emissions from poorer countries, U.S. public opinion is untested on the issue of expensively curtailing domestic emissions to accommodate more output elsewhere. This will eventually be a significant political problem. Domestic environmental extremists are completely mis-directed. Growth in emissions is coming from Asia.

How will the world resolve its conflicting goals?

There are some sensible solutions: Federal standards and fast-track approval process for nuclear energy, which is clean and safe; phase-out coal with its harmful emissions in favor of cleaner natural gas; a carbon tax; Federal R&D into cleaner use of what works, which is fossil fuels.

All these steps and more will be needed to tackle the problem. Unfortunately, Democrat solutions such as the Green New Deal (see The Bovine Green Dream) and banning fracking are hopelessly impractical. Because their ideas have little prospect of implementation, Republicans aren’t pressured to offer alternative ideas.

The EIA’s report shows what world energy consumption will look like without significant changes in policies. Practical, centrist solutions that acknowledge trade-offs will be needed to develop deeper support for combating climate change. Voters will want to understand what they’re paying for. Until that happens, fringe policy prescriptions will scare people away. Greta Thunberg’s political grandstanding isn’t helping.


Another Gripping Episode of Brexit

For constitutional observers, each weekly Brexit installment leaves viewers on the edge of their seats, pondering what further twists in the drama remain. Most recently, England’s Supreme Court ruled against Conservative Prime Minister Boris Johnson’s suspension of Parliament. Intended to stifle parliamentary debate during the run-up to Britain’s next Brexit deadline of October 31, the PM had argued that the extended closure was a normal prorogation leading to the Queen’s speech opening parliament’s next session. Nobody was fooled, and Johnson has in effect been found to have provided illegal advice when he asked the Queen to suspend Parliament. Great embarrassment for PM and Monarch. Civil wars are fought for less.

Johnson’s premiership opened shakily last month. He lost four straight votes while Parliament passed a law preventing a hard Brexit. The PM had pledged to leave the EU on October 31, with or without a deal, and Parliament disagreed. He then tried to call an early election. But the opposition preferred him in office but not in power for a few more weeks, so voted that down too. The PM subsequently kicked 21 MPs out of the Conservative party, including Nick Soames, Churchill’s grandson.

As a vocal Brexit supporter, it’s entirely appropriate that Boris Johnson should be in power right now, so as to carry the burden of the policy he championed, and to explain any disruption in its execution.

The country where I grew up has suffered from a complete void of competent political leadership in recent years. David Cameron’s decision to hold the referendum on Brexit in 2016 unleashed the divisiveness that has dominated UK politics ever since. Leaving the EU is far too complex to be based on a simple Yes/No vote. It should have been fought through a general election, with the winner responsible for carrying it out. Except that none of the major political parties supported Brexit, a political gulf starkly exposed by the referendum. When politicians don’t reflect voters’ views, populism follows. It is democratic, if unsettling

If you know someone’s location you can pretty much guess how they voted. London and other large cities along with Scotland and Northern Ireland voted to remain, while suburban and rural England voted to leave. No wonder the Scots may seek independence from the UK, as they’re dragged unwillingly out of the EU. Although the vote was close (52%:48%), and didn’t provide any view on what type of EU exit was approved (though it probably wasn’t a hard Brexit), polls suggest that few voters’ positions have since moderated.

People regularly ask me how it’ll turn out. I don’t think anyone can be sure. Since Parliament has outlawed Brexit with no deal, but also failed to approve Theresa May’s exit deal when she was PM, another delay is possible. Johnson could negotiate a revised exit agreement and get it through Parliament, which will now be reconvening earlier because of the Supreme Court decision. But he’s lost his majority by ejecting Conservative MPs who previously voted against him, so he may fail in getting his deal through too.

Another Brexit delay would lead to a general election, on which Brexit would finally be the defining issue. It’s recasting normal voting patterns. The Conservatives are unambiguously the Brexit party.

Labor is led by Socialist Jeremy Corbyn, whose main accomplishment has been to offer such a dystopian vision of Britain under his premiership that Theresa May clung to power far longer than her inept negotiations should have allowed. Labor’s Brexit position is ambiguous, an odd posture when it’s the country #1 issue. They’re choosing strategic flexibility at the cost of votes.

The Lib-Dems are the Remain party. But they routinely run a distant third, which renders their popular vote vastly under-represented in Britain’s first past the post electoral system. Hence, Lib-Dem votes are often regarded as wasted, like voting for a third candidate in a U.S. presidential election.

As a result, Johnson is betting that he’ll romp home with a decisive majority over a divided Labor party and weakly supported Lib-Dems. So far his judgment has been poor on every big issue. So we’ll see how that turns out for him.

I have close friends on both sides of Brexit, and can well appreciate the emotions supporting leaving the EU even though I would have voted to Remain. I’ll be visiting the UK next week, and have little doubt it will be a topic of discussion.

In any event, I no longer vote in the UK, having emigrated over thirty years ago, thereby forfeiting my UK voting rights. Instead, I vote in the U.S. at every opportunity, including primaries and even school board elections. Brexit is an utterly absorbing spectacle for this transplanted Brit, safely ensconced in the U.S. Those who criticize America’s dysfunctional politics should watch the UK for a few days. Its democratic institutions are proving robust, in spite of the efforts of the current crop of leaders to break them.

EU history is full of late night crisis negotiations that avert catastrophe. Surely the biggest crisis of all will ultimately be resolved this way. My bet is that the UK will leave with a new deal, and as ill-advised as that move is, they’ll muddle through and things will work out. But there’s a wide range of possible outcomes, and next week I may change my mind again.


Pipelines Correlations Are More Pleasant

Clients often want to discuss the correlation between returns on midstream energy infrastructure and crude oil prices. Prior to 2014, investors learned that pipelines were like toll roads, more concerned with the volumes passing through than its value.

The 2014-16 crude oil collapse drove down the energy sector. Alerian’s index shed 58.2% over eighteen months, and the faith was lost. Conventional wisdom became that the pipeline business took a hit with lower oil. The truth was more nuanced – sector EBITDA grew throughout that period even while stock prices sagged (see REITS: Pipeline Dividends Got You Beat). Financing growth projects caused distribution cuts (see It’s the Distributions, Stupid!), alienating income-seeking investors.

Regular readers know the story, which is recounted in the links above.

.avia-image-container.av-vc4f8c-25c0445c1664ec66572b33e0e0cfc91e img.avia_image{ box-shadow:none; } .avia-image-container.av-vc4f8c-25c0445c1664ec66572b33e0e0cfc91e .av-image-caption-overlay-center{ color:#ffffff; }

Many would regard the chart below as confirming the high correlation between midstream and crude that they know to be the case. In fact, the correlation since the beginning of last year is 0.21, positive but not that meaningful. The nature of the calculation is that brief periods of sharp opposite moves have an outsized effect on the resulting number, compared with what a casual glance at a chart might imply.

The latter half of 2018 was probably one of the most frustrating periods for investors in recent years. Crude oil rallied strongly during the summer, while midstream stocks slumped. In the fall, crude fell sharply as the stocks continued falling. Statistically, the summer’s negative correlation followed by a positive one in the fall resulted no correlation for the entire period. But investors, reasonably enough, recall the period with more feeling than the statistics might suggest.

The answer is that midstream energy infrastructure tends to move with the overall energy sector – not surprising, since the E&P names are its customers. The S&P Energy ETF (XLE) moves with crude, which drives sentiment. Natural gas and associated liquids are more important than oil to pipelines but daily gyrations have little effect.

Questions on how the sector will hold up if interest rates rise are less common. Perhaps investors have tired of worrying about rising rates. Or maybe the sector volatility in recent years has pushed away many income-seeking investors.

.avia-image-container.av-rt4nwc-37da06c7be1aaeff5bbcd86deef71418 img.avia_image{ box-shadow:none; } .avia-image-container.av-rt4nwc-37da06c7be1aaeff5bbcd86deef71418 .av-image-caption-overlay-center{ color:#ffffff; }

The recent stumble in sectors that had long outperformed (see Momentum Crash Supports Pipeline Sector) coincided with a jump in bond yields. In the first two weeks of September, yields jumped 0.4%. But midstream stocks rallied, since fund flows were dominated by a shift to value and comparative yield spreads mattered little.

We think the attack on Saudi Arabia’s oil infrastructure (see Saturday`s Attack Is A Game Changer) favors U.S. exporters of oil and gas by highlighting the risk of supply disruption out of the Persian Gulf. But putting geopolitics aside, WeWork’s aborted IPO set the negative tone for momentum stocks. Perhaps the correlation that matters is the negative one between unicorns and tangible energy infrastructure.