Climate Extremists Are Losing By Winning

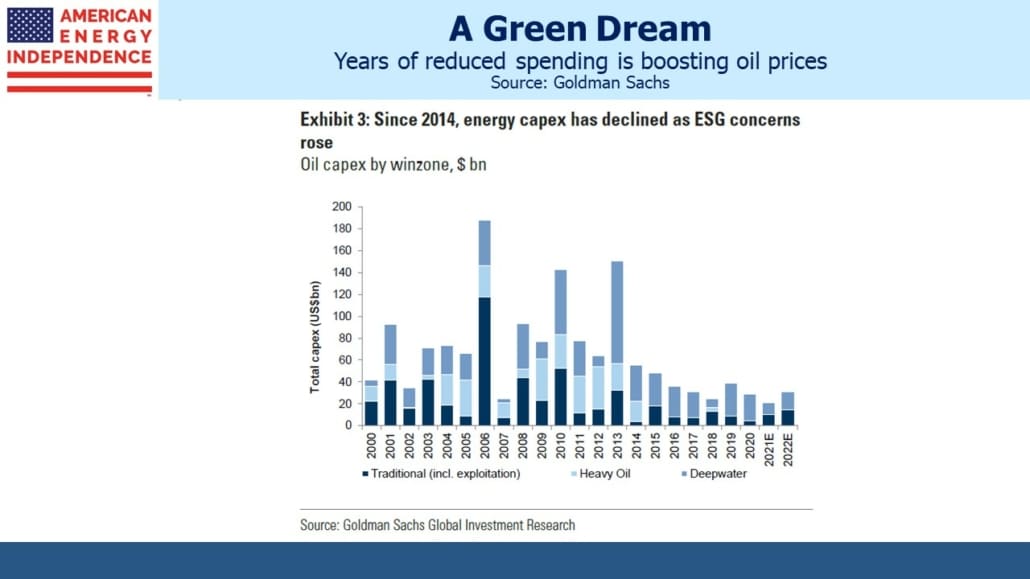
For years environmental extremists have campaigned with increasing success for less investment in fossil fuels. The logic has been that as CO2-emitting sources of energy become harder to access and more expensive, the world would increasingly turn to renewables. Confronting demand for energy has generally been eschewed in favor of targeting suppliers. It’s far easier to demonize a few hundred companies providing the reliable energy that billions of consumers want.

EU governments have been especially keen to increase their reliance on intermittent solar and wind. The combination of reduced supply of fossil fuels and increased use of renewables is the precise result energy policies have been seeking.

.avia-image-container.av-v0mux7-39e243c536da508fcab3e5ac23c07b6e img.avia_image{ box-shadow:none; } .avia-image-container.av-v0mux7-39e243c536da508fcab3e5ac23c07b6e .av-image-caption-overlay-center{ color:#ffffff; }

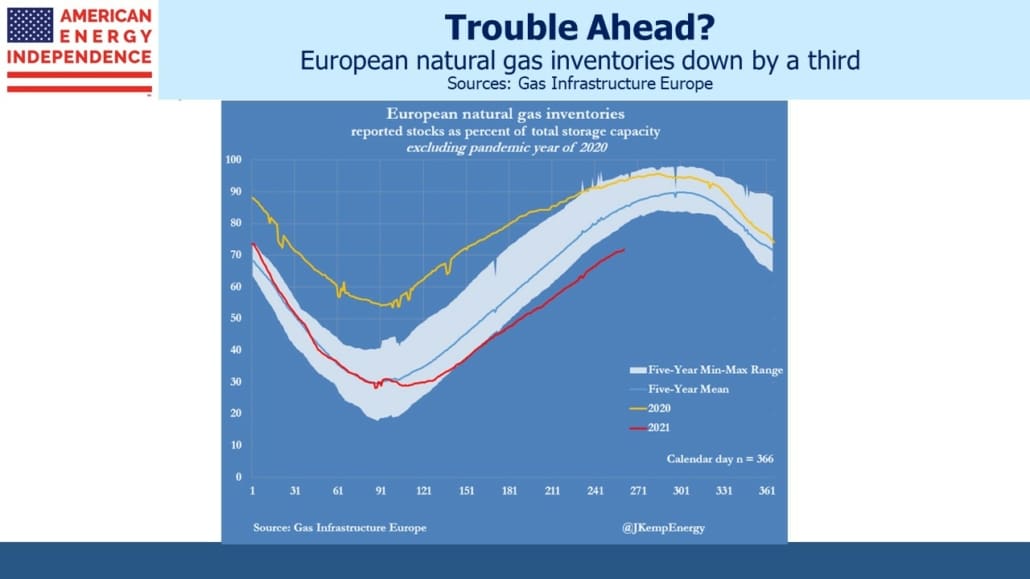
The success of this strategy is now delivering to European customers what should have been expected – sky high electricity prices combined with increased risk of supply interruption.

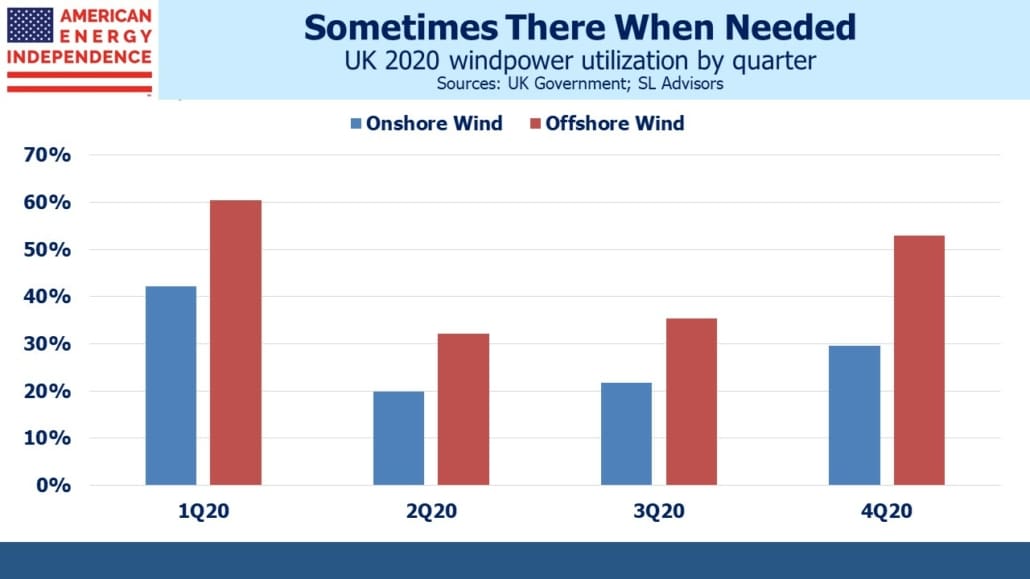
Unusually calm weather in the normally windy North Sea slashed windpower from the UK’s 11,000 turbines by 80%. Deprived of a source that generates more than 20% of its electricity, Britain turned to natural gas and coal (see The Cool North Sea Breeze Lifting US Coal). Europe’s production of natural gas has been in decline for years, even while consumption has been rising. Imports now account for 90% of the EU’s total.

With unfortunate timing, a key undersea electricity cable from France went down because of a fire at a converter station in SE England, giving UK wholesale electricity prices a further boost. Ireland, also coping with uncommonly calm winds, cut power it normally supplies to Scotland.

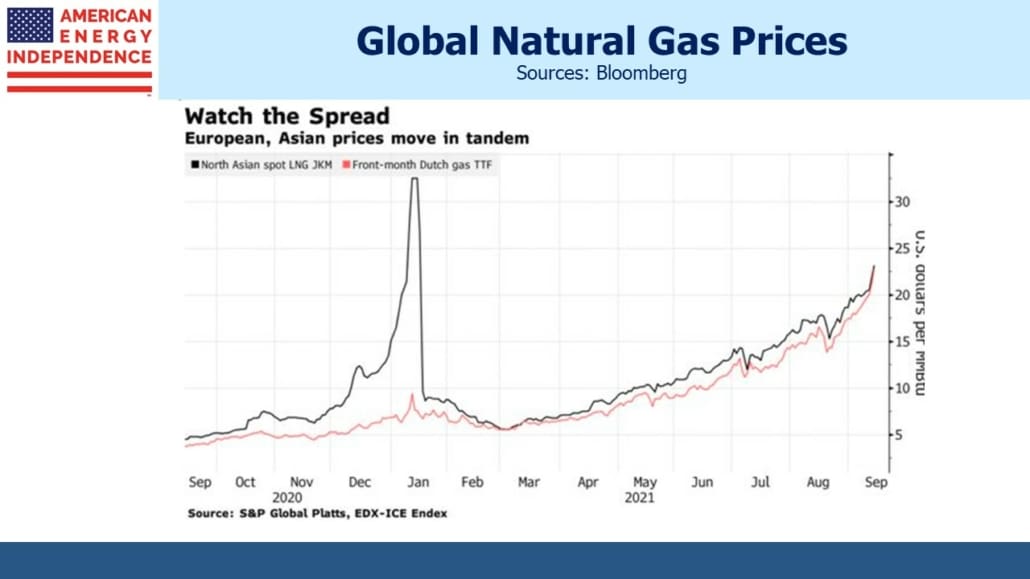
The result has been European natural gas prices four times the US benchmark, and wholesale electricity prices up by 8-10X from a year ago (see The Bull Market in Natural Gas). Europe-bound Liquified Natural Gas (LNG) shipments from the US have in some cases been diverted to Asia where prices are even higher.

Britain has even seen two fertilizer production facilities cease operations indefinitely, because of the high cost of natural gas, a key input. Although grain shortages as a result seem improbable, higher prices are likely.

Achieving the desired mix of increased renewables and reduced availability of natural gas has not generated the popular enthusiasm environmental extremists might have hoped. Consequent double digit increases in household electricity bills have commanded more attention from governments than celebrating progress in the energy transition.

Instead, the focus has been on protecting consumers from the high electricity prices climate change policies have wrought. Italian households have been warned to expect 40% higher electricity bills in the next quarter, following a 10% hike which would have been twice as big but for a €1.2BN subsidy from the Italian government. In Spain the government plans a €2.4BN windfall profits tax on utilities that benefitted from selling electricity pegged to natural gas prices that came from other sources, such as nuclear.

What we’re seeing is a glimpse of the dystopian future climate extremists are trying to foist on us. Their single-minded focus on solar and wind, rejecting every other power source including emission-free nuclear, is behind Europe’s soaring power prices.

Governments are scrambling to limit the damage from policies they believed enjoyed solid support. It’s increasingly clear that polls reflecting voter concern about climate change fail to measure how shallow such support is. Erftstadt in Germany experienced severe flooding earlier this summer, which politicians quickly blamed on climate change. 180 Germans died from the heavy rains. But polls show the Green party, most clearly identified with aggressive policies to combat climate change, garnering only 15-17% of the vote. Improved infrastructure to prevent flooding must seem more sensible than adding windmills.

Cranford, NJ suffered flooding from Hurricane Ida recently (see Climate Change: Prevention or Mitigation?). It’s unclear whether global warming is to blame; Cranford seems to flood every decade or so. I spoke to someone recently whose weekend was spent in the heartbreakingly familiar task of cleaning out a recently flooded basement. But he drew some solace from an expected $200K FEMA disaster relief payment. His family has received FEMA payments in the past, and while I don’t begrudge them the help, such policies hardly encourage moving to higher ground.

President Biden, having failed to persuade OPEC to increase crude oil output (listen to Joe Biden Wants More Oil), is now looking into why gasoline prices at the pump are so high. You’d think he’d use this as justification for the government’s plan to build 500,000 electric vehicle charging stations. Progressive Democrat policies are designed to drive gasoline higher.

European energy policy is turning into a disaster. Well intentioned efforts to lower CO2 emissions are colliding with the physics of relying too heavily on unreliable, weather-dependent energy. Governments and corporations are responding to the shrill protesters who want conventional energy use stopped dead in its tracks. Climate extremists can celebrate Europe’s heavy reliance on a combination of imported and intermittent energy for which they’ve advocated. They should probably celebrate quietly, because the average European household isn’t that enthused about current energy prices.

It’s hard to believe that the solution must be more renewables. Instead, what’s needed are pragmatic policies that value reliable power as much as finding ways to lower emissions. Europe, like California, is showing the rest of us where climate extremists are trying to take us. The US has more diversified sources of energy and hasn’t experienced the kind of price turmoil and unreliability we’re seeing across the Atlantic, except where poor policies such as those in Sacramento are followed.

Chevron CEO Mike Wirth sensibly said the company would rather pay dividends than invest in low-returning solar and wind. His message was that investors should reap the benefits of Chevron producing reliable energy, and if they choose then reinvest those profits in renewables themselves.

Let’s not follow Europe’s lead on energy. More natural gas availability is the obvious solution.


The Cool North Sea Breeze Lifting US Coal

Anyone who’s visited Felixstowe on England’s windy east coast knows that umbrellas enjoy a brief existence in offering protection from the rain. Farther north off the coast of Scotland, the North Sea is one of earth’s most hostile places to drill for oil. Gales are common. Working an oil rig isn’t for the nervous.

Consequently, the North Sea is an obvious location for windfarms. Last year Britain obtained almost a quarter of its electricity from wind, a key element in the country’s drive to reduce CO2 emissions. But even the North Sea isn’t always windy, and a recent period of relative tranquility has caused havoc to European markets for electricity.

.avia-image-container.av-2nbic1y-e7cce3435686aab2e33098e7b155ce6c img.avia_image{ box-shadow:none; } .avia-image-container.av-2nbic1y-e7cce3435686aab2e33098e7b155ce6c .av-image-caption-overlay-center{ color:#ffffff; }

Renewables clearly have their place, but the problem of their intermittency increases with their share of power generation. They’re also non-diversified – ten gas-burning power plants operate independently with downtime at one unlikely to affect the others. But if it’s not sunny or windy, a region’s entire renewables supply can be rendered inoperative. One indicator of a grid overly reliant on unreliable power is sharp spikes in electricity prices.

.avia-image-container.av-2233wh2-cd1414d6ba78c620b372280953205b7b img.avia_image{ box-shadow:none; } .avia-image-container.av-2233wh2-cd1414d6ba78c620b372280953205b7b .av-image-caption-overlay-center{ color:#ffffff; }

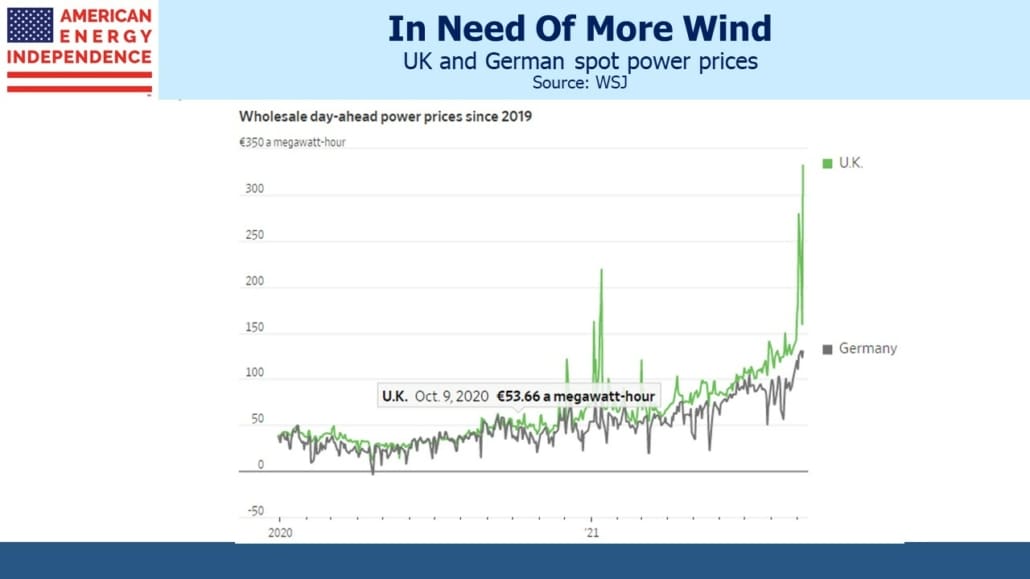
Wholesale electricity prices one day ahead (in effect, the spot market) soared to €331 per Megawatt Hour (MWh) in the UK recently. It’s priced in Euros not Sterling because the UK grid sometimes imports electricity from France or the Netherlands. Britain had to restart gas and coal burning power plants, including one in Nottinghamshire that will be permanently closed by 2024 when the government has committed to phase out coal completely.

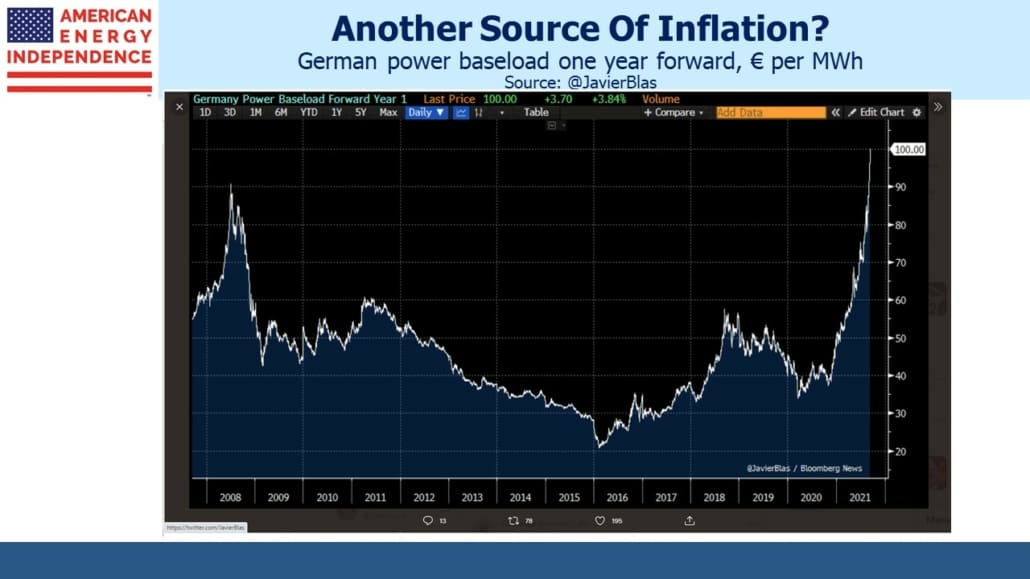
There was a ripple effect into European markets. But there are reasons to think this recent price spike is not just a temporary result of unusually calm North Sea weather. In Germany, one year ahead baseload power prices continued their ascent and reached a new thirteen-year high.

.avia-image-container.av-1sm4ybq-fc3955de84bbf68794272eb7cac9f20e img.avia_image{ box-shadow:none; } .avia-image-container.av-1sm4ybq-fc3955de84bbf68794272eb7cac9f20e .av-image-caption-overlay-center{ color:#ffffff; }

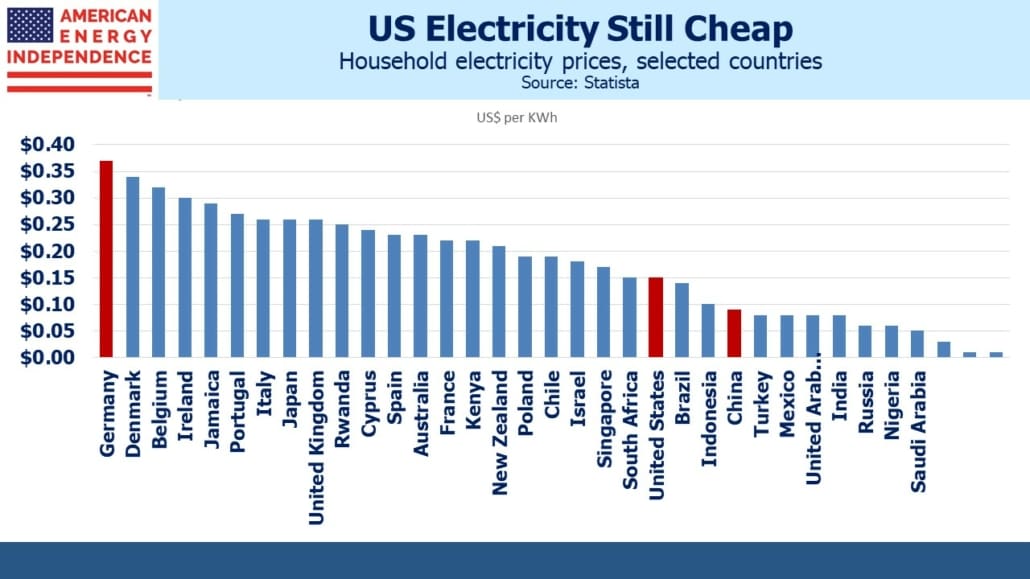
German household electricity prices are already the world’s highest, more than double the US and four times China. There are a couple of lessons here – the first is that western societies will clearly tolerate much higher energy prices than we have in the US. Environmental extremists continue to disingenuously promote renewables as cheaper than conventional power. But the biggest users, such as Germany or California, have the highest prices.

.avia-image-container.av-18v53pi-c800b986d8d42d268a629582b2aec040 img.avia_image{ box-shadow:none; } .avia-image-container.av-18v53pi-c800b986d8d42d268a629582b2aec040 .av-image-caption-overlay-center{ color:#ffffff; }

The second lesson is that it’s implausible for China to wish to emulate OECD countries’ electricity cost structure. Their commitments on emissions reductions aren’t credible. Progressive Democrats seem to think that with solar and wind the US can alter the climate alone and lower prices. Instead, they should be honestly promoting much higher energy prices as easily affordable and worth paying for. They should also be advocating to confront China on its hollow CO2 commitments.

Less wind in Europe has boosted demand for natural gas, including imports of Liquified Natural Gas (LNG) from the US (see The Bull Market in Natural Gas). This has pushed up domestic natural gas prices to such an extent that the US Energy Information Administration expects gas to provide 35% of power generation this year and 34% in 2022, down from 39% last year.

.avia-image-container.av-mb3zqe-46f453d8c0ed2ed09c68e6ed40a2fab9 img.avia_image{ box-shadow:none; } .avia-image-container.av-mb3zqe-46f453d8c0ed2ed09c68e6ed40a2fab9 .av-image-caption-overlay-center{ color:#ffffff; }

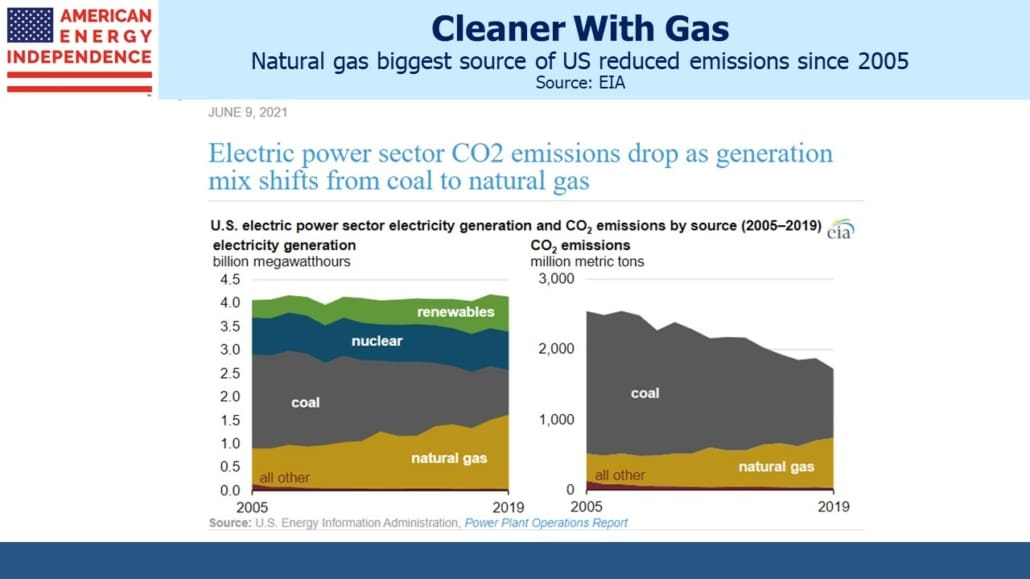
Coal-to-gas switching has been the biggest source of reduced US emissions over the past fifteen years. Although solar panels and windmills get all the attention, actual progress has come about through increased use of natural gas. The Shale Revolution may not have delivered promised investment returns, but the abundant and cheap natural gas that resulted have driven our CO2 emissions down.

This positive development came about through relative pricing — cheap natural gas caused utilities to use more of it versus relatively higher-priced coal. Today’s increased natural gas prices are causing this positive development to reverse. The good news is that the US has enormous supplies of natural gas that can be profitable below $3 per MMBTU, compared with current prices of over $5.

US coal production has been in steady decline for over a decade. Connected global energy markets have created a link between a windless North Sea and increased US coal demand.

OPEC also revised up their forecast for 2022 global crude oil demand, which they now expect to eclipse the 2019 pre-Covid level of 100.3 Million Barrels per Day. It’s more proof that the world will use more of all energy sources in the years to come.


The Bull Market in Natural Gas

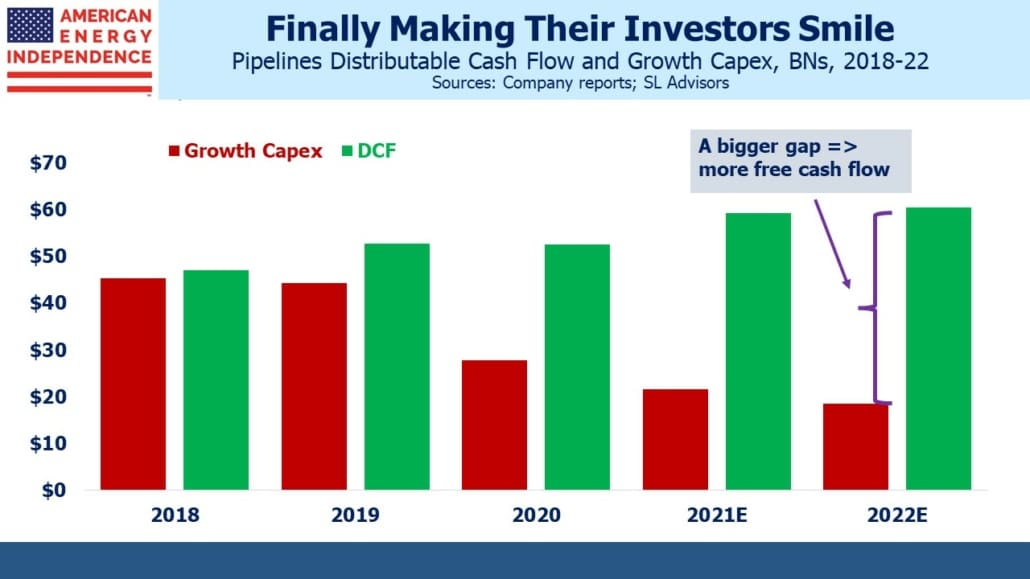
Pipeline company earnings for 2Q21 were satisfyingly unremarkable, and were followed up recently with news of further givebacks to investors. Cheniere Energy implemented a dividend as part of a comprehensive long term capital allocation plan. They also plan to repay $1BN of debt annually as they target an investment grade rating. The company expects to generate $15-17 per share in Distributable Cash Flow DCF over the long run (stock closed on Friday at $88). The dividend had been long expected – Cheniere exemplifies the industry’s improving balance between growth projects and free cash flow as well as any company.

Williams Companies announced a $1.5BN share repurchase program, having previously announced full year results were trending towards the higher end of earlier guidance.

Overall there were no notable 2Q21 earnings misses versus consensus expectations.

.avia-image-container.av-1sjgi3f-574b14f890ed17b07439ee9ab6e5928b img.avia_image{ box-shadow:none; } .avia-image-container.av-1sjgi3f-574b14f890ed17b07439ee9ab6e5928b .av-image-caption-overlay-center{ color:#ffffff; }

Free Cash Flow (FCF) continues to grow. The pipeline sector has undergone a significant change to its cash generation since 2018, when virtually all its DCF was plowed back into new projects. Investors demanded improved financial discipline, but the Covid shock caused further cuts in growth plans. The Democrat administration has also helped, by continuing to make new fossil fuel production unappealing. However, this hasn’t stopped the White House from appealing to OPEC to offset such policies by increasing crude oil supply (see Is Biden Vulnerable At The Gas Pump?).

.avia-image-container.av-1bn5xbv-b2571f7f4b920b84d2de74e7a0aa92f6 img.avia_image{ box-shadow:none; } .avia-image-container.av-1bn5xbv-b2571f7f4b920b84d2de74e7a0aa92f6 .av-image-caption-overlay-center{ color:#ffffff; }


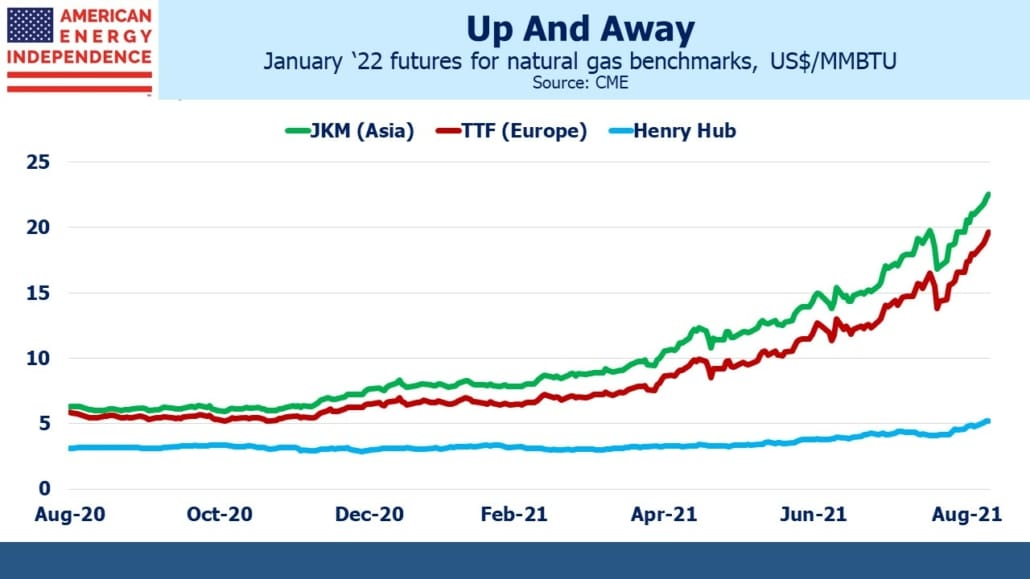
Against this backdrop, natural gas prices have been rising steadily. Last winter saw sharp price spikes for all three benchmarks as the northern hemisphere winter delivered periods of severe cold. Traders are preparing for a repeat. Global supply shortages have been exacerbated in recent months by a drought in Brazil which reduced their output of hydropower. Congestion in the Panama Canal has slowed deliveries of Liquified Natural Gas (LNG) to Asia. This has forced some tankers to sail round the tip of South America, adding to transport costs and limiting supply.

European imports of natural gas from Russia have also been lighter than expected, with official explanations from Gazprom being vague and unconvincing. It’s a safe bet that Europe’s increased reliance on Russian imports via Nordstream 2 will at times in the future look ill-advised. On Friday Russia announced the completion of the controversial pipeline.

If crude oil had more than doubled over the past six months, as natural gas has, financial markets would be intently focused on every daily move. Pipeline stocks would be enjoying a similar bull market, even though oil prices affect sentiment more than cashflows. By contrast, rising natural gas prices really are benefitting the US – enabling Cheniere’s LNG export facilities and Williams’ pipeline network to increase cash returns to shareholders.

The spread between US natural gas versus the Asian and European benchmarks is easily wide enough to cover LNG transportation costs. Deliveries to US LNG export terminals are running at 10.9 Billion Cubic Feet per Day (BCF/D), up from 3.7 BCF/D in the same period last year. Last week 20 LNG tankers left US ports carrying 74 BCF of LNG to foreign customers.

.avia-image-container.av-iwejy3-f9b159bc2af8184b502c08ffe8191083 img.avia_image{ box-shadow:none; } .avia-image-container.av-iwejy3-f9b159bc2af8184b502c08ffe8191083 .av-image-caption-overlay-center{ color:#ffffff; }

Demand is recovering faster than supply. Associated gas output remains flat YTD since oil production from places such as the Permian remains below pre-Covid levels. Dedicated dry gas regions such as the Marcellus and Haynesville are increasing output, but the net result is that domestic prices are being forced up modestly too.

Financial discipline remains strong. Natural gas E&P names covered by Morgan Stanley reached $10BN in FCF for 2Q21, a welcome development after years of negative or flat FCF. These are some of the customers of pipeline companies – upstream as well as midstream is responding to investor demand.

Growing LNG exports are the main driver of increased domestic demand. Production is lagging behind. This led Morgan Stanley to recently ask “Is The Era Of Low Prices Over?” Production is currently running around 93 BCF/D, still below December 2019’s 97 BCF/D just before Covid. Near term risks appear skewed to the upside, especially if the northern hemisphere has a colder than normal winter.

Looking farther ahead, supply is likely to increase, which will bring lower US prices. This is because there still exists ample US supply that can be produced profitably at below $3 per MMBTU. 2-3 BCF/D of increased output looks likely over the next couple of years, much of which will feed our increasing LNG export capacity.

The budget plan making its way through the House of Representatives currently excludes natural gas from its list of “clean” energies eligible for subsidies from the Department of Energy. This is a mistake, since technologies already exist allowing natural gas to be burned cleanly. Carbon capture and sequestration (see Carbon Capture Gains Momentum) and the Allam-Fetvedt Cycle (see Clean Energy Isn’t Just About Renewables) are two examples. Nonetheless, global demand for US natural gas is growing, and puts the domestic pipeline industry in a good position for continued growth.

On a different and more somber topic, it would be remiss of me not to acknowledge the twentieth anniversary of 9/11. Like tens of thousands of people who worked on Wall Street at that time, I am remembering friends killed in that attack. In the first half of my career during the 80s and 90s I traded derivatives with Euro Brokers and government bonds with Cantor Fitzgerald, two firms that suffered substantial loss of life amongst their employees. Everybody remembers their location and what they were doing at that time. Our thoughts are with the families and loved ones of the people who lost their lives on that day.

We have three funds that seek to profit from this environment:

Energy Mutual Fund

Energy ETF

Real Assets Fund


Climate Change: Prevention or Mitigation?

Last week the northeast US suffered 52 deaths as Hurricane Ida (by then a tropical storm) dumped up to ten inches of rain in just a few hours. Cranford, NJ on the Rahway River is prone to flooding. It’s a couple of miles from Westfield, GHQ for SL Advisors, and it seems like every decade or so hundreds of basements are flooded in those homes close to the river. Garwood is another small neighboring town and source of the striking photos below 

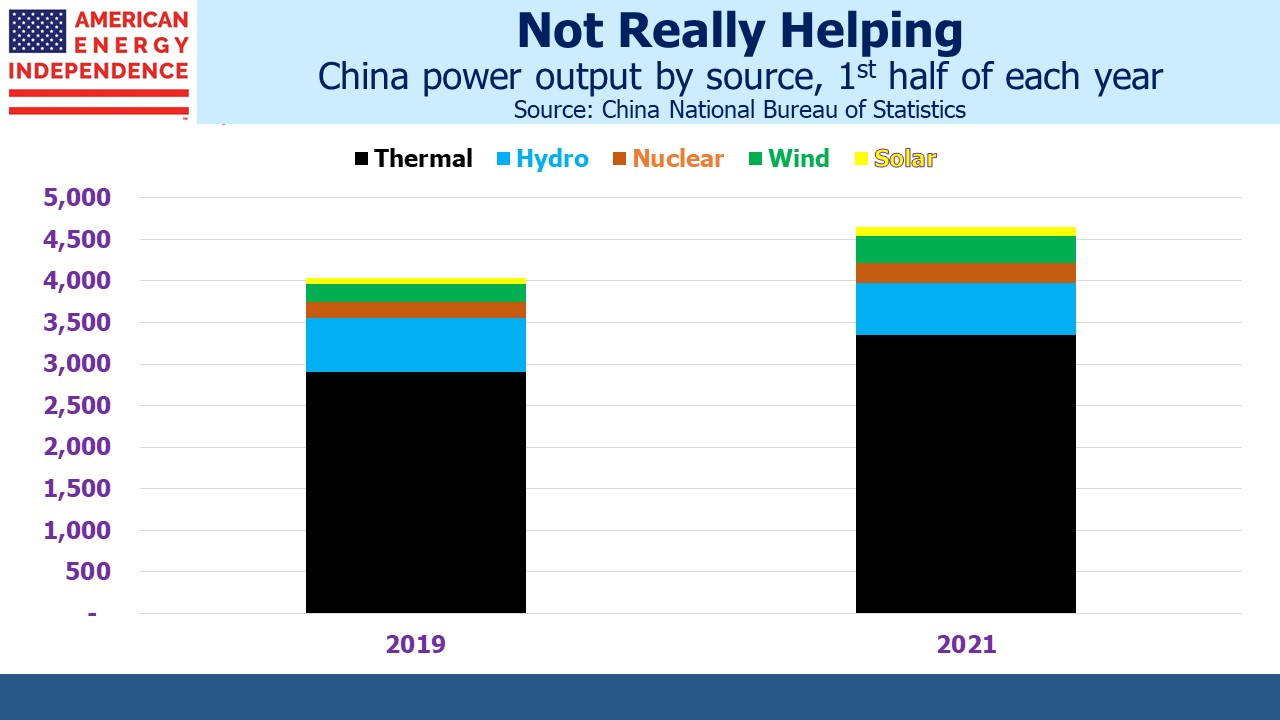
Seemingly unrelated to the heartbreaking losses caused by Ida, journalist John Kemp noted China’s continued reliance on coal for power generation, which has experienced a Compound Annual Growth Rate (CAGR) of 5% over the past two years. Since Covid caused a drop last year, this highlights the strong underlying trend. Coal futures on the Zhengzhou Commodity Exchange recently traded at $150 per tonne, compared with $85 a year ago. The market is signaling more demand for coal.

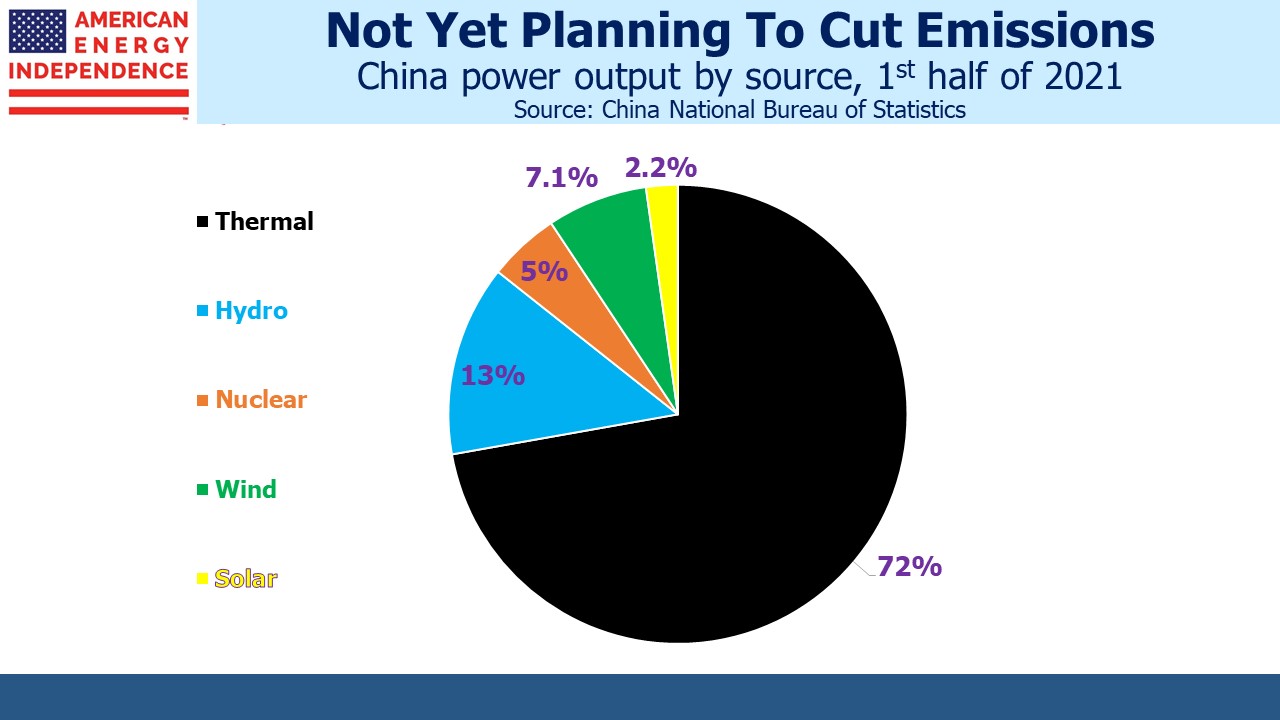
Apologists for China herald the 25% CAGR for wind power over this time, and 24% for solar. Hydro output dropped slightly. Don’t be fooled. Thermal power, which is mostly coal since China burns half the world’s output, still provides 72% of China’s electricity as was the case two years ago. Thermal power also met 72% of the increase in demand, hence its static share of the total.

This is why China generates 28% of global CO2 emissions. It plans to continue increasing at least through 2030 before reversing course on an improbable path to zero by 2060 (see Is China Worried About Global Warming?).

.avia-image-container.av-1jqnr1k-19d48fbeb5bfd060ac9f0383b0594cb2 img.avia_image{ box-shadow:none; } .avia-image-container.av-1jqnr1k-19d48fbeb5bfd060ac9f0383b0594cb2 .av-image-caption-overlay-center{ color:#ffffff; }

Here’s why China’s power output is linked to flooded towns in New Jersey. Ads for solar panels are everywhere, because of generous state and Federal subsidies. As a result, New Jersey electricity customers have so far paid $3BN in higher fees to help pay for solar installations. Future tax breaks for solar are expected to add $800 million annually to utility customers’ bills, rising to $1.4BN by 2030.

Hurricane Ida may or may not be a consequence of climate change. The media interprets every weather fluctuation as caused by global warming. The UN’s report earlier this summer warned of more extreme weather events but attributing any single event to the one degree Celsius increase since the 1850s is impossible.

Nonetheless, if you’re pumping water from your Cranford basement, as you do every decade or so, proliferating subsidized solar panels aren’t much use. Living in a solidly blue state, you’re probably convinced that global warming will cause even more frequent flooding. Having long ago rejected the wholly sensible idea of moving to higher ground, you might like those solar panel subsidies redirected towards improved infrastructure to stop the Rahway River from bursting its banks. Users of the New York City subway would favor mitigation of the sudden indoor waterfalls we saw on news reports and social media.

.avia-image-container.av-ytoua0-a06ff70d5cccd8c2ca21afac8d487fb2 img.avia_image{ box-shadow:none; } .avia-image-container.av-ytoua0-a06ff70d5cccd8c2ca21afac8d487fb2 .av-image-caption-overlay-center{ color:#ffffff; }

The widely reported efforts by rich countries to blanket the landscape with solar panels and windmills aren’t having any noticeable impact on global CO2 emissions. Implementation carries local costs while any benefits are shared globally. Californians can feel good about their efforts to shut down natural gas plants, even though it results in more expensive and less reliable electricity. They still get forest fires. New Yorkers may support constraints on new natural gas connections. The subway still had to shut down because of flooding.

We may already be experiencing the climate changing effects of a warmer planet. If so, at some point there’s a valid choice between prevention and adaptation. None of us can control the planet’s CO2 levels. But every community can fortify itself again extreme weather events. The quest to lower emissions is a global social undertaking that relies on widespread participation. It requires community spirit on a worldwide scale. The free-rider problem is likely fatal to success. China is only the most visible emerging economy exploiting this – the world’s biggest producer of solar panels, which it sells to dozens of countries, is also the #1 consumer of coal and generates over a quarter of global CO2 emissions.

.avia-image-container.av-nd7qdk-2347563628b332f896b03955b4f1d9bd img.avia_image{ box-shadow:none; } .avia-image-container.av-nd7qdk-2347563628b332f896b03955b4f1d9bd .av-image-caption-overlay-center{ color:#ffffff; }

The energy transition has lots of momentum. Shifting from coal to natural gas remains the world’s most assured path to reduced emissions. Nonetheless, China’s increase in wind and solar only met 25% of the additional demand for power since 2019. The desire of rich countries to lower emissions remains in conflict with emerging economies’ intention to raise living standards by using more energy.

This misalignment of interests means that eventually a sea wall will be more useful than a windmill. That time is coming.


A Pause On Spending?

Democrat Senator Joe Manchin from West Virginia holds more sway than most over White House legislative strategy, because he’s one of the few willing to break ranks with Democrat orthodoxy. In his WSJ Op-Ed last week, he argued for a “strategic pause” on Congressional spending. This means his support for the White House’s proposed $3.5TN budget isn’t assured. Manchin sensibly notes that we’re leaving ourselves little fiscal room to deal with future crises, such as a more virulent Covid mutation, terrorist attack or major international conflict. Manchin doesn’t mention Modern Monetary Theory, but it’s safe to assume he’s a skeptic.

Friday’s weak jobs report revealed how investors are regarding the balance of risks. Although it may add a modest delay to the onset of Fed tapering, ten-year yields rose as the yield curve steepened. The payroll data provided some support to FOMC doves, but also strengthens the argument in favor of further fiscal stimulus. Since spiraling indebtedness provokes no discernible economic costs, the threshold for more of the same is falling.

.avia-image-container.av-nwzbnf-64a825f8eafb68e0a7051abdd19c745e img.avia_image{ box-shadow:none; } .avia-image-container.av-nwzbnf-64a825f8eafb68e0a7051abdd19c745e .av-image-caption-overlay-center{ color:#ffffff; }

This is what provoked Bill Gross to refer to bonds as “investment garbage” in an interview last week. He’s right, but his warning that ten-year treasury yields could reach 2% in a year is unlikely to cause much concern. Yields have been too low for over a decade, and at 2% treasuries would still represent return-free risk. Japan ($1.3TN), China ($1TN) and our own US Federal Reserve ($5.7TN) are the three biggest in a long list of non-commercial buyers.

No return-seeking investor should own bonds, but avoiding fixed income with stocks and cash retains a link to interest rates, because low yields continue to show the Equity Risk Premium (ERP) still favors stocks. Factset earnings estimates continue to improve. Forecasts for FY 2021 profits have risen 25% since January. Year-over-year EPS growth for 2022 is 9%.

.avia-image-container.av-1bqbirf-18db58074c2044351d47fa454508b5f5 img.avia_image{ box-shadow:none; } .avia-image-container.av-1bqbirf-18db58074c2044351d47fa454508b5f5 .av-image-caption-overlay-center{ color:#ffffff; }

The ERP average over the past two decades is higher than over the past half century. Using more recent history, stocks are still cheap but not outrageously so. As long as earnings continue growing, the main risk will be interest rates. Even Bill Gross is looking for a <1% increase in yields, an acknowledgment that demand is permanently skewed by central banks and other buyers with inflexible mandates. A 2% ten year treasury yield might be a minor shock if reached quickly but would not move stocks into expensive territory.

The risk of foreign selling has gone, since it’s now clear the Fed would step in to offset a sharp rise in yields. In fact, it’s not a huge leap to consider the circumstances under which the Fed might feel additional bond support was necessary. If ten-year yields rose to, say, 3% the FOMC might assess a potential threat to economic growth and employment. Joe Manchin worries about excessive spending driving inflation, but he doesn’t warn of indebtedness driving interest rates punitively high. Perhaps he’s also concluded that the Fed stands ready, just as MMT advocates.

.avia-image-container.av-lcipej-bd376dada076ac87cc67fd6925b5136b img.avia_image{ box-shadow:none; } .avia-image-container.av-lcipej-bd376dada076ac87cc67fd6925b5136b .av-image-caption-overlay-center{ color:#ffffff; }

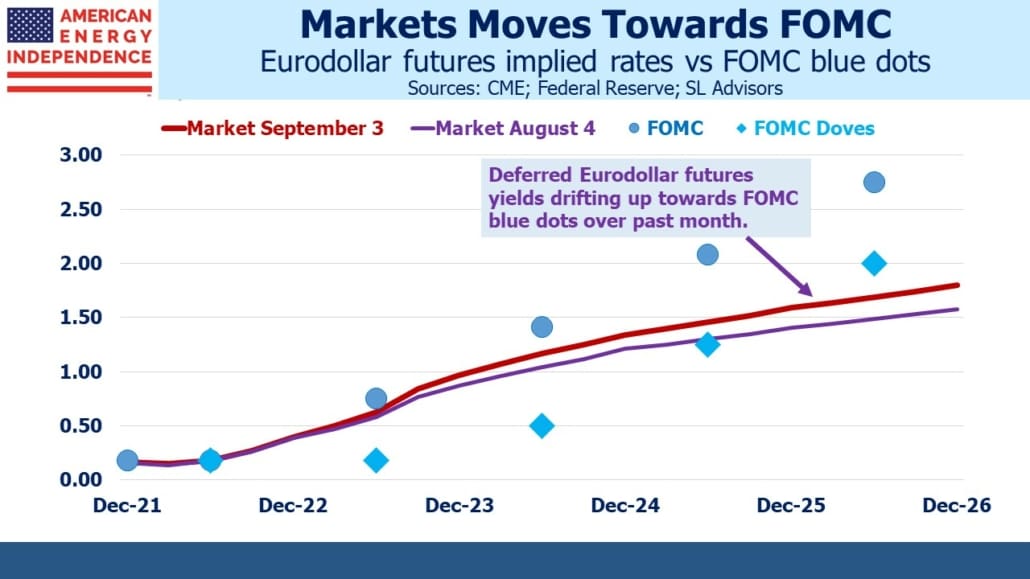
In spite of weaker than expected economic data over the past month, long term yields have drifted higher.  The yield curve is too flat, pricing in just over one tightening per year from 2023-25 versus the FOMC “blue dot” forecast of almost twice that rate. Eurodollar futures moved back towards the FOMC’s rate path but remain more sanguine about future rate hikes than even the FOMC doves.

Coincident with the steeper curve, inflation sensitive sectors such as gold and silver outperformed on Friday. Weak economic data make additional fiscal stimulus more likely.

Russia’s central bank warned that if global inflation isn’t constrained the global economy could, “deteriorate drastically and rapidly.” While not a thought leader, it illustrates that inflation is already a global concern.

Bond yields remain constrained between the threat of more spending and the promise of ongoing central bank support if needed. Earnings remain the key driver of returns, and the picture there is positive. Stocks remain the place to be.

To learn why you should worry about inflation, watch this brief video.


The Fed’s In No Hurry

In Fed chair Jay Powell’s closing speech from the virtual Jackson Hole symposium he went to great pains to illustrate that currently elevated inflation is transitory. He compared the strong rebound in spending on durable goods to above its pre-Covid trend with services spending, which remains 7% below its pre-Covid trend. He noted the unevenness of the recovery from the shortest, sharpest recession in history.

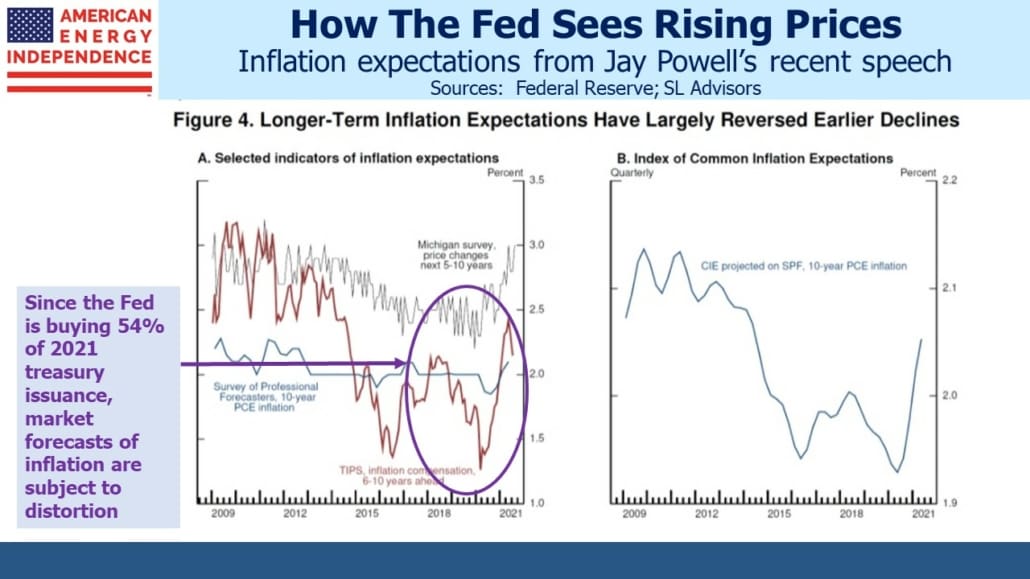
Jay Powell remains convinced that inflation will moderate, and surveys of inflation expectations can be interpreted as supporting this view. Market forecasts of inflation derived from treasury securities have moderated recently. With the Fed is buying over half of new treasury supply, market rates are far from being set freely (see Behind The Fed’s Benign Inflation Outlook).

Since the FOMC believes the bond market is still in need of their support, they must also believe that yields would otherwise be higher. If so, they should draw scant comfort from such inflation expectations, but the Fed nonetheless relies on this circular argument for comfort. The University of Michigan Consumer Survey has not yet shown signs of moderating.

.avia-image-container.av-1l7agwk-f21945705a76415f5c5e7028fd4cfff9 img.avia_image{ box-shadow:none; } .avia-image-container.av-1l7agwk-f21945705a76415f5c5e7028fd4cfff9 .av-image-caption-overlay-center{ color:#ffffff; }

Towards the end of his speech. Chair Powell briefly reviewed the experience from 1950 to the early 1980s, a period that, “taught monetary policymakers not to attempt to offset what are likely to be temporary fluctuations in inflation.”

It’s hard to be sure that anything is permanent until it’s continued for a long time, including higher inflation. This stance is provoking criticism. “The Fed has tied its hands to be quite late to remove monetary-policy accommodation,” says William Dudley, former president of the New York Fed in a recent Economist article.

This is an unfortunate moment for the Fed to be implementing its new doctrine, revised following last year’s Jackson Hole symposium, of being more tolerant of higher inflation and therefore more reactive. History offers policymakers scant insight into how economies emerge from a pandemic.

.avia-image-container.av-17fp8yc-def2ad3af8465b4019df0bb486fd4799 img.avia_image{ box-shadow:none; } .avia-image-container.av-17fp8yc-def2ad3af8465b4019df0bb486fd4799 .av-image-caption-overlay-center{ color:#ffffff; }

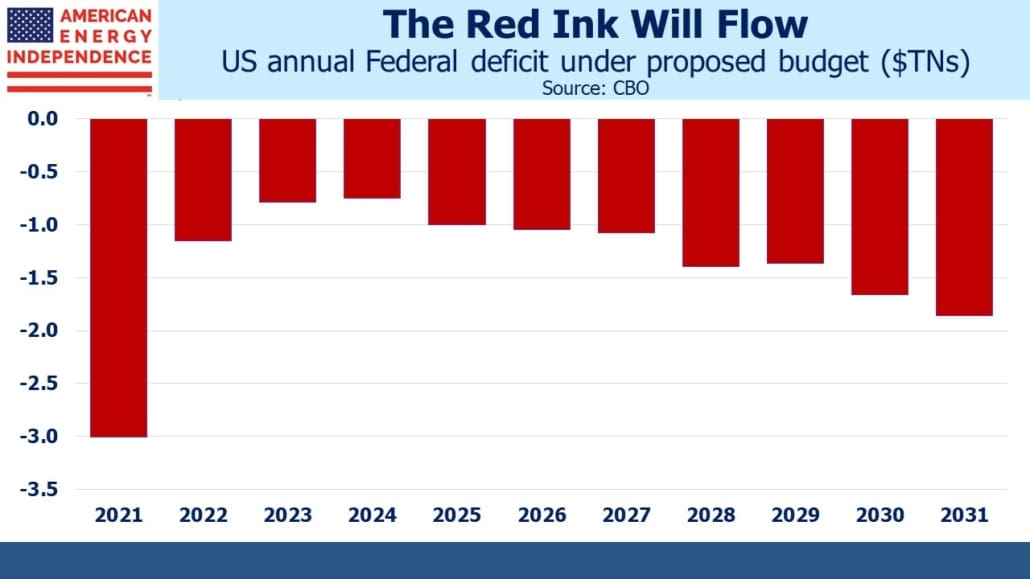
Inflation may conform to the Fed’s benign outlook. If it doesn’t, the cause will be partly traced to Congress. Budget deficits of above $1TN will soon become the norm. While this year we’re on track to hit $3TN before falling sharply, the CBO forecasts deficits will begin increasing again by 2025. The President’s current budget proposal will add $12TN to the deficit over the next decade. This is why the Fed is likely to remain a significant buyer of US treasuries.

A Fed with a more acute sense of risk would use this relentless fiscal stimulus to support a hastier return to more normal monetary conditions. Congress has adopted Modern Monetary Theory (MMT, aka the  Magic Money Tree) philosophy of guilt-free largesse (see Democrats Will Test The Limits On Spending). Continued monetary stimulus leaves little room for error if the Fed’s inflation outlook turns out wrong.

Financial markets are embracing a more dovish Fed by pushing down the yields on eurodollar futures two years out and longer. Oddly, the market still expects one tightening of monetary policy by the end of next year, even while rate forecasts farther out have sunk below even the most Dovish FOMC members’ blue dots.

A reduction of bond buying, even if it begins in September, will likely mean the Fed’s balance sheet will continue to grow at least into 1Q22. In his speech last week, Powell said that, “…we will continue to hold the target range for the federal funds rate at its current level until the economy reaches conditions consistent with maximum employment…” He also noted that, “In the United States, unemployment ran below 4 percent for about two years before the pandemic, while inflation ran at or below 2 percent. Wages did move up across the income spectrum.”

From these statements it’s clear the Fed won’t raise rates until the unemployment rate is solidly below 4%. It’s likely they will await evidence of wage inflation before concluding full employment has been reached.

Everything about this FOMC argues for sloth-like policy normalization combined with a high roller’s embrace of substantial risk of a policy error. This is all to ensure that everyone who wants a job has one. Among the papers distributed to Jackson Hole attendees was Monetary Policy in Times of Structural Reallocation. Powell has argued that inflation has been caused by disruption of supply chains induced by Covid. The inference is that some corporations will need to restructure their logistics to accommodate a new world where lockdowns can occur with little notice. Once done, price hikes due to supply disruptions should dissipate.

The paper posits that higher inflation allows greater variation in real wages, which can hasten such restructuring. Since wages rarely shrink in nominal terms, higher inflation can accelerate the movement of workers to more logistically-efficient jobs. Inflation and wage hikes of 5% in growing sectors combined with low or zero nominal wage growth in shrinking ones would quickly widen real wage differentials, motivating workers to switch jobs accordingly. Higher inflation allows for a bigger drop in real incomes – getting a 1% raise with 5% inflation is a 4% cut in real wages, something not easily achieved with, say, 2% inflation.

Jay Powell didn’t broach the topic, but a dovish, risk-tolerant Fed focused on its employment mandate might find elements to like in such an approach.

.avia-image-container.av-r9fbbo-42342edae239b6dca65b3df70ec8081d img.avia_image{ box-shadow:none; } .avia-image-container.av-r9fbbo-42342edae239b6dca65b3df70ec8081d .av-image-caption-overlay-center{ color:#ffffff; }

There seems little reason for interest rate futures to plot a different course than the FOMC’s own dot plot – the odds of monetary tightening next year are receding. Circumstances may evolve to compel the Fed to “… respond and use our tools to assure that inflation runs at levels that are consistent with our goal.” If so, rates will eventually need to move higher than is currently priced in. That remains some way off.

To learn why you should worry about inflation, watch this brief video.

We have three funds that seek to profit from this environment:

Energy Mutual Fund

Energy ETF

Real Assets Fund


The Fed’s Balance Sheet Has One Way To Go

This week the Fed is holding their annual Jackson Hole symposium – although it will be virtual again because of the Delta variant. Media coverage has built expectations of a sharp internal debate around tapering. The recent minutes show some in favor of reducing the Fed’s bond buying program this year. Boston Fed president Eric Rosengren noted the futility of using low rates to stimulate interest rate sensitive sectors such as housing when demand is already strong (listen to our recent podcast Episode 80: Tapering Draws Closer).

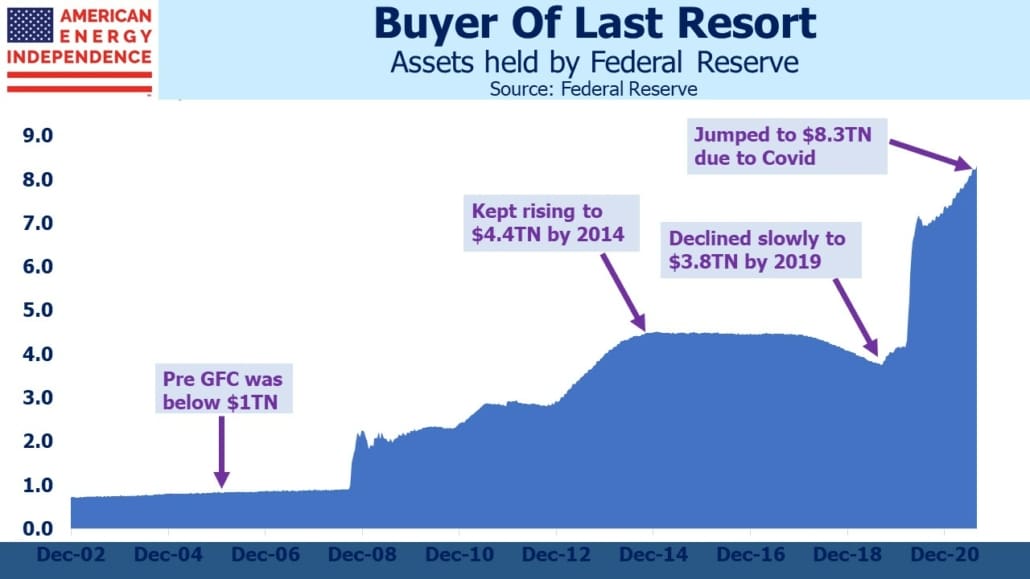
Since former Fed chair Ben Bernanke showed the world in 2008 that Quantitative Easing (QE) could be done safely, the Fed has been a buyer of US treasuries almost all the time. Their balance sheet only shrunk for a year beginning in May 2018 and began growing sharply again early last year in response to Covid.

Bernanke’s original initiation of QE was criticized at the time as likely to cause inflation. He was correct that it wouldn’t, recognizing that Wall Street’s frozen plumbing needed extraordinary help. Once the crisis passed the FOMC struggled to extricate itself from the bond buying program. The 2013 “taper tantrum” when bonds slumped on fears of QE ending continues to hover over today’s FOMC deliberations.

.avia-image-container.av-zwg5qa-56be41e17b455aec2b0b0a318b4fc013 img.avia_image{ box-shadow:none; } .avia-image-container.av-zwg5qa-56be41e17b455aec2b0b0a318b4fc013 .av-image-caption-overlay-center{ color:#ffffff; }

It should be clear that the need for QE is long gone – not least because this time around inflation has surged. Most obviously the $40BN per month of mortgage-backed securities purchases should cease since the housing market is hardly short of demand.

Even when tapering begins it will only slow the Fed’s balance sheet growth, since they’ll still be buying bonds albeit at a slower rate. QE is now part of the Fed’s toolkit, to be used whenever accommodative policy is needed. A decade passed since the 2008-09 Great Financial Crisis before any meaningful reduction in the Fed’s balance sheet occurred.

The Fed’s original exit strategy was to let holdings mature and not replace them. This time around their holdings will likely flatten out around $9TN, 2X the peak from the earlier crisis. It’s hard to imagine the Fed moving to actually sell bonds, so allowing the portfolio to run off remains the most likely outcome, as before.

It’s a good bet that the next crisis will hit before any meaningful reduction in this $9TN balance sheet. The bar has been lowered. QE is being justified in part to promote job creation, part of the Fed’s twin mandate of achieving full employment with stable prices. If a bear market in bonds threatened the economy, it’s likely the Fed would see fit to step in and assure an orderly market. If our foreign creditors sold US treasuries, either for geopolitical reasons or out of frustration with our profligate fiscal policy, the Fed would scoop those up too.

The Fed is now and probably always will be the biggest buyer of US government debt. Their $8.3TN balance sheet includes $5.3TN of US treasuries, almost a quarter of all publicly held US debt. The Fed’s now permanent holding of US treasuries is debt monetization. Only three quarters of the government’s borrowing is being met by a combination of domestic and foreign savings. QE was originally intended as a temporary measure in extraordinary times, but it’s become business as usual. The Fed is enabling The Magic Money Tree (see Modern Monetary Theory Goes Mainstream).

Rep. Alexandria Ocasio-Cortez, a fan of government solutions for everything, said in 2019 that MMT needed to be, “a larger part of our conversation.” AOC and her progressive wing of the Democrats are not on the side of investors.

.avia-image-container.av-i73mn6-74f67354421ebf031fc8861bf7d00021 img.avia_image{ box-shadow:none; } .avia-image-container.av-i73mn6-74f67354421ebf031fc8861bf7d00021 .av-image-caption-overlay-center{ color:#ffffff; }

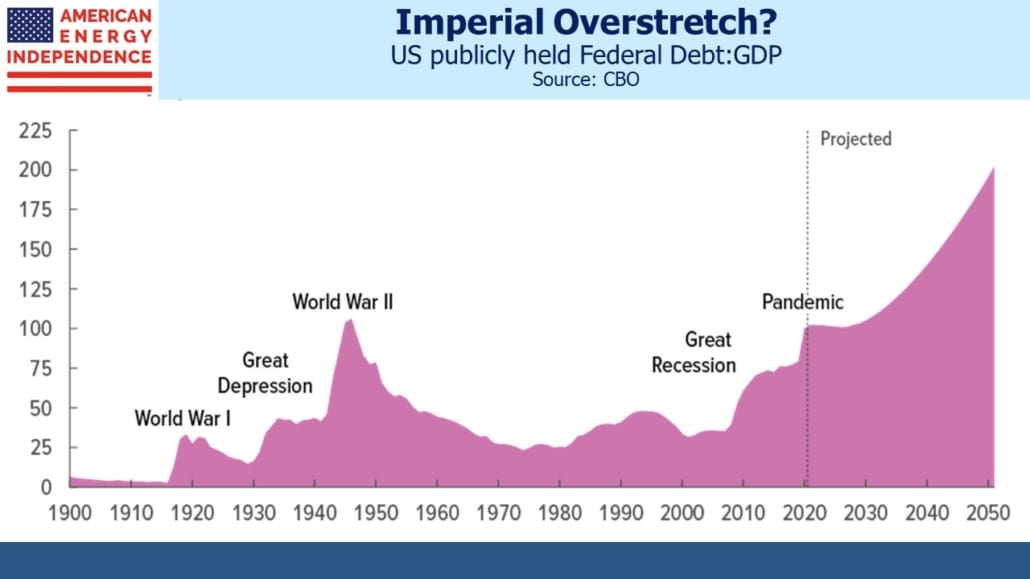
Our fiscal path virtually guarantees continued growth in the Fed’s balance sheet. Publicly held debt:GDP crossed 100% because of Covid and is on track to double over the next thirty years. This is based on figures from the non-partisan Congressional Budget Office, which doesn’t assume recent uber-profligacy will become endemic. It’s hard to see how The Fed will reduce its holdings when the CBO expects debt to increase annually at $1TN or more for the next thirty years.

This is why inflation is inevitable. QE has morphed into debt monetization, enabling ever larger deficits even while our fiscal outlook is poised to soar beyond past extremes. Bonds have been emasculated of their ability to warn of such excess, because the Fed stands ready to provide support whenever needed.

It’s never been more important to invest with regard to maintaining purchasing power – which means staying well ahead of inflation (see Why It’s No Longer Enough To Beat Inflation).

We are invested in all the components of the American Energy Independence Index via the ETF that seeks to track its performance.

We have three funds that seek to profit from this environment:

Energy Mutual Fund

Energy ETF

Real Assets Fund


Futures Still Disbelieving The Fed

Memories of the 2013 “Taper Tantrum” loom over today’s FOMC as they engineer an exit that will hopefully be more elegant than our current one from Afghanistan. Both were well overdue, although there is no doubt the military withdrawal was handled disastrously. Can the Fed do better?

Unlike the Afghan army, the bond market has reacted well to the approaching loss of US government support. Treasury yields even dropped modestly on the week, with the ten-year still around 1.25%, 0.50% below its high in late March.

Real yields have stayed below –1.0%, with implied ten-year inflation (nominal yields less TIPs) of 2.3%. Since the Fed’s bond buying will be over within 6-9 months, today’s yields must reflect close to an equilibrium level for a bond market operating without the crutch of partial debt monetization.

Persistently low long-term interest rates remains one of the most important drivers of valuations. Japan holds $1.3TN in US treasury securities, and China over $1TN. These and other holders are clearly not seeking generous returns. Moreover, the specter of foreign investors dumping bonds and causing a recession has gone. Our second stint of Quantitative Easing (QE) shows that the Fed is a fully capable buyer of last resort. China’s position would sit comfortable alongside the other $8TN on the Fed’s balance sheet. Whatever risk premium bond yields once offered against such a possibility has evaporated.

The bond market’s positive response to tapering is more accurately a reflection of concern over the Delta virus. Cyclical stocks have been under pressure since mid-June, and on Thursday the S&P Energy ETF (XLE) dipped below the 200-day moving average. There are signs that Covid is flattering the bond market’s apparent equanimity over tapering. Nonetheless, the Fed stepping back when there’s clearly ample demand for bonds represents a more elegant exit than waiting until yields had risen to, say, 2%.

.avia-image-container.av-j5r21n-1583ca274f97e2360dbf38f0a6bc47c0 img.avia_image{ box-shadow:none; } .avia-image-container.av-j5r21n-1583ca274f97e2360dbf38f0a6bc47c0 .av-image-caption-overlay-center{ color:#ffffff; }

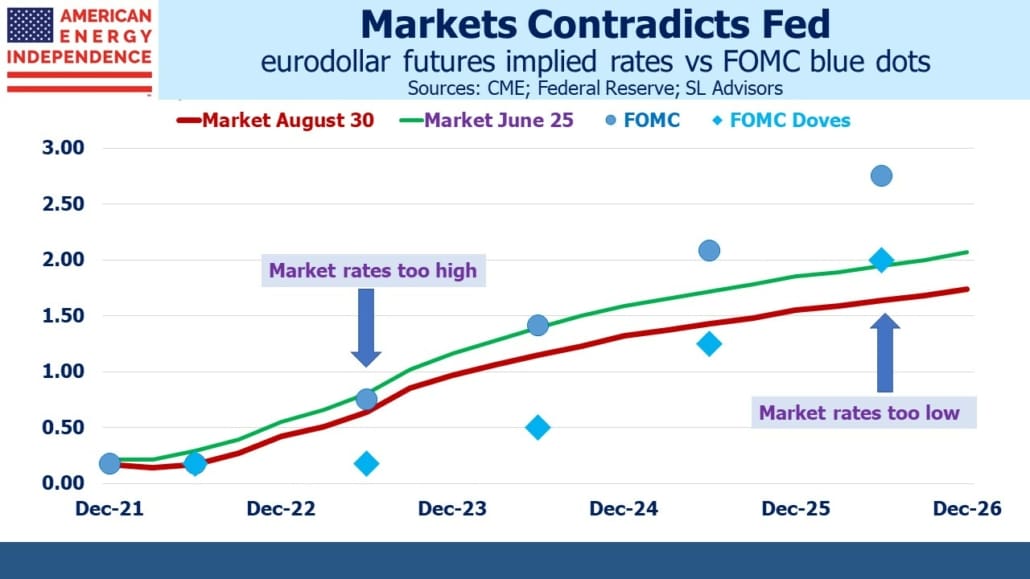
The eurodollar yield curve has flattened over the past couple of months as bond yields have drifted lower. Market interest rate forecasts are now solidly below those of the FOMC. Five years out, even the most dovish of the “blue dots” that indicate individual FOMC members’ rate forecasts is almost 0.40% above the market. Although bond investors have pushed yields lower in response to rising hospitalizations from the Delta virus, it’s unlikely FOMC members’ rate forecasts have altered much two to five years out. And the market is still forecasting around one tightening per year from 2023, about half the pace of FOMC members.

Given their explicitly reactive posture, it’s quite likely that the FOMC will be slow to normalize rates. Chair Powell never misses an opportunity to remind us that achieving full employment, which means an unemployment rate at least as low as the January 2020 pre-Covid level of 3.8%, is their objective. It’s likely that the FOMC will rely on emerging wage inflation as confirmation we’ve reached full employment. So they’ll be playing catch-up, which is why the current flatness of the eurodollar curve seems incorrect. Put another way, with the market priced for two tightenings during 2024-25, we think three is more likely than one, and four a decent possibility.

Interest rate futures reflect a slow pace of easing at odds with FOMC forecasts and past history. Given that a philosophy of unlimited spending now drives fiscal policy (see Modern Monetary Theory Goes Mainstream), if the lethargic pace of tightenings turns out to be accurate, there wil be ever greater calls for additional fiscal stimulus to boost economic growth.

It began with the Greenspan put, and successive Fed chairs have been awarded the same moniker. Add to that the Biden put. At the first sign of economic weakness the call will go out for more spending, which remains virtually costless. With debt funded at negative real rates, it almost seems irresponsible to not take advantage of the opportunity.

In 2008 Ben Bernanke revealed the limitless balance sheet capacity of the Federal Reserve, which has moved from $2TN to $8TN since then with no discernible disadvantage to the US economy. Covid-induced fiscal stimulus ushered in Modern Monetary Theory (MMT) as mainstream policy, exploiting a country’s unlimited ability to borrow in its own currency.

Now that Congress has discovered the Magic Money Tree (i.e. MMT), the conditions that justify super-stimulus will become steadily relaxed, just as the use of QE will transition from an extraordinary measure to business as usual.

It’s against that context that the forecasts embedded in the interest rate futures market must be judged.

We are invested in all the components of the American Energy Independence Index via the ETF that seeks to track its performance.


US Explores The Limits On Spending

Paul Kennedy’s The Rise and Fall of the Great Powers coined the term “imperial overstretch”. Throughout history, the decline of every great power has coincided with military commitments beyond its means. Such cycles last many decades, and Kennedy’s 1987 book speculated that Japan was the new rising power about to overtake America. That call was spectacularly wrong, but the underlying principles remain valid. After twenty years, almost a $1TN and over 2,300 US military lives lost in Afghanistan, we have little to show for it. America’s humiliating exit from Kabul is not how superpowers conclude military expeditions.

Simple math shows that US military dominance will slowly give way to a multi-power world. War is expensive, and economic size drives success. US share of global GDP has declined from 40% in 1960 to 24% today, as emerging economies such as China have made strides.

.avia-image-container.av-z7mds9-c3efa16e3b0ded7fc575221a15a87c16 img.avia_image{ box-shadow:none; } .avia-image-container.av-z7mds9-c3efa16e3b0ded7fc575221a15a87c16 .av-image-caption-overlay-center{ color:#ffffff; }

Historically, great powers have begun to decline when they continued to assume obligations inconsistent with their capacity to meet them. Such decisions aren’t inevitable, and the arc of history is long. America remains a great country. But it’s useful to consider episodes such as our recent withdrawal from Afghanistan against our growing debt, set to test all notions of sustainability.

America’s debt:GDP is projected to double in the next three decades, according to the non-partisan Congressional Budget Office (CBO). This assumes no new pandemic and no wars, both significant sources of past unplanned spending.

It’s likely we will not acknowledge whatever constraints on our spending this projection should imply. Long term interest rates remain low, helped by the Fed’s monetization of around half of all newly issued Federal debt (see Behind The Fed’s Benign Inflation Outlook).

Modern Monetary Theory (MMT) is the great enabler (see Reviewing The Deficit Myth, Stephanie Kelton’s book on the subject). It teaches that the only constraint on a government’s ability to borrow and spend in its own currency is inflation. Since the Federal government can always issue bonds to the Federal Reserve with its unlimited ability to create the funds to buy them, we always have a buyer of last resort. If government spending goes beyond the economy’s ability to deliver the goods and services offered, thereby driving up prices, inflation results. This is the only practical constraint on the budget deficit.

.avia-image-container.av-lgoqll-cb832a8b49a2ef93501c9844be185163 img.avia_image{ box-shadow:none; } .avia-image-container.av-lgoqll-cb832a8b49a2ef93501c9844be185163 .av-image-caption-overlay-center{ color:#ffffff; }

Forget about our foreign creditors’ willingness to finance our borrowing. The threat of Japan, or in recent years China, dumping US bonds and causing a recession through sharply higher rates has been periodically raised. It hasn’t happened, and likely won’t. They couldn’t sell $1TN in bonds, and if they tried the Fed would undoubtedly step in to manage the process. Ben Bernanke opened the Pandora’s Box of a greatly expanded Fed balance sheet during the 2008 Great Financial Crisis. Having discovered its power, we will steadily increase the set of circumstances that justify such largesse. The bar will be lowered, because it’s apparently costless to do so.

This is why inflation is likely, because there is no other force limiting our ability to borrow. Today’s deficit hawks have lost influence because their message doesn’t resonate. That’s because it doesn’t fit the facts. Their predictions of fiscal disaster make climate change forecasts look astute. The world is 1°C warmer than pre-industrial times if not obviously much worse for it. By contrast, record low bond yields suggest record indebtedness is harmless.

This serves to further increase the government’s perceived ability to borrow, because both the Administration and the Fed assess the current uptick in inflation to be temporary. It may be so, which will show that borrowing hasn’t yet become ruinous. Therefore, more will follow.

Inflation isn’t correctly measured anyway. Statisticians insist on ignoring the rising cost of home ownership even though two thirds of American families choose to obtain shelter that way (see Why It’s No Longer Enough To Beat Inflation). $40BN a month in MBS purchases during a very hot housing market is finally making some FOMC members uncomfortable. Boston Fed president Eric Rosengren recently said, “If you can’t get housing materials and you can’t get construction workers to come back on site, but we do increase demand for housing, then it doesn’t do much for our employment mandate—but it does increase housing prices more than it otherwise would.”

MMT has quietly become mainstream fiscal orthodoxy. Even proponent and author Stephanie Kelton advocated for a CBO-type scoring of the inflationary impact of spending plans. Instead, we are looking at a $3.5TN budget to be passed via reconciliation with no formal consideration of the possible inflationary consequences. If it doesn’t cause the economy to overheat, such budgetary largesse will become business as usual. Inflation is eventually assured.

We are invested in all the components of the American Energy Independence Index via the ETF that seeks to track its performance.


Why It’s No Longer Enough To Beat Inflation

The most recent CPI report was a little better than expected – all-items less food and energy was up 4.3% year-on-year. Used car prices had boosted prior inflation figures but were up just 0.2% in July. Owners’ Equivalent Rent (OER), the statistician’s’ quixotic means of measuring what it costs to attain shelter through home ownership, rose just 0.29% in July. It’s up 2.1% over the past year, compared with the Case Shiller National Home Price index which is +16.6% through May (most recent available).

CPI is important because it’s used to make cost of living adjustments to social security and other government transfer payments. It’s part of the return on inflation—linked bonds and is often used in long-term commercial contracts to make price adjustments. But it’s becoming less relevant as target against which to grow your income. Investing is all about retaining purchasing power for the future. Most interpret this as being able to afford in ten years what you could buy today. It turns out that’s CPI is inadequate for this.

Because incomes grow faster than inflation, if your income fails to keep up with the median, you’ll be relatively poorer. Savers don’t just want to maintain today’s absolute purchasing power – they want to keep the same relative consumption as their peers. If you enjoy the median income today, growing it at CPI means falling below the median, and won’t feel like much fun. Average income has been dragged above the median by “the 1%”, or the increasing income inequality we often read about. So using the median provides a more representative figure for the typical family.

.avia-image-container.av-1fo99bt-b23c24d62892af10e22c956e2a610b01 img.avia_image{ box-shadow:none; } .avia-image-container.av-1fo99bt-b23c24d62892af10e22c956e2a610b01 .av-image-caption-overlay-center{ color:#ffffff; }

Whenever a writer quotes a price for something decades ago and converts it into “today’s dollars”, he’s using the CPI inflation rate. This understates the effective cost, because it fails to account for the fact that incomes have been rising after inflation. It doesn’t fully capture the chunk of income it cost the median household. For example, a new car in 1953 cost $1,850, which is $17,531 today after adjusting for CPI inflation.

You won’t get much new car for that today – Kelley’s Blue Book reports the average new car costs just over $40K. This is not much different than $37,511, the 1953 price adjusted by income growth. In other words, the average new car cost 44% of the median household’s income in 1953, and it’s 47% today. In relative terms, cars have kept track with incomes, not inflation. Milk and most groceries are much cheaper. Food commands less of a household budget than in the past. Color TVs are dramatically cheaper because they were only just being produced in the early 1950s.

.avia-image-container.av-ef2jd-8cffd83856386ce8a6801205fb292715 img.avia_image{ box-shadow:none; } .avia-image-container.av-ef2jd-8cffd83856386ce8a6801205fb292715 .av-image-caption-overlay-center{ color:#ffffff; }

Electronic goods such as TVs have long experienced deflation, because as their quality has improved the Bureau of Labor Statistics (BLS) converts this into a price drop. The CPI measures a basket of goods and services of constant utility, and a better TV at the same price is like a price cut. They try to adjust for the countless quality improvements that market economies deliver. The problem is that this kind of price cut doesn’t free up any cash to buy anything else. The BLS regards TVs as having fallen in price, even if the actual cost hasn’t.

Most products become better over time, and government statisticians expend much effort converting those improvements into imputed price cuts that don’t make you richer even if they add utility. It’s another example of the inflation statistics being theoretically correct and increasingly out of touch with people’s lives.

The average new home costs a little over 4X median household income, not much different than in 1953 although this is twice as much as if houses had simply risen with CPI inflation.

.avia-image-container.av-rf9d09-de1d4e307fabaa338368e00d16d58d9b img.avia_image{ box-shadow:none; } .avia-image-container.av-rf9d09-de1d4e307fabaa338368e00d16d58d9b .av-image-caption-overlay-center{ color:#ffffff; }

The Financial Times ran an article last week (see Why central bankers keep their cool over rising house prices) which found that separating out the value of shelter that home ownership provides is widely accepted by economists. The US isn’t alone in using a non-cash theoretical input for housing in its inflation statistics.

The article goes on to note that central bankers don’t worry about housing inflation because it rarely shows up in OER and its foreign equivalents. It’s a circular argument – OER is low because it’s not measuring the cash cost of home ownership, and therefore appears well behaved.

Median family incomes have always grown faster than inflation, but that gap has widened in recent years. Over the past decade, incomes grew twice as fast as inflation. This is mostly good news, because higher real incomes mean higher living standards. It’s bad news only for those whose incomes are tied to inflation since they’re slipping behind their peers at a faster rate than before.

The inflation statistics remain important for financial markets and those whose incomes are linked to it, but are steadily losing relevance for anyone who’s saving for the future.

We are invested in all the components of the American Energy Independence Index via the ETF that seeks to track its performance.