
Sprinkle Some S&P500 In Your Midstream Portfolio


/
I was chatting with a long-time investor the other day. He told me that he couldn’t afford to withdraw any of his investment with us. The capital gains tax would be prohibitive, he went on to explain. We both chuckled at this high-class problem. I told him that creating such golden handcuffs is part of our business model.
It’s easy to see how this situation arose. The five-year annual return through June on the American Energy Infrastructure Index (AEITR) is 21.0%, easily beating the S&P500 at 12.9%. The ten-year AEITR is 13.4%, modestly behind the S&P500 at 15.1% over a period that includes the pandemic-induced swoon in the energy sector.

Moreover, the increasingly tech-heavy S&P500 looks more like a growth index, dominated as it is by hyperscalers spending hundreds of $BNs on data centers. Factset reports a 2Q blended earnings growth rate of 50.4%, double what was expected as recently as June 30th. 2027 earnings are expected to be +13% based on bottom-up forecasts. Talk of a bubble has moderated in response to such strong profit growth.
But it’s still a question for investors to ponder. The Shiller P/E Ratio, which uses ten-year trailing inflation-adjusted earnings, is at 42.39 just shy of its dot-com peak of 44.19, reached in November 1999. The strong profitability is driven by spending on AI. One company’s capex is another’s revenue.
The midstream sector has different sensitivities than the overall market. Although there’s a robust AI growth story related to natural gas demand for power, near term cash flow generation remains the dominant metric that investors use. The AEITR has matched the S&P’s direction on only 38 of the past 60 months. The correlation is 0.34.
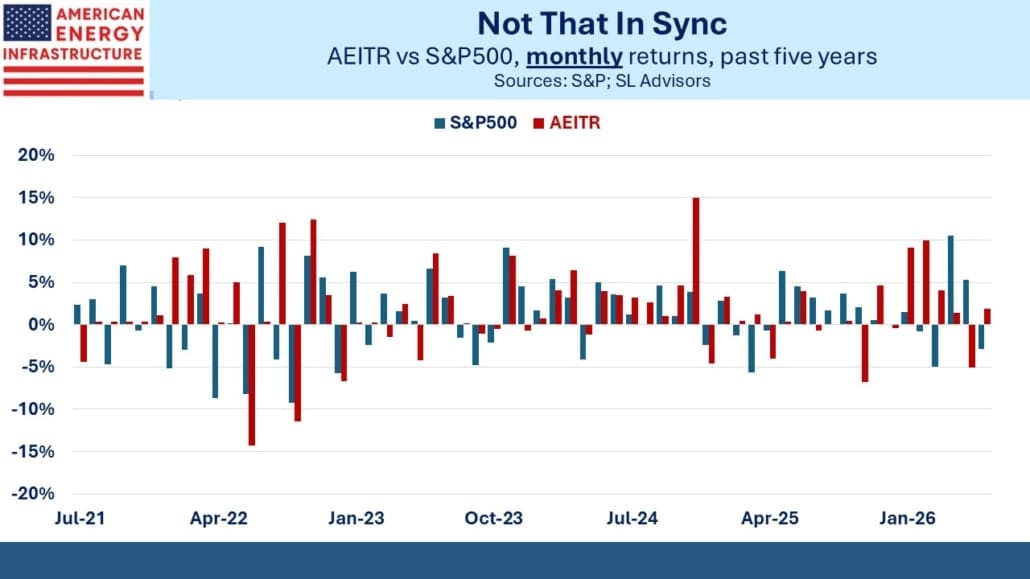
The quarterly data shows the complementarity of returns even more dramatically, with only 11 of the past 20 quarters’ returns having the same direction. The correlation is -.02. The rolling four quarter trailing return has been negative only once, in 1Q23 (-3.5%) compared to three for the S&P500 (1Q22-3Q22). A bad stock market has been worse than a bad run in midstream.
More recently, midstream was +24.7% in 1Q while the S&P500 was –4.3%. It’s worth noting that through February, just before we attacked Iran, the AEITR was +19.9%. The continued failure to reopen the Strait of Hormuz to shipping has been a big positive for US energy exports, but so far most of this year’s midstream return predates hostilities. In the 2Q the AEITR was –2.0% while the S&P500 was +13.0%. Both make money over longer periods, but conveniently their best times are often different.

This low correlation was most beneficial to investors in 2022 when inflation soared following the Biden administration’s profligacy in response to the pandemic. Midstream was +21% that year while the S&P500 was –18%.
Inflation has been 1% or more above the FOMC’s stated 2% target for the past five years. Whatever the Fed may intend, investors should assume higher than 2% in the future. Moreover, experienced inflation is assuredly above even 3% for the readers of this blog. Go back and look at your spending over the past couple of years. If it’s not up by at least 4% you most likely bought fewer goods and services. With income dispersion increasing, if your income is only increasing at the official inflation rate, you’ll find your standard of living is slipping.

Investors often ask what portion of their portfolio should be in midstream. A better approach over the past five years has been to turn this thinking on its head, and sprinkle a little S&P500 exposure into a midstream-dominant portfolio. It’s unconventional but fairly describes your blogger’s posture.
I was chatting about some of the long-run consequences of AI with a friend recently. We agreed that autonomous driving, and at some point aviation too, will prevail. Public acceptance will likely lag the safety of the technology. Around 40,000 people die in auto accidents annually, a figure society accepts as the result of approximately 40,000 unrelated but fatally flawed human actions. It’s around 1.2 deaths per 100 million Vehicle Miles Traveled (VMT). Autonomous vehicles will need to be an order of magnitude or two better – and they probably will be. I hope so. Driving is such a waste of time.
Another friend asserts that human doctors will eventually be fully replaced by AI. Many of us have likely consulted Dr Claude, perhaps using it to decide whether to see a doctor or to check his diagnosis and treatment. I think it’ll be a long time before a cancer patient favors AI over their human oncologist, even if the latter will be checking conclusions with her preferred AI model.
But it made me wonder where the threshold is for our children’s generation, a cohort more open to silicon solutions. The annual physical might be first – many may find it quite acceptable to receive an email assessing that their recent blood test and other vitals require no further follow-up. What about an annual visit to the dermatologist? What if you’re worried about a rash? The critical question is, what is the most worrying health condition for which an AI diagnosis of no further treatment needed would be acceptable to the next generation? Ask your children. If you learn anything interesting, let me know.
We have two funds that seek to profit from this environment:

Important Disclosures
The information provided is for informational purposes only and investors should determine for themselves whether a particular service, security or product is suitable for their investment needs. The information contained herein is not complete, may not be current, is subject to change, and is subject to, and qualified in its entirety by, the more complete disclosures, risk factors and other terms that are contained in the disclosure, prospectus, and offering. Certain information herein has been obtained from third party sources and, although believed to be reliable, has not been independently verified and its accuracy or completeness cannot be guaranteed. No representation is made with respect to the accuracy, completeness or timeliness of this information. Nothing provided on this site constitutes tax advice. Individuals should seek the advice of their own tax advisor for specific information regarding tax consequences of investments. Investments in securities entail risk and are not suitable for all investors. This site is not a recommendation nor an offer to sell (or solicitation of an offer to buy) securities in the United States or in any other jurisdiction.
References to indexes and benchmarks are hypothetical illustrations of aggregate returns and do not reflect the performance of any actual investment. Investors cannot invest in an index and do not reflect the deduction of the advisor’s fees or other trading expenses. There can be no assurance that current investments will be profitable. Actual realized returns will depend on, among other factors, the value of assets and market conditions at the time of disposition, any related transaction costs, and the timing of the purchase. Indexes and benchmarks may not directly correlate or only partially relate to portfolios managed by SL Advisors as they have different underlying investments and may use different strategies or have different objectives than portfolios managed by SL Advisors (e.g. The Alerian index is a group MLP securities in the oil and gas industries. Portfolios may not include the same investments that are included in the Alerian Index. The S & P Index does not directly relate to investment strategies managed by SL Advisers.)
This site may contain forward-looking statements relating to the objectives, opportunities, and the future performance of the U.S. market generally. Forward-looking statements may be identified by the use of such words as; “believe,” “expect,” “anticipate,” “should,” “planned,” “estimated,” “potential” and other similar terms. Examples of forward-looking statements include, but are not limited to, estimates with respect to financial condition, results of operations, and success or lack of success of any particular investment strategy. All are subject to various factors, including, but not limited to general and local economic conditions, changing levels of competition within certain industries and markets, changes in interest rates, changes in legislation or regulation, and other economic, competitive, governmental, regulatory and technological factors affecting a portfolio’s operations that could cause actual results to differ materially from projected results. Such statements are forward-looking in nature and involves a number of known and unknown risks, uncertainties and other factors, and accordingly, actual results may differ materially from those reflected or contemplated in such forward-looking statements. Prospective investors are cautioned not to place undue reliance on any forward-looking statements or examples. None of SL Advisors LLC or any of its affiliates or principals nor any other individual or entity assumes any obligation to update any forward-looking statements as a result of new information, subsequent events or any other circumstances. All statements made herein speak only as of the date that they were made. r
Certain hyperlinks or referenced websites on the Site, if any, are for your convenience and forward you to third parties’ websites, which generally are recognized by their top level domain name. Any descriptions of, references to, or links to other products, publications or services does not constitute an endorsement, authorization, sponsorship by or affiliation with SL Advisors LLC with respect to any linked site or its sponsor, unless expressly stated by SL Advisors LLC. Any such information, products or sites have not necessarily been reviewed by SL Advisors LLC and are provided or maintained by third parties over whom SL Advisors LLC exercise no control. SL Advisors LLC expressly disclaim any responsibility for the content, the accuracy of the information, and/or quality of products or services provided by or advertised on these third-party sites.
All investment strategies have the potential for profit or loss. Different types of investments involve varying degrees of risk, and there can be no assurance that any specific investment will be suitable or profitable for a client’s investment portfolio.
Past performance of the American Energy Independence Index is not indicative of future returns.
Leave a Reply
Want to join the discussion?Feel free to contribute!