
Fairly Valued and Still Valuable


/
We’ve been providing sector updates to a number of clients recently. Midstream had a good 1Q but stalled during 2Q. The resumption of hostilities last week pushed stocks higher, but even without that we think valuations remain attractive.
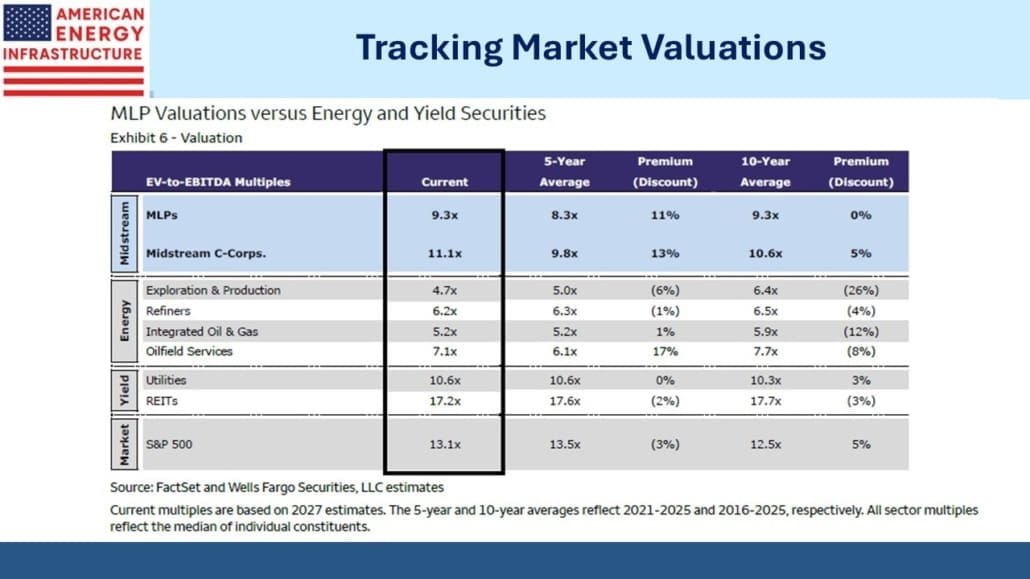
Enterprise Value/EBITDA at 11.1X is close to the ten-year average, a period which includes the 2020 pandemic when valuations hit all-time lows. Considering that the ten-year return on the American Energy Infrastructure Index (AEITR) is 13.6% through June, it shows that cash flows have roughly grown commensurately with stock prices during this time.

Utilities and REITs, two sectors that yield-seeking investors often compare with midstream, are close to their ten-year average EV/EBITDA.
This is also true for the S&P500. So when investors compare the AEITR’s YTD return of 25% with the overall market’s +11% and wonder if it’s too late to participate in America’s booming energy sector, this should assure them that growing EBITDA has maintained the relative value between midstream and the S&P500.
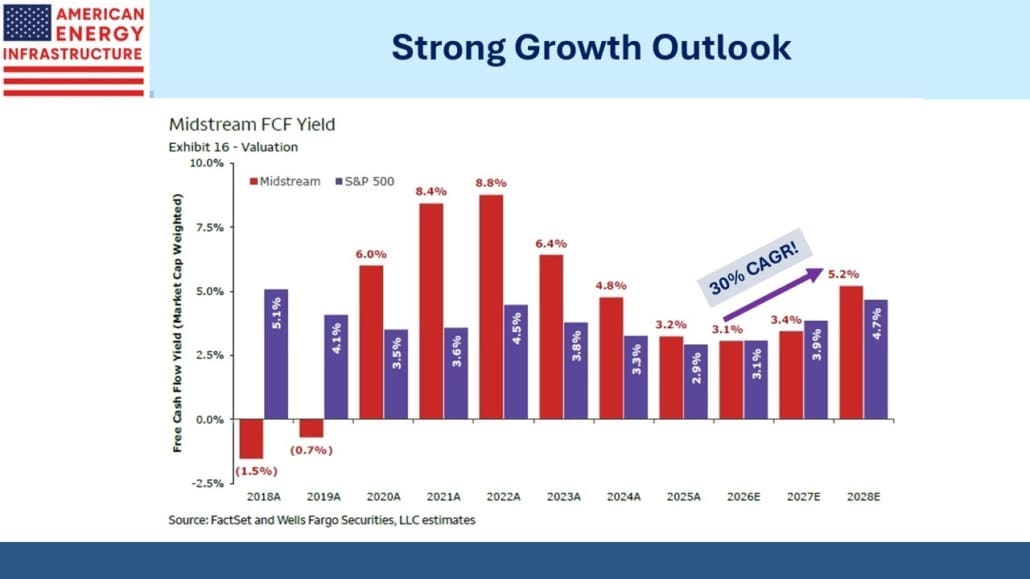
The sector’s Free Cash Flow (FCF) yield is not especially high and is, unusually, equal to the FCF yield for the S&P500. However, Wells Fargo expects much faster growth. The 2028 projected FCF yield translates into a 30% compounded annual growth rate.
Capex plans in 2028 will change, which will affect FCF. It’s likely that if cash flows grow as fast as implied by the 2028 projected 5.2% FCF yield, capex will increase too as companies identify more accretive projects. Nonetheless, industry-wide cash flow from operations is on a solid growth path.
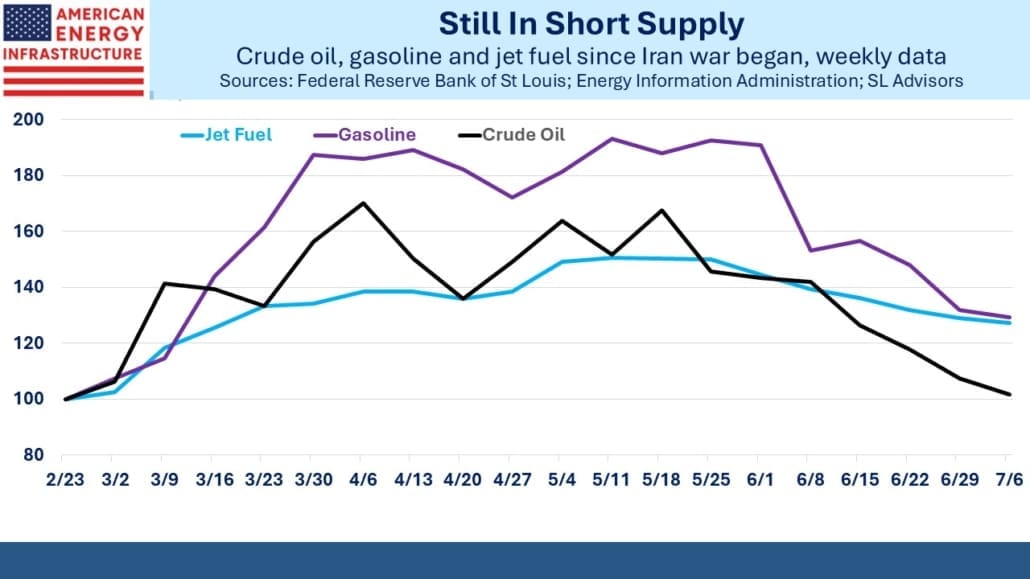
Prior to the President’s declaration on Wednesday that the ceasefire was over, the White House was disappointed that the drop in crude had not been matched by refined products. The International Energy Agency (IEA) estimates that 9% of global refining capacity has been taken offline this year.
Ukraine’s increasingly successful drone strikes on Russian energy infrastructure have knocked out up to 40% of their refining capacity, around 2 Million Barrels per Day (MMB/D). Russia has started importing gasoline from India, Kazakhstan and Belarus, the first time they’ve had to do so since the collapse of the Soviet Union in the 1990s. At last week’s NATO summit Trump expressed support for Ukraine’s long-range drone strikes, saying it might hasten the end of the war.
The closure of the Strait of Hormuz forced Persian Gulf refiners to shut down production as they ran out of storage capacity for their output. This took another 3.5MMB/D of refining capacity offline across the Middle East.
China also restricted exports of refined products such as jet fuel and diesel once war broke out at the end of February. In early July they relaxed that ban as crude supplies resumed, but recent developments will likely see the export ban reinstated.
Gasoline and jet fuel are both 30% above their former levels. On Thursday, diesel futures jumped 11% after Russia halted exports.
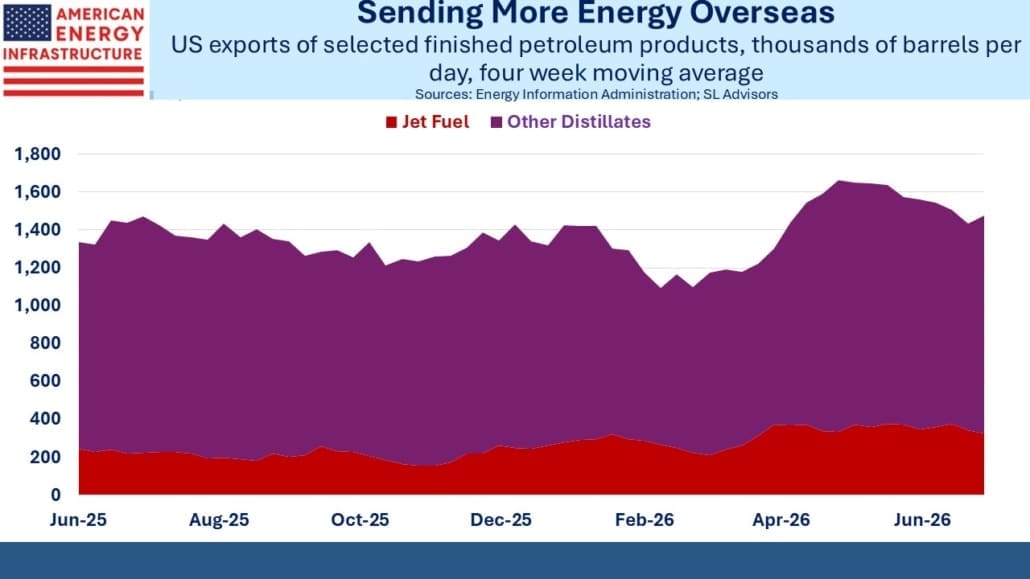
The tightness in refined products, especially gasoline, will be frustrating the White House and further contribute to the war’s unpopularity. The connection between Ukraine’s success at hitting Russian energy infrastructure hundreds of miles in land and the prices US drivers pay at the pump is not obvious, until you examine the shifting trade flows for refined products.
US exports of distillate products, chiefly diesel, are up 10% over the past year. Jet fuel exports are up 34%. Consequently, US stocks of distillates are the lowest in a decade. Industry analysts expect domestic diesel prices will need to rise to moderate exports.
It turns out that restoring crude supplies through the Strait of Hormuz isn’t all that’s required to lower refined product prices. And it’s the prices of gasoline, diesel and jet fuel that impact consumers more than the price of a barrel of oil.

Airfares remain significantly higher than six months ago – I estimate the cost to fly to London to watch your favorite English Premier League team is 50% above its pre-war level. In spite of the price hikes, United Airlines CEO Scott Kirby reports “robust demand”, so higher airfares may be here to stay.
Inflation for the basket of goods and services bought by readers of this blog is most assuredly well above 3%.
JPMorgan reported that Venture Global (VG) earned an average price of $6.45 per Million BTUs of natural gas that they liquefied for shippers in 2Q26. This is roughly double prevailing rates, reflecting the scramble to replace Qatar’s lost exports. It’s an example of how VG’s strategy of retaining around a third of its capacity uncontracted can reap benefits at times like this.
Wars create unintended consequences. Midstream investors are generally on the right side of them.
We have two have funds that seek to profit from this environment:

Important Disclosures
The information provided is for informational purposes only and investors should determine for themselves whether a particular service, security or product is suitable for their investment needs. The information contained herein is not complete, may not be current, is subject to change, and is subject to, and qualified in its entirety by, the more complete disclosures, risk factors and other terms that are contained in the disclosure, prospectus, and offering. Certain information herein has been obtained from third party sources and, although believed to be reliable, has not been independently verified and its accuracy or completeness cannot be guaranteed. No representation is made with respect to the accuracy, completeness or timeliness of this information. Nothing provided on this site constitutes tax advice. Individuals should seek the advice of their own tax advisor for specific information regarding tax consequences of investments. Investments in securities entail risk and are not suitable for all investors. This site is not a recommendation nor an offer to sell (or solicitation of an offer to buy) securities in the United States or in any other jurisdiction.
References to indexes and benchmarks are hypothetical illustrations of aggregate returns and do not reflect the performance of any actual investment. Investors cannot invest in an index and do not reflect the deduction of the advisor’s fees or other trading expenses. There can be no assurance that current investments will be profitable. Actual realized returns will depend on, among other factors, the value of assets and market conditions at the time of disposition, any related transaction costs, and the timing of the purchase. Indexes and benchmarks may not directly correlate or only partially relate to portfolios managed by SL Advisors as they have different underlying investments and may use different strategies or have different objectives than portfolios managed by SL Advisors (e.g. The Alerian index is a group MLP securities in the oil and gas industries. Portfolios may not include the same investments that are included in the Alerian Index. The S & P Index does not directly relate to investment strategies managed by SL Advisers.)
This site may contain forward-looking statements relating to the objectives, opportunities, and the future performance of the U.S. market generally. Forward-looking statements may be identified by the use of such words as; “believe,” “expect,” “anticipate,” “should,” “planned,” “estimated,” “potential” and other similar terms. Examples of forward-looking statements include, but are not limited to, estimates with respect to financial condition, results of operations, and success or lack of success of any particular investment strategy. All are subject to various factors, including, but not limited to general and local economic conditions, changing levels of competition within certain industries and markets, changes in interest rates, changes in legislation or regulation, and other economic, competitive, governmental, regulatory and technological factors affecting a portfolio’s operations that could cause actual results to differ materially from projected results. Such statements are forward-looking in nature and involves a number of known and unknown risks, uncertainties and other factors, and accordingly, actual results may differ materially from those reflected or contemplated in such forward-looking statements. Prospective investors are cautioned not to place undue reliance on any forward-looking statements or examples. None of SL Advisors LLC or any of its affiliates or principals nor any other individual or entity assumes any obligation to update any forward-looking statements as a result of new information, subsequent events or any other circumstances. All statements made herein speak only as of the date that they were made. r
Certain hyperlinks or referenced websites on the Site, if any, are for your convenience and forward you to third parties’ websites, which generally are recognized by their top level domain name. Any descriptions of, references to, or links to other products, publications or services does not constitute an endorsement, authorization, sponsorship by or affiliation with SL Advisors LLC with respect to any linked site or its sponsor, unless expressly stated by SL Advisors LLC. Any such information, products or sites have not necessarily been reviewed by SL Advisors LLC and are provided or maintained by third parties over whom SL Advisors LLC exercise no control. SL Advisors LLC expressly disclaim any responsibility for the content, the accuracy of the information, and/or quality of products or services provided by or advertised on these third-party sites.
All investment strategies have the potential for profit or loss. Different types of investments involve varying degrees of risk, and there can be no assurance that any specific investment will be suitable or profitable for a client’s investment portfolio.
Past performance of the American Energy Independence Index is not indicative of future returns.
Leave a Reply
Want to join the discussion?Feel free to contribute!