MLPs Weak in November, As Usual
The Alerian MLP Index now has almost a 24 year history. Investors whose experience pre-dates the 2014 high will fondly recall many strong years. Since 1996 the compounded annual return is 11.3% including distributions, even though the AMZX remains 44% off its August 2014 high.
MLPs are a shrinking part of the midstream energy infrastructure sector, and the AMZX omits many of North America’s biggest pipeline companies, because they’re corporations not MLPs. Flows in MLPs and related funds are still dominated by retail investors, which is why the January effect has historically been more impactful than is generally the case for the S&P500.
The human tendency to take stock of one’s portfolio around year’s end is exacerbated by the impact of K-1s. Sell an MLP in December rather than January, and you’ll avoid a K-1 for that one month of the new year. Similarly, a purchase delayed from December to January avoids a K-1 for the last month of the prior year. Both these effects tend to lift prices in January versus December.
Tax loss selling is another feature that tends to weigh later in the year. U.S. equities are owned in large part by institutions that are often tax exempt, so tax planning has a more muted effect on the broader market.
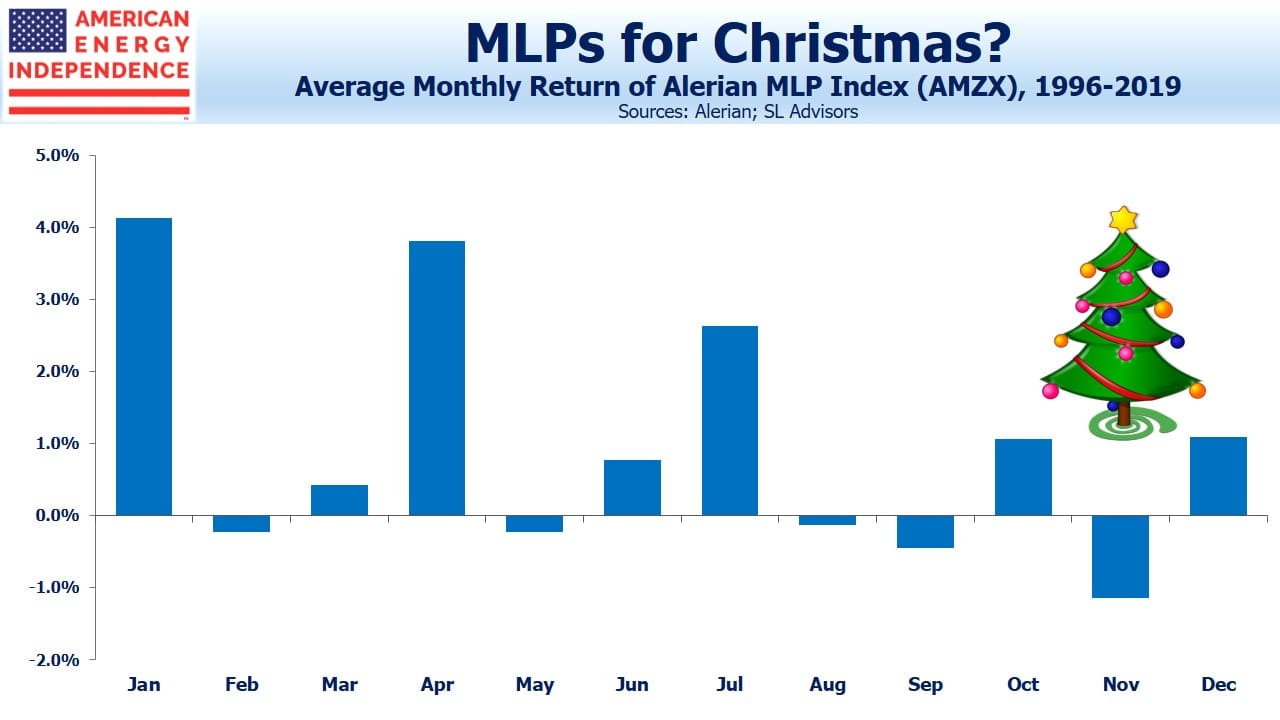
Consequently, MLPs exhibit the seasonal pattern shown in the chart above. It may be some comfort for investors to be reminded that November is historically the best time to make investments in the sector. You’ll also note a smaller pattern around quarterly distributions, which generally fall in the middle of the quarter. Investors tend to avoid selling when a new distribution is imminent, so returns in the first month of the quarter are usually above average. It ought to make no difference at all – stock prices adjust for dividends paid when they go ex-dividend. Nonetheless, the pattern further suggests that sales made in the first month of the quarter will on average draw a higher price.
January stands out as a very strong month, returning three times the monthly average.
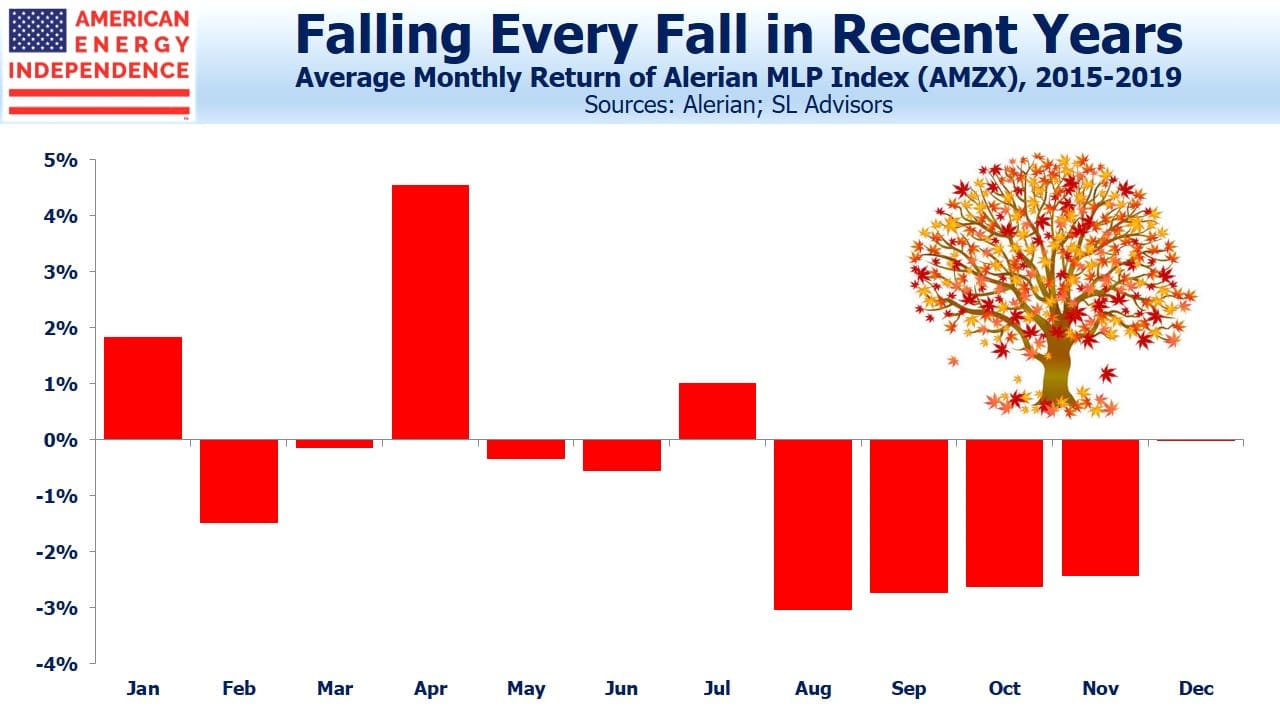
In recent years familiar patterns have been less reliable, including the tendency for MLPs to outperform the equity market (yes, they used to do that). The seasonals of the past five years reveal a very different pattern. As the sector has slumped, a clear trend has emerged of investors selling during the fourth quarter. The first half of the year has remained stronger than the second half, although oddly April has been better than January. Perhaps planned January purchases have been delayed because of prior weakness.
So far, October and November are continuing the pattern of 4Q weakness seen in recent years. We know anecdotally that tax loss selling has been a factor for some investors. It still looks to us as if a bounce in the early part of the new year remains likely. Sentiment is certainly consistent with current prices providing a near term low.
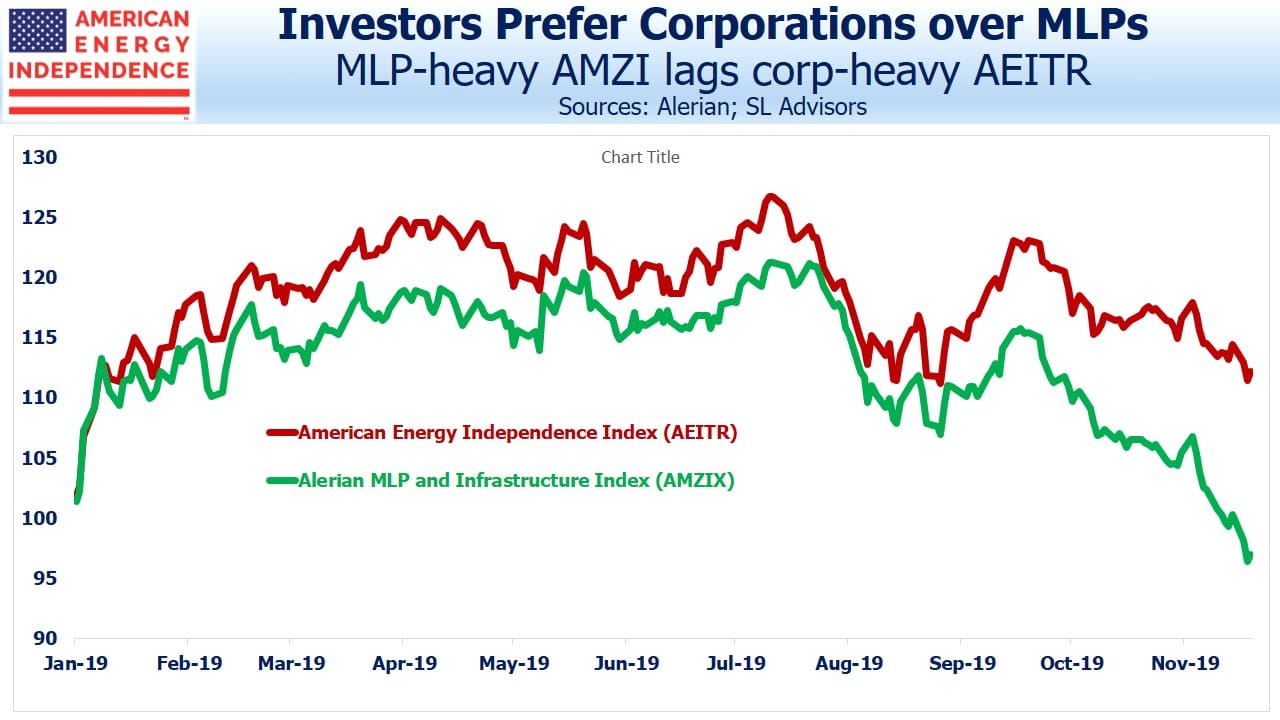
MLP seasonals remain interesting because of what they tell us about past retail investor behavior. Nonetheless, the MLP sector remains too small with too few well managed companies to justify a significant allocation. The American Energy Independence Index is 80% corporations with just a handful of MLPs. It’s +13% YTD compared with -5% for AMZX, starkly illustrating the preference investors have for pipeline corporations over MLPs, and the steady exit of retail investors from MLP-dominated products. Note that you cannot invest directly in an index.
We manage an ETF which seeks to track the American Energy Independence Index.
SL Advisors is the sub-advisor to the Catalyst MLP & Infrastructure Fund. To learn more about the Fund, please click here.
Important Disclosures
The information provided is for informational purposes only and investors should determine for themselves whether a particular service, security or product is suitable for their investment needs. The information contained herein is not complete, may not be current, is subject to change, and is subject to, and qualified in its entirety by, the more complete disclosures, risk factors and other terms that are contained in the disclosure, prospectus, and offering. Certain information herein has been obtained from third party sources and, although believed to be reliable, has not been independently verified and its accuracy or completeness cannot be guaranteed. No representation is made with respect to the accuracy, completeness or timeliness of this information. Nothing provided on this site constitutes tax advice. Individuals should seek the advice of their own tax advisor for specific information regarding tax consequences of investments. Investments in securities entail risk and are not suitable for all investors. This site is not a recommendation nor an offer to sell (or solicitation of an offer to buy) securities in the United States or in any other jurisdiction.
References to indexes and benchmarks are hypothetical illustrations of aggregate returns and do not reflect the performance of any actual investment. Investors cannot invest in an index and do not reflect the deduction of the advisor’s fees or other trading expenses. There can be no assurance that current investments will be profitable. Actual realized returns will depend on, among other factors, the value of assets and market conditions at the time of disposition, any related transaction costs, and the timing of the purchase. Indexes and benchmarks may not directly correlate or only partially relate to portfolios managed by SL Advisors as they have different underlying investments and may use different strategies or have different objectives than portfolios managed by SL Advisors (e.g. The Alerian index is a group MLP securities in the oil and gas industries. Portfolios may not include the same investments that are included in the Alerian Index. The S & P Index does not directly relate to investment strategies managed by SL Advisers.)
This site may contain forward-looking statements relating to the objectives, opportunities, and the future performance of the U.S. market generally. Forward-looking statements may be identified by the use of such words as; “believe,” “expect,” “anticipate,” “should,” “planned,” “estimated,” “potential” and other similar terms. Examples of forward-looking statements include, but are not limited to, estimates with respect to financial condition, results of operations, and success or lack of success of any particular investment strategy. All are subject to various factors, including, but not limited to general and local economic conditions, changing levels of competition within certain industries and markets, changes in interest rates, changes in legislation or regulation, and other economic, competitive, governmental, regulatory and technological factors affecting a portfolio’s operations that could cause actual results to differ materially from projected results. Such statements are forward-looking in nature and involves a number of known and unknown risks, uncertainties and other factors, and accordingly, actual results may differ materially from those reflected or contemplated in such forward-looking statements. Prospective investors are cautioned not to place undue reliance on any forward-looking statements or examples. None of SL Advisors LLC or any of its affiliates or principals nor any other individual or entity assumes any obligation to update any forward-looking statements as a result of new information, subsequent events or any other circumstances. All statements made herein speak only as of the date that they were made. r
Certain hyperlinks or referenced websites on the Site, if any, are for your convenience and forward you to third parties’ websites, which generally are recognized by their top level domain name. Any descriptions of, references to, or links to other products, publications or services does not constitute an endorsement, authorization, sponsorship by or affiliation with SL Advisors LLC with respect to any linked site or its sponsor, unless expressly stated by SL Advisors LLC. Any such information, products or sites have not necessarily been reviewed by SL Advisors LLC and are provided or maintained by third parties over whom SL Advisors LLC exercise no control. SL Advisors LLC expressly disclaim any responsibility for the content, the accuracy of the information, and/or quality of products or services provided by or advertised on these third-party sites.
All investment strategies have the potential for profit or loss. Different types of investments involve varying degrees of risk, and there can be no assurance that any specific investment will be suitable or profitable for a client’s investment portfolio.
Past performance of the American Energy Independence Index is not indicative of future returns.


I have a preference for MLPs over C corporations because I can receive an irrationally high, mostly tax deferred, sustainable yield from an untaxed pass through entity, and in the rare event that there is any taxable income passed through to limited partners it benefits from the 20% deduction under new section 199A. Why not mention these benefits of MLP investing? .