The 2017 MLPA Conference
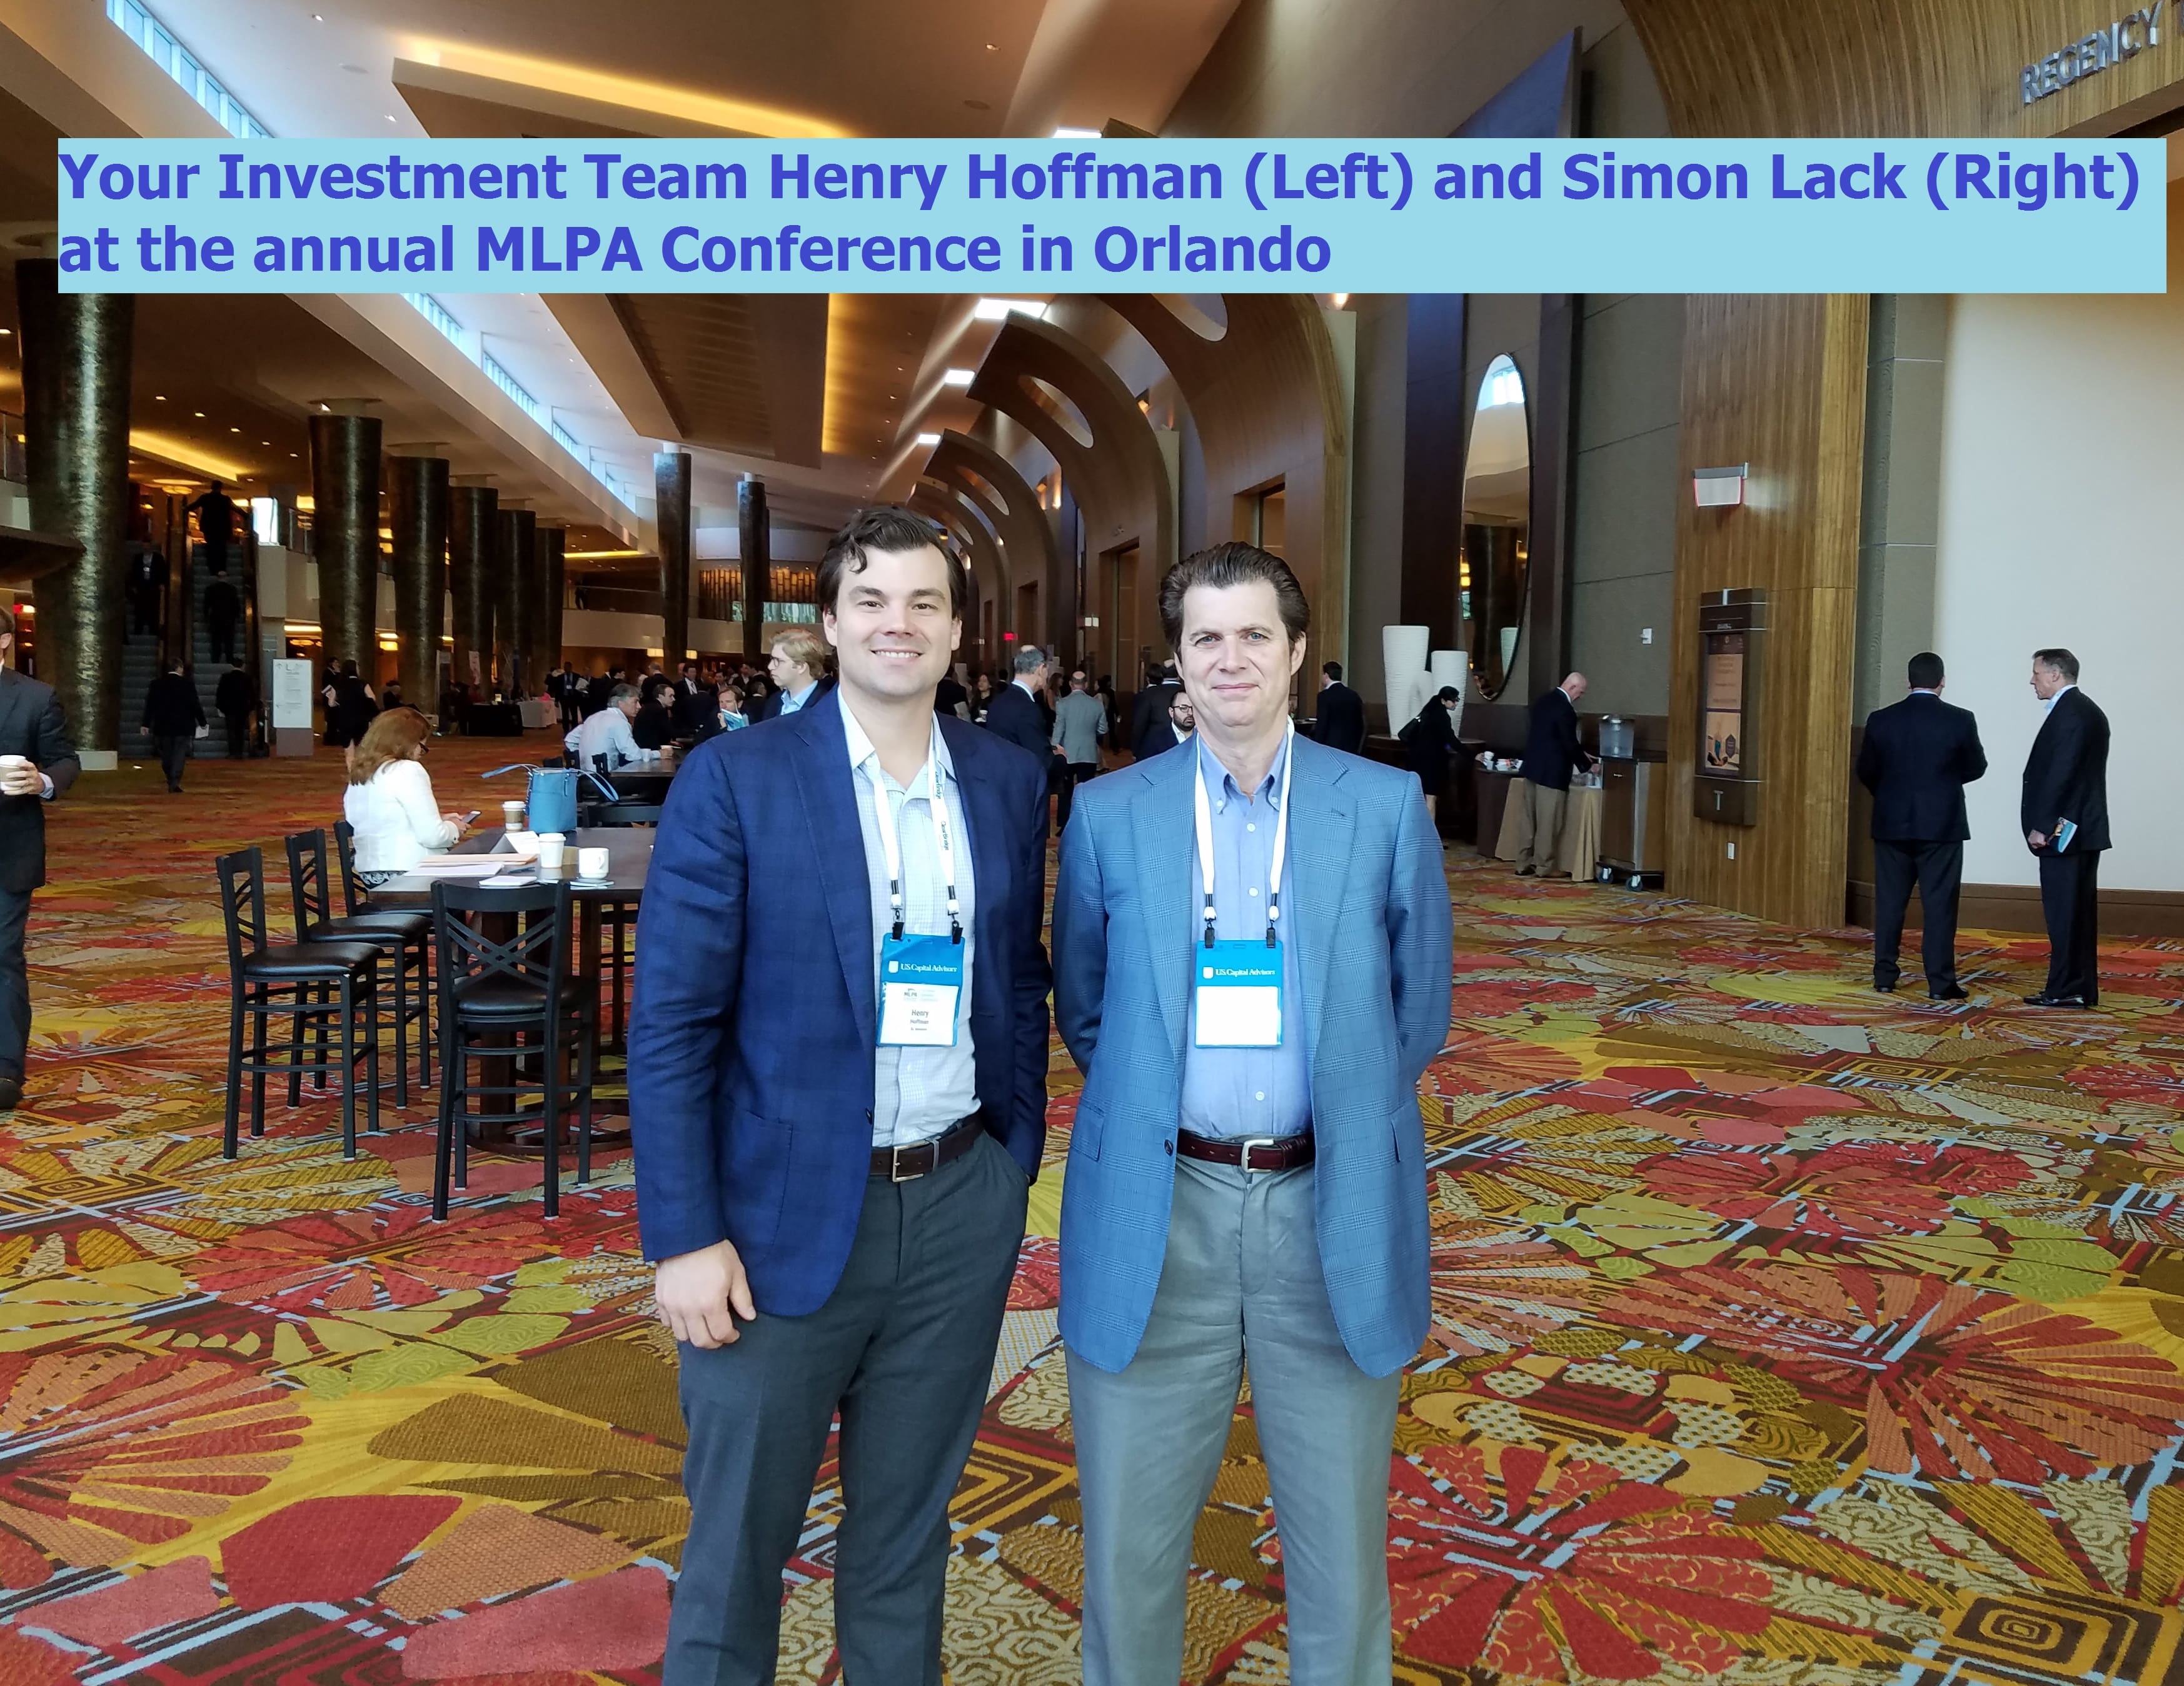
Last week was the annual MLPA conference, in Orlando, Florida. It’s safe to say the guests at nearby Walt Disney World had a more carefree time than beleaguered MLP investors. One long-time attendee described the mood as “glum”, noting that energy sector investors had expected a more vigorous rebound.
Although the conference is organized around presentations by management teams in the Hyatt Regency’s cavernous ballrooms, the private meetings that take place on the periphery are far more valuable. It’s also nice to catch up with some familiar faces.
We had a full schedule of meetings with management teams, usually with just one or two other investors in attendance. The most pressing question for MLP investors of late is, if Exploration and Production (E&P) companies (i.e. MLP customers) are continuing to increase production of oil and gas, why isn’t this good for MLP stock prices?
In fact the entire energy complex has had a terrible few months. MLPs are -2% YTD although the sector feels as if it’s been falling for months. Meanwhile, the Oil Services ETF (OIH) is -22%. U.S. crude output is 9.2 MMB/D (Million Barrels per Day) and is widely expected to reach 10 MMB/D next year by many observers, including OPEC. 1Q earnings for E&P names as well as for MLPs recently were generally good with positive guidance. The fundamentals remain encouraging . To paraphrase a typical question from a financial advisor invested in our mutual fund, “If you’re so smart, how come we’re losing money lately?”
When asked about recent stock price weakness, MLP executives were similarly puzzled. The good news is that they’re not spending much time worrying about it – following the 2015 Crash many steps were taken to reduce reliance on the fickle equity markets. Leverage is down and distribution coverage is up. Distributions have been held flat and in some cases cut in order to finance growth, while growth projects have been screened for higher returns. Generally, MLPs don’t have a pressing need for capital. While stock price weakness makes both management and investors poorer, it’s not being met by a desperate rush for capital to complete projects. And in some cases, such as Targa Resources (TRGP), equity capital even at lower prices was nonetheless attractive financing for their recently announced Natural Gas Liquids pipeline from the Permian Basin to North Texas.
In short, management teams usually exuded excitement about greater utilization of their existing infrastructure and growth plans. They dismissed the high recent correlation between MLPs and crude oil as a temporary phenomenon and not reflective of improving midstream fundamentals. For investors who rely on the market to confirm the wisdom of their recent decisions, it’s a time for patience while America’s journey to energy independence sends ever more hydrocarbons through our pipelines, processing units and storage facilities.
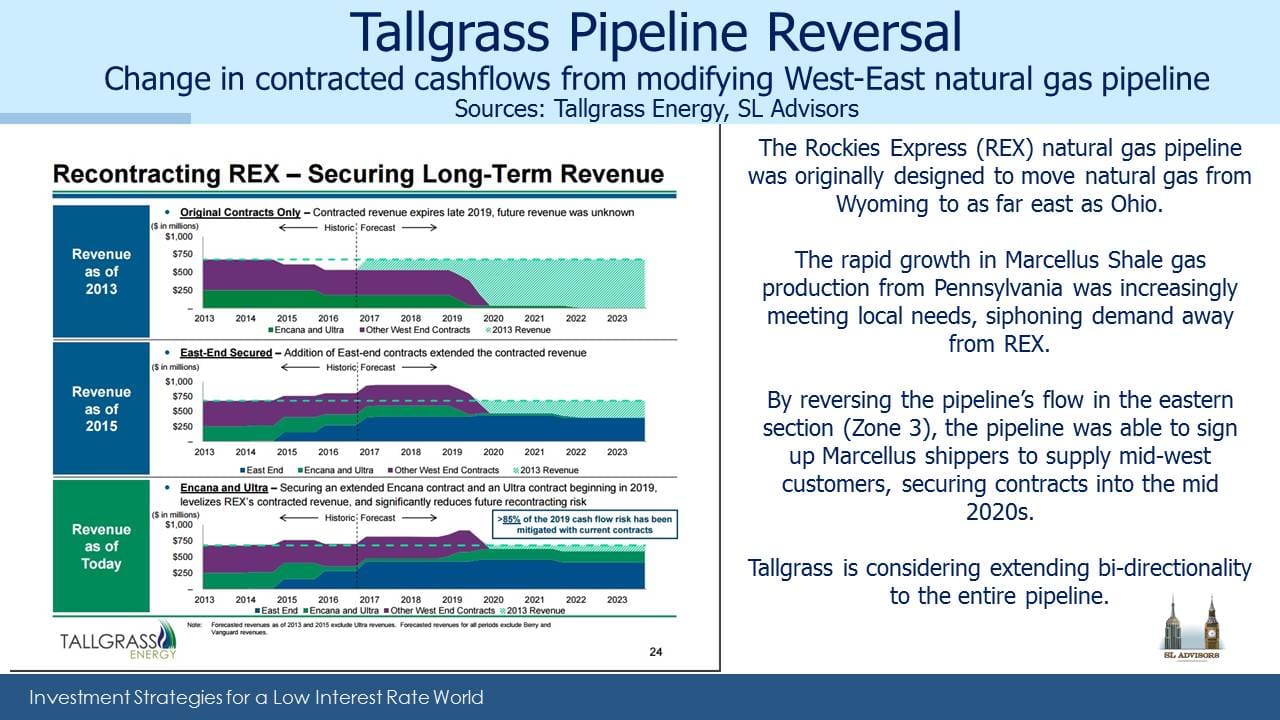
We enjoyed the discussion with Tallgrass Energy (TEP) CFO Gary Brauchle. We’ve followed TEP for a while (see Tallgrass Energy is the Right Kind of MLP). Four years ago their Rockies Express natural gas pipeline (REX) looked increasingly redundant as its west-east flow from the Rocky Mountains to Ohio faced growing competition from the Marcellus shale. TEP reversed the flow on the eastern end of this pipeline, and is looking at making the entire line two-way. Apparently our meeting was the same day as a bearish report from an obscure research analyst, but his criticisms must have lacked substance since nobody raised the subject.
The MLP investor base has changed in recent years. Pre-Shale, it was an income generating asset class with modest growth. The Shale Revolution created a substantially greater need for capital to fund growth, such that during 2010-13 MLPs were raising more in equity than they were paying out in distributions (see The 2015 MLP Crash; Why and What’s Next). The conversion of the investor base from income seeking to growth seeking was not smooth. One CEO estimated 75% turnover in his shareholders over two years.
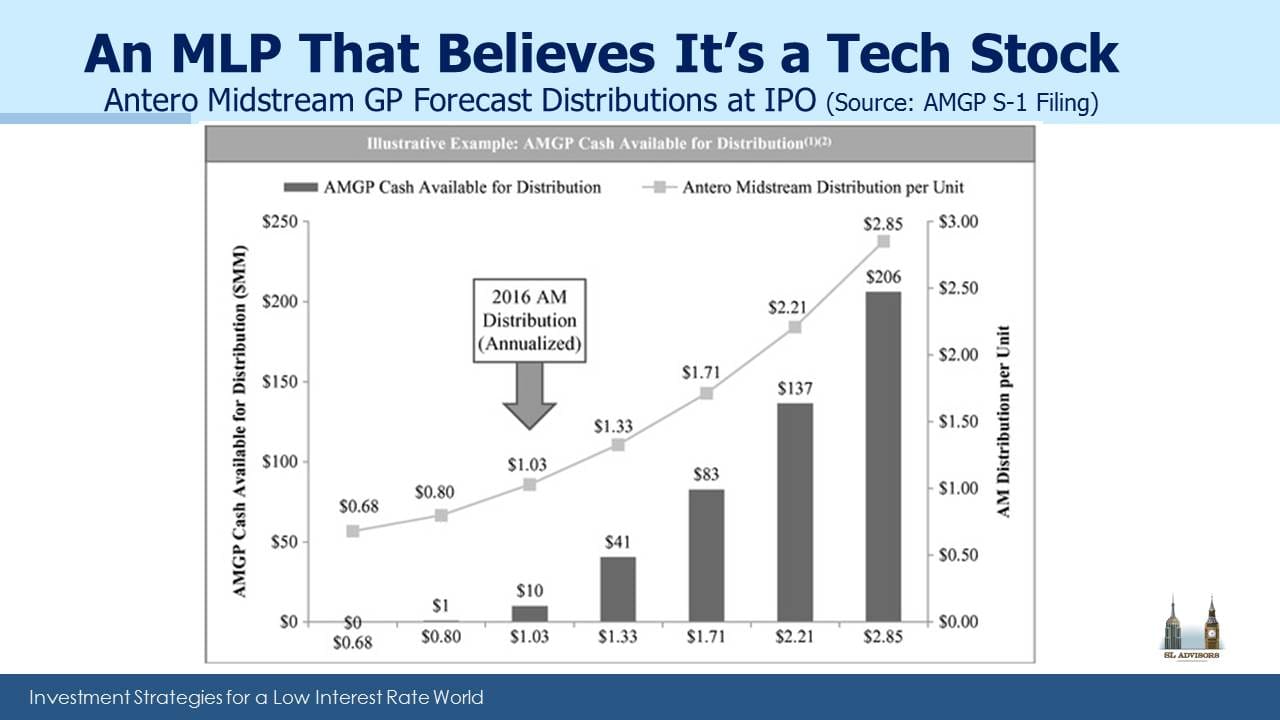
Topics of discussion included the drop in attendance from last year, although the convention facility is so big it rarely seems crowded. There was some surprise at the pricing of Antero Midstream GP’s (AMGP) recent IPO, with a yield of 1%. Even with the 73% annual distribution growth forecast by one underwriter, by 2020 it would still yield just over 5%. They may pull it off, but sharing some of that execution risk with an eager set of IPO investors seems like a smart move.
Those who had seen the presentation from the IPO roadshow chuckled at the inclusion of SnapChat as a comparable (because of its very high cashflow growth). We thought that, along with the pricing, betrayed a fairly demeaning view of investors by management. It seems most things need to go right for AMGP, and a stumble will expose the gulf in valuation between AMGP and, say, Plains All American (PAGP) with its 10% Distributable Cash Flow (DCF) yield. If MLPs were in a bubble, AMGP would be Exhibit 1, except they’re not.
In chatting about Energy Transfer, several investors remembered last year’s self-dealing transaction in which Energy Transfer Equity (ETE) issued preferential securities just to the management team (see Is Energy Transfer Quietly Fleecing its Investors?). It’s still possible a Delaware court could rule against ETE and order the transaction be cancelled.
In many of the meetings managements were peppered with very granular questions about percentage utilization of a particular asset next quarter. These generally came from sell-side analysts looking to refine their models so as to forecast the next quarter’s earnings and DCF. No doubt these are important topics, but we feel such “forest for the trees” questions miss the big picture. America is heading to Energy Independence, and midstream infrastructure is vital to that goal. In the near term, it might seem important to try and forecast a quarterly fluctuation, but it’s very hard to do so consistently.
Far more importantly, over the next few years what other asset class can possibly compete when America is headed towards being the world’s biggest crude oil producer (see America Is Great!)? Last November OPEC lost, and consequently our E&P companies are gaining market share. The short-cycle projects that are Shale represent a completely different risk paradigm to conventional drilling with its inherent uncertainty over returns (see Why Shale Upends Conventional Thinking). Gathering and Processing networks with their close exposure to the wellhead are more exposed to volume uncertainty in the short term, but over the longer term they’ll be utilized. These are the issues that will drive returns, and while most investors are probably aware of the big picture their questions often betrayed a blinkered view.
MLP management teams hold substantially more money in GPs compared with MLPs when given the choice within the GP/MLP structure. What could be a more powerful statement about the upside they see than their personal investment in the vehicles with operating leverage? The managements of Energy Transfer Equity (ETE) and TEP are communicating their opinions with their commitments of personal capital (see table at the end of The Limited Rights of Some MLP Investors).
In discussing their allocation to MLPs, I often ask investors what is the next most attractive sector of the equity markets beyond energy infrastructure, with its huge tailwinds, substantial future growth and 7% yields selling at 30% off its 2014 all-time highs. It doesn’t require much thought to buy what’s rising, but not much else is cheap.
In summary, value-seeking investors should draw comfort from the complete absence of irrational exuberance at this year’s MLPA conference. Today’s MLP investors are for the most part a patient bunch.
We are invested in ETE PAGP, TEGP (the GP of TEP) and TRGP
Important Disclosures
The information provided is for informational purposes only and investors should determine for themselves whether a particular service, security or product is suitable for their investment needs. The information contained herein is not complete, may not be current, is subject to change, and is subject to, and qualified in its entirety by, the more complete disclosures, risk factors and other terms that are contained in the disclosure, prospectus, and offering. Certain information herein has been obtained from third party sources and, although believed to be reliable, has not been independently verified and its accuracy or completeness cannot be guaranteed. No representation is made with respect to the accuracy, completeness or timeliness of this information. Nothing provided on this site constitutes tax advice. Individuals should seek the advice of their own tax advisor for specific information regarding tax consequences of investments. Investments in securities entail risk and are not suitable for all investors. This site is not a recommendation nor an offer to sell (or solicitation of an offer to buy) securities in the United States or in any other jurisdiction.
References to indexes and benchmarks are hypothetical illustrations of aggregate returns and do not reflect the performance of any actual investment. Investors cannot invest in an index and do not reflect the deduction of the advisor’s fees or other trading expenses. There can be no assurance that current investments will be profitable. Actual realized returns will depend on, among other factors, the value of assets and market conditions at the time of disposition, any related transaction costs, and the timing of the purchase. Indexes and benchmarks may not directly correlate or only partially relate to portfolios managed by SL Advisors as they have different underlying investments and may use different strategies or have different objectives than portfolios managed by SL Advisors (e.g. The Alerian index is a group MLP securities in the oil and gas industries. Portfolios may not include the same investments that are included in the Alerian Index. The S & P Index does not directly relate to investment strategies managed by SL Advisers.)
This site may contain forward-looking statements relating to the objectives, opportunities, and the future performance of the U.S. market generally. Forward-looking statements may be identified by the use of such words as; “believe,” “expect,” “anticipate,” “should,” “planned,” “estimated,” “potential” and other similar terms. Examples of forward-looking statements include, but are not limited to, estimates with respect to financial condition, results of operations, and success or lack of success of any particular investment strategy. All are subject to various factors, including, but not limited to general and local economic conditions, changing levels of competition within certain industries and markets, changes in interest rates, changes in legislation or regulation, and other economic, competitive, governmental, regulatory and technological factors affecting a portfolio’s operations that could cause actual results to differ materially from projected results. Such statements are forward-looking in nature and involves a number of known and unknown risks, uncertainties and other factors, and accordingly, actual results may differ materially from those reflected or contemplated in such forward-looking statements. Prospective investors are cautioned not to place undue reliance on any forward-looking statements or examples. None of SL Advisors LLC or any of its affiliates or principals nor any other individual or entity assumes any obligation to update any forward-looking statements as a result of new information, subsequent events or any other circumstances. All statements made herein speak only as of the date that they were made. r
Certain hyperlinks or referenced websites on the Site, if any, are for your convenience and forward you to third parties’ websites, which generally are recognized by their top level domain name. Any descriptions of, references to, or links to other products, publications or services does not constitute an endorsement, authorization, sponsorship by or affiliation with SL Advisors LLC with respect to any linked site or its sponsor, unless expressly stated by SL Advisors LLC. Any such information, products or sites have not necessarily been reviewed by SL Advisors LLC and are provided or maintained by third parties over whom SL Advisors LLC exercise no control. SL Advisors LLC expressly disclaim any responsibility for the content, the accuracy of the information, and/or quality of products or services provided by or advertised on these third-party sites.
All investment strategies have the potential for profit or loss. Different types of investments involve varying degrees of risk, and there can be no assurance that any specific investment will be suitable or profitable for a client’s investment portfolio.
Past performance of the American Energy Independence Index is not indicative of future returns.


I didn’t think that attendance was seiuosly low; it was about 800, down perhaps from the glory days but still respectable. What was your opinion of the Q & A format instead of presentations by EPD and others? The only disappointment for me was that the last panel on Friday, on Markets, should not have spent time on the nature of investors (retail, institutional) or investment products (CEFs, open end funds, ETFs etc.) year by year, and instead should have dealt with the same relevant issue you raised in this blog: why isn’t rising volumes good for MLPs? For example, this week’s Commodities column in Barron’s deals with growing gas supply vs demand. The real takeaway is that the growing gas supply, while not so good for E & P, is great for gas gatherers and processors, compressors, fractionators, storage facility owners, pipeline operators .exporters, and the midstream generally