The Quiet Investors in Energy
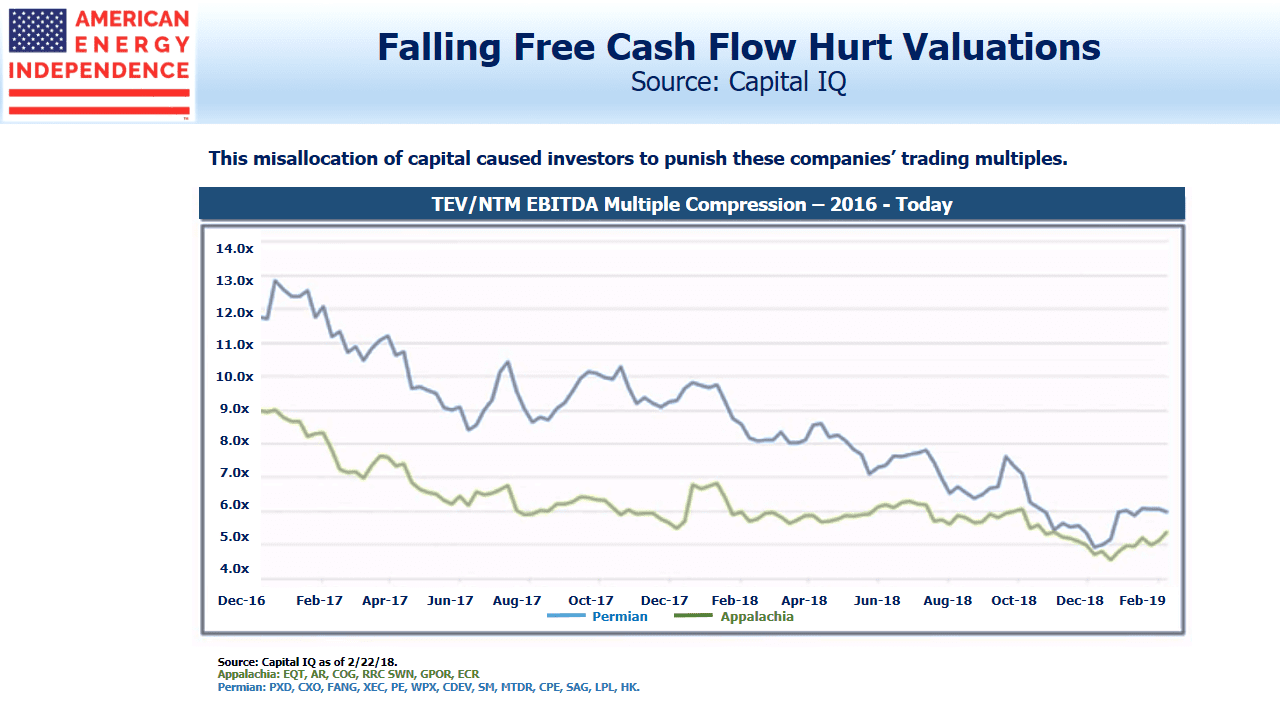
The S&P Energy sector has delivered the worst returns of eleven sectors for four of the past five years. Reflecting investor disdain, energy is now around 6% of the S&P500, down by half in the past decade. Realizing the full potential of the Shale Revolution has demanded a lot of capital – over $1TN by one estimate. Management teams’ desire to grow has increasingly conflicted with investors’ insistence on greater cash returns. In midstream infrastructure this has been especially acute, with the traditional income-seeking MLP investor enduring multiple distribution cuts to support growth projects.
On Twitter, an anonymous, well informed energy investor created a humorous NCAA-type bracket to identify the most capital-destructive management team among publicly traded energy stocks. Each pairing is resolved through online votes, with the ultimate winner earning a most ignominious title. One comment asked if there was another sector with as wide a gap between management self-perceptions and those of investors.
Yet there’s a class of investor that continues to find energy attractive – private equity.
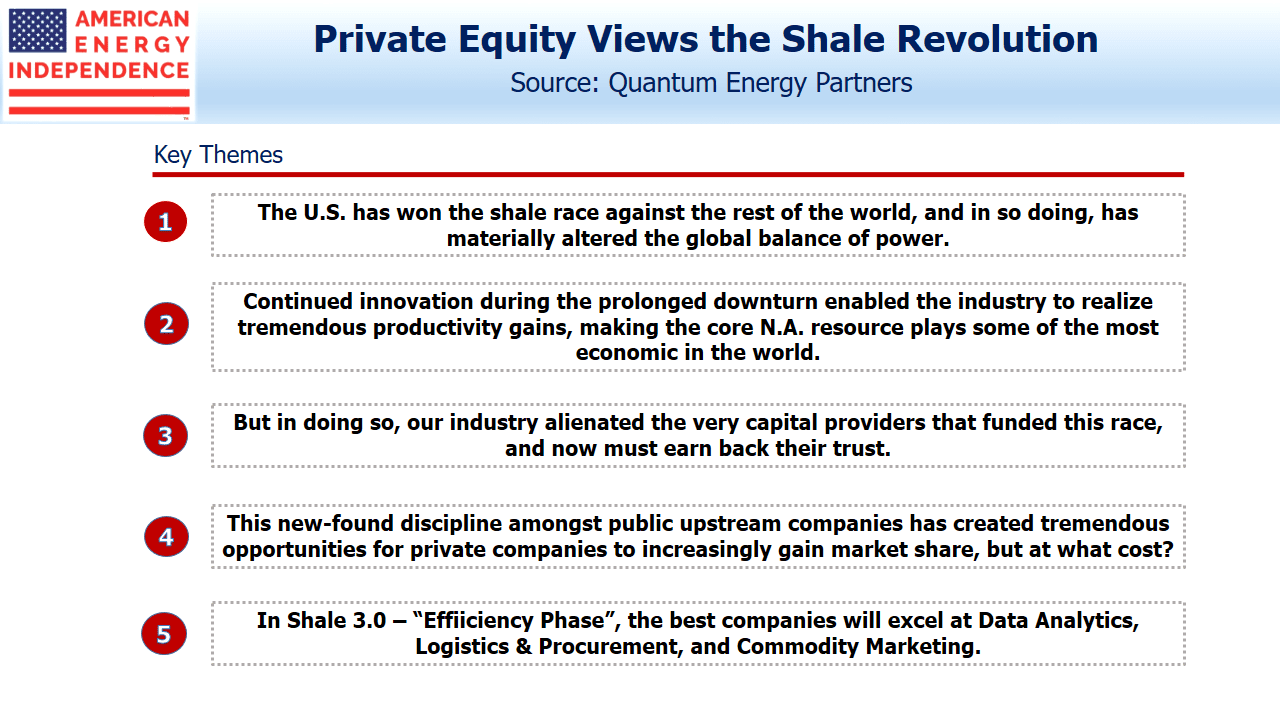
A recent presentation by S. Wil VanLoh Jr. of Quantum Energy Partners offered a useful perspective.
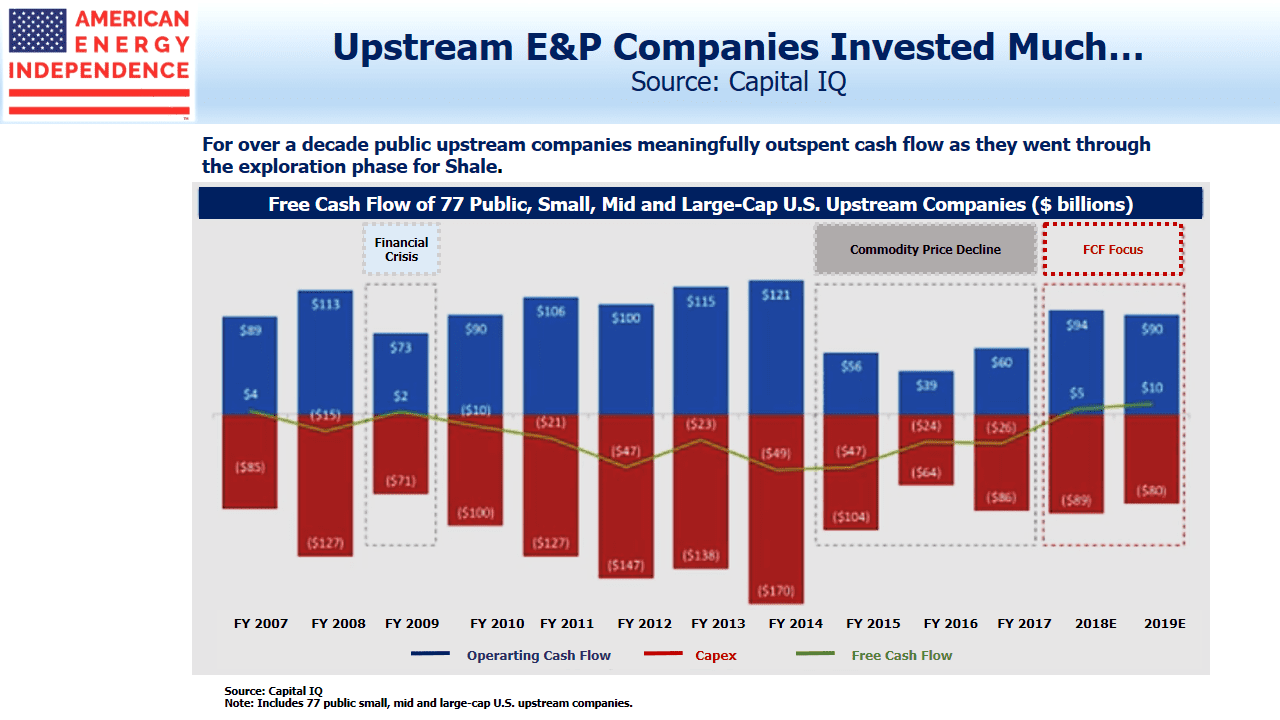
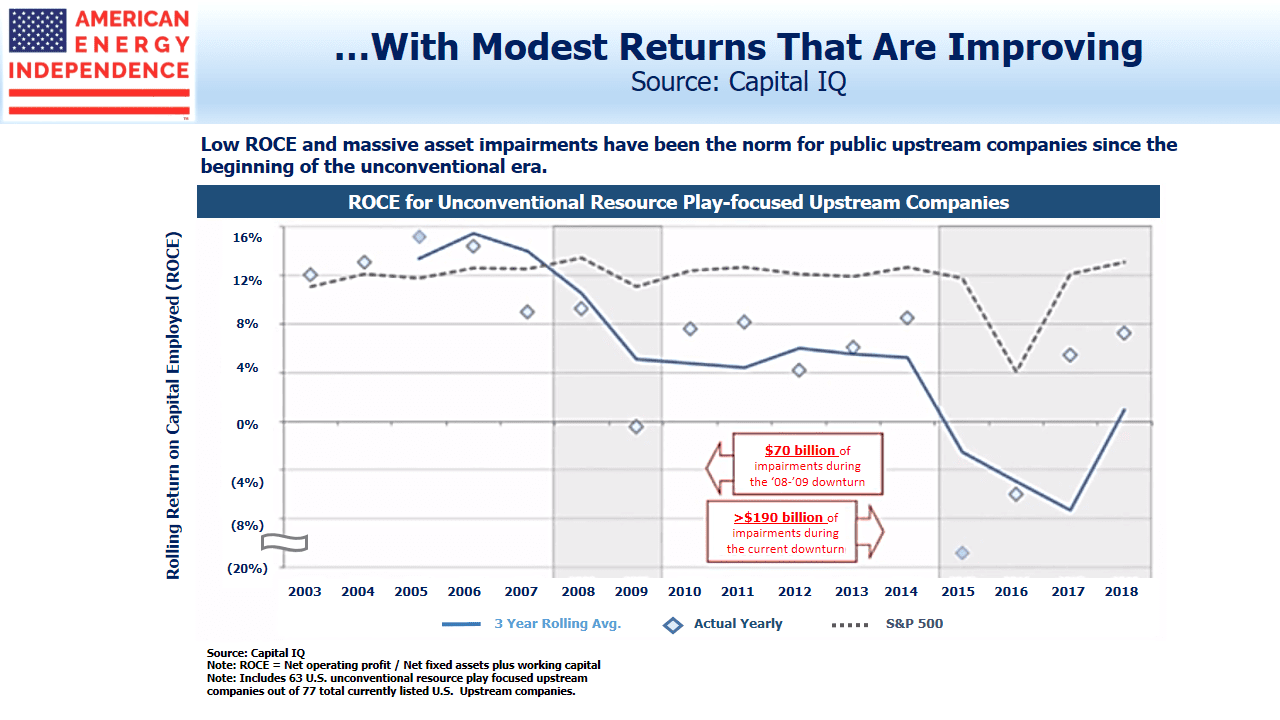
Public equity investors are repelled by the energy sector’s persistently low free cash flow, with profits too frequently plowed back into new production. By contrast, private equity (PE) funds with their locked up capital are drawn by the internal rates of return, which they find attractive. Their ability to outspend cashflow for several years as projects are developed can’t be matched by their public counterparts, whose investors are sensitive to quarterly earnings. Although this hasn’t led to any significant public companies being taken private, it has led to PE becoming a steadily bigger player in shale. They recognize that the U.S. has already won the shale race against the rest of the world.
Growing market share and increased geopolitical flexibility must surely lead to good investment returns. But around $1TN in capital has not all been well spent, and any sector recovery depends on management teams regaining the trust that has been lost.
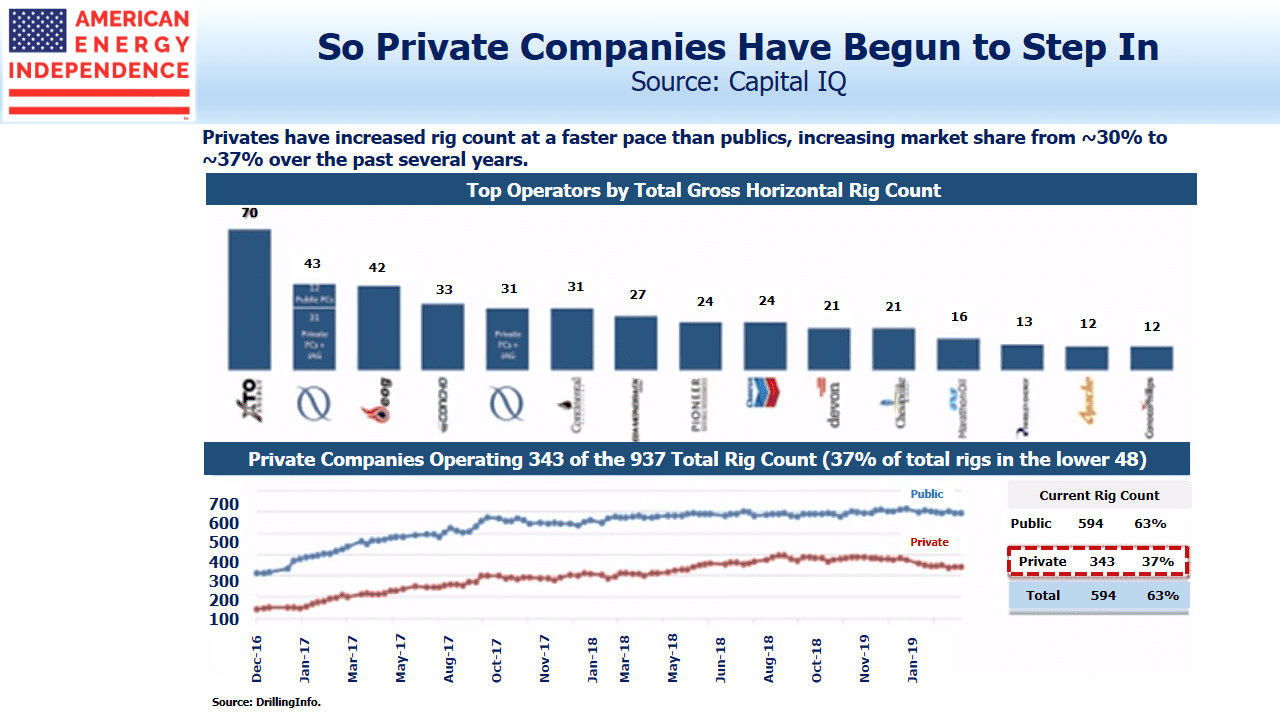
The industry’s operating efficiencies are well known. Capex per well has been declining while output has soared. Pad drilling has brought scale and corresponding efficiencies, with rig productivity up 6X in the last five years. Since 2010, acquisition and development of shale resources by PE has grown from 10% to over half the total. PE rig count is estimated at 37%, up from 20% six years ago.
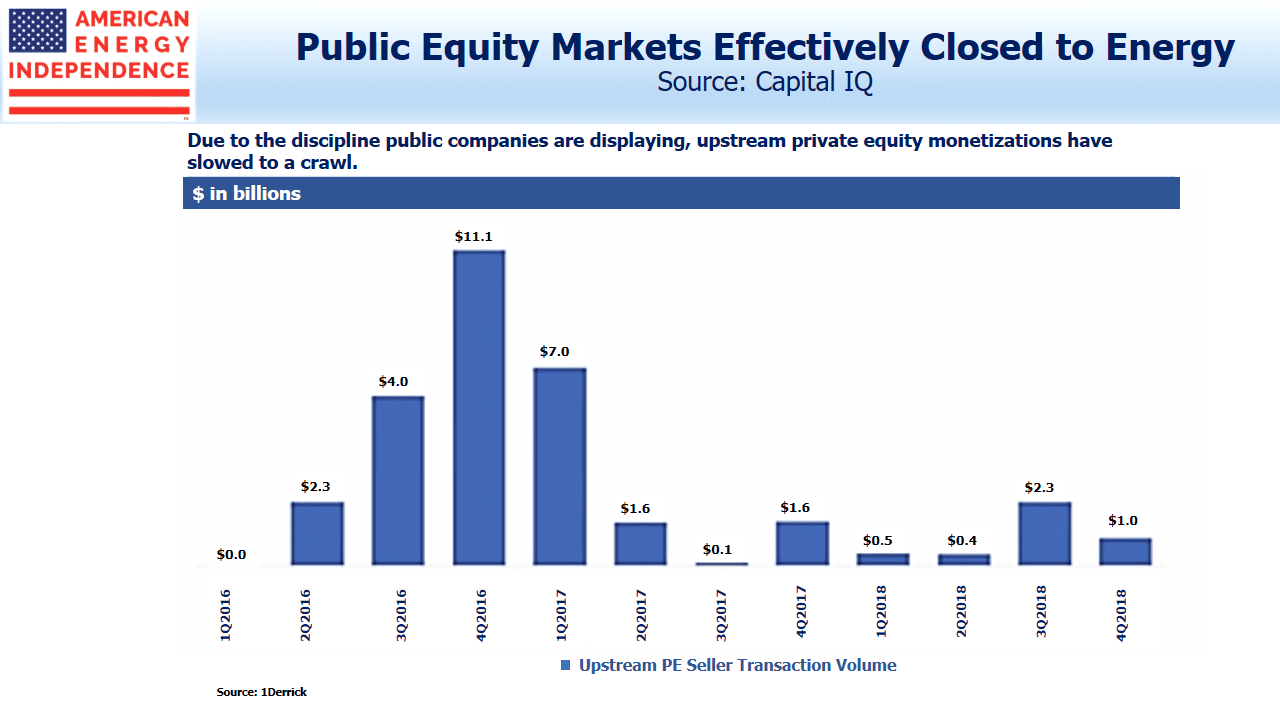
Nonetheless, the shrinking of the public equity investor appetite for energy has impacted PE, because it’s constrained their ability to exit via a sale of assets to a publicly traded company, or via an IPO. There were no MLP IPOs last year, illustrating that the public equity markets are closed to energy companies. So PE holding periods have gone from 2-4 years to 4-7.
Meanwhile, public companies are responding to calls for greater cash flow discipline by moderating growth capex and redirecting more cash back to investors through dividend hikes and buybacks. There are also signs that capex plans now adjust more quickly to altered circumstances than in the past. Several upstream companies lowered their planned spending during 4Q18 as oil slumped.
On the midstream side, Magellan Midstream (MMP) recently have shelved an expansion project because of insufficient shipper demand. Several projects are planned to increase capacity for the largest crude tankers, which require deepwater ports offshore. Perhaps concerned about overcapacity, Kinder Morgan pulled out of a JV with Enbridge to develop a deep water crude oil export facility, although the project is still expected to proceed.
A consequence of this new capital discipline is that public companies’ criteria for buying assets from PE owners include that they be FCF-positive, so as to maintain promised cash returns to stockholders. A positive NPV is no longer enough, which is forcing PE investors to develop their assets more fully than expected, taking up more time and capital.
Infrastructure funds, which often include midstream energy infrastructure in their mandate, raised a record $88BN in 2018, up from $75BN in 2017. PE investors have been active in the pipeline sector. Blackstone invested almost $5BN in two deals with Targa Resources (TRGP) and Tallgrass (TGE). Funds managed by Carlyle, Stonepeak and Arclight have also committed capital.
Although the 2014-16 MLP price collapse continues to haunt investors, there is a chronic shortage of assets that can generate stable cashflows over two decades or more. The recent drop in U.S. ten year yields to 2.4% is one example. Ten year German Bund yields are negative again, and French oil giant Total issued perpetual bonds at 1.75%. PE investors buying infrastructure understand this better than public markets, and a publicly owned pipeline with a distributable cash flow yield above 10% looks like a mispriced asset. It’s why we think the sector has substantial room to appreciate.
SL Advisors is the sub-advisor to the Catalyst MLP & Infrastructure Fund. To learn more about the Fund, please click here.
SL Advisors is also the advisor to an ETF (USAIETF.com).
Important Disclosures
The information provided is for informational purposes only and investors should determine for themselves whether a particular service, security or product is suitable for their investment needs. The information contained herein is not complete, may not be current, is subject to change, and is subject to, and qualified in its entirety by, the more complete disclosures, risk factors and other terms that are contained in the disclosure, prospectus, and offering. Certain information herein has been obtained from third party sources and, although believed to be reliable, has not been independently verified and its accuracy or completeness cannot be guaranteed. No representation is made with respect to the accuracy, completeness or timeliness of this information. Nothing provided on this site constitutes tax advice. Individuals should seek the advice of their own tax advisor for specific information regarding tax consequences of investments. Investments in securities entail risk and are not suitable for all investors. This site is not a recommendation nor an offer to sell (or solicitation of an offer to buy) securities in the United States or in any other jurisdiction.
References to indexes and benchmarks are hypothetical illustrations of aggregate returns and do not reflect the performance of any actual investment. Investors cannot invest in an index and do not reflect the deduction of the advisor’s fees or other trading expenses. There can be no assurance that current investments will be profitable. Actual realized returns will depend on, among other factors, the value of assets and market conditions at the time of disposition, any related transaction costs, and the timing of the purchase. Indexes and benchmarks may not directly correlate or only partially relate to portfolios managed by SL Advisors as they have different underlying investments and may use different strategies or have different objectives than portfolios managed by SL Advisors (e.g. The Alerian index is a group MLP securities in the oil and gas industries. Portfolios may not include the same investments that are included in the Alerian Index. The S & P Index does not directly relate to investment strategies managed by SL Advisers.)
This site may contain forward-looking statements relating to the objectives, opportunities, and the future performance of the U.S. market generally. Forward-looking statements may be identified by the use of such words as; “believe,” “expect,” “anticipate,” “should,” “planned,” “estimated,” “potential” and other similar terms. Examples of forward-looking statements include, but are not limited to, estimates with respect to financial condition, results of operations, and success or lack of success of any particular investment strategy. All are subject to various factors, including, but not limited to general and local economic conditions, changing levels of competition within certain industries and markets, changes in interest rates, changes in legislation or regulation, and other economic, competitive, governmental, regulatory and technological factors affecting a portfolio’s operations that could cause actual results to differ materially from projected results. Such statements are forward-looking in nature and involves a number of known and unknown risks, uncertainties and other factors, and accordingly, actual results may differ materially from those reflected or contemplated in such forward-looking statements. Prospective investors are cautioned not to place undue reliance on any forward-looking statements or examples. None of SL Advisors LLC or any of its affiliates or principals nor any other individual or entity assumes any obligation to update any forward-looking statements as a result of new information, subsequent events or any other circumstances. All statements made herein speak only as of the date that they were made. r
Certain hyperlinks or referenced websites on the Site, if any, are for your convenience and forward you to third parties’ websites, which generally are recognized by their top level domain name. Any descriptions of, references to, or links to other products, publications or services does not constitute an endorsement, authorization, sponsorship by or affiliation with SL Advisors LLC with respect to any linked site or its sponsor, unless expressly stated by SL Advisors LLC. Any such information, products or sites have not necessarily been reviewed by SL Advisors LLC and are provided or maintained by third parties over whom SL Advisors LLC exercise no control. SL Advisors LLC expressly disclaim any responsibility for the content, the accuracy of the information, and/or quality of products or services provided by or advertised on these third-party sites.
All investment strategies have the potential for profit or loss. Different types of investments involve varying degrees of risk, and there can be no assurance that any specific investment will be suitable or profitable for a client’s investment portfolio.
Past performance of the American Energy Independence Index is not indicative of future returns.


Of course there is a considerable amount of PE fund investments in the midstream in addition to the investments in Tallgrass and Targa. First Reserve has two funds in CEQP, one as an investor and one as a joint venture partner. Energy Capital Partners has a fund invested in SMLP. Riverstone had a fund, the 10 year term of which recently expired and which led to the ET position, invested in USAC. Many of these funds have 10 year terms, and there is always an issue as to what happens when the fund has to dispose of its position. Some funds can be extended for a year or two. The joint venture First Reserve fund partnering with CEQP is not term limited, but that is not usual. Energy Capital Partner’s fund in SMLP expires next year, after it receives its deferred purchase price obligation from the partnership Personally, my opinion is that I would not invest with ArcLight, given how it behaved with AMID (of course, AMID’s management was less than forthcoming in its disclosures and did not produce compelling results).
And the many PE companies which own their non-public midstream operations most often do so through LLCs or partnerships and not by C corporations.
Enjoy these articles every time.
Please move the graphs over to the left margin so when I save these posts to WORD, the graph does not get cut off by being wider than the text.
Thank you.
Tom, on the right of the blog post you’ll find a pdf button and a print button. Hopefully one of these will allow you to print without using Word. Simon