The Oil and Water Business
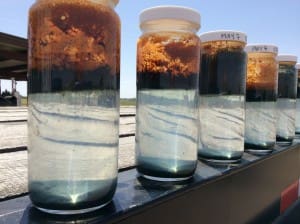
It’s seldom appreciated outside the energy industry, but drilling for oil, natural gas and natural gas liquids (NGLs) involves handling far more water than hydrocarbons. This isn’t just because production often involves pumping water into a well. Water is usually present naturally, and comes up with the oil and gas that is produced. Ideally in holding tanks the oil separates from the water and floats above it, although often some further treatment is required to isolate them. Following separation, the water needs to be disposed of safely. This is creating some growing challenges.
Much of the available data is fragmented because in the U.S. the states generally oversee Exploration and Production (E&P) activities except where on Federal land. As a result, the aggregated data that does exist relies in part on estimates because of differing standards of collection. In addition, the most recent data is still a few years old, and given the growth in domestic oil and gas production since then, today’s figures would be higher.
“Produced water” refers to any water that comes up along with hydrocarbons. Water occurs naturally in most plays and comes up with the extracted oil and gas. But it also includes water pumped into a mature well to force oil up (Enhanced Oil Recovery, EOR) and the flowback of water used in fracking. Any water that comes out of a well is deemed produced water and is subject to Federal rules on safe disposal. Sifting through the available studies, while the ratio of produced water to oil varies widely, it’s clear that we produce substantially more of the former. The water/oil ratio differs by region, by play and by age of well. With conventional drilling, early output typically favors oil and becomes less favorable over time. Produced water generally has no value, although not always; for example, iodide recovered from produced water in Oklahoma represents the largest source of iodine in the U.S. But generally, produced water is high in salt content and contains many unpleasant minerals including NORMs (Naturally Occurring Radioactive Material). Its disposal can represent a significant cost, and because increased water disposal reflects deteriorating well economics (since produced water volumes usually increase over time), installing water disposal infrastructure is often delayed.
Some numbers are helpful to illustrate the scope of the issue. A 2012 GAO report cited 56 million barrels of produced water daily, relying on a 2009 study. Back then the Shale Revolution was virtually unknown. U.S. crude oil production was 5.3 Million Barrels per Day (MMB/D), slightly over half of today’s level, while natural gas output is up by a third. Since injection of water into wells via fracking has further contributed to produced water, one would think produced water volumes have increased proportionally. However, a more recent study of 2012 data suggests that produced water hadn’t increased despite rises in oil and gas production.
One possible reason is that the water:oil ratio is higher in older conventional wells (estimates are 10:1) that are being replaced by new horizontal shale wells which have lower produced water ratios (3:1) after the initial flowback. Nonetheless, a lot of produced water must be disposed of and unlike conventional wells that can inject the water back into a reservoir, tight shale rock won’t accept it.
The result is that substantial quantities of water have to be moved by truck or (if infrastructure exists) by pipe to treatment centers for ultimate disposal. Other applications can include recycling water into new completions, irrigation and industrial cooling, depending on the presence of harmful elements in the water. But most of it gets injected back into the ground using deep wells specially designed for produced water disposal. A single oil well producing 1,000 barrels per day, even if it came with only three times as much water would still require 12 water trucks per day (one barrel = 42 gallons; 3,000 barrels of water = 126,000 gallons; assumed truck capacity of 10,000 gallons), to haul the water away. The 56 million barrels a day of produced water, which is cited by several researchers, is twice the daily flow over Niagara Falls. It’s why the industry often regards itself as being in the water hauling business more than the oil business.
That all this water disposal takes place without much media focus is testament to the already tight rules in place and the industry’s general adherence to them. The minor tremors in Oklahoma are often incorrectly blamed on fracking. In fact, the disposal of produced water into unstable rock formations is the primary cause. Although some of that water is likely the result of hydrofracturing, all oil wells generate produced water. Infrastructure for water disposal is a topic that increasingly draws questions from analysts on conference calls. Of course one man’s expense is another’s business opportunity, and MLPs are adding water disposal infrastructure to the services they provide. Crestwood (CEQP) provided water volume statistics on their most recent earnings call and is planning further investments in this area. COO Heath Deneke commented that, “…the water handling business is likely to grow to be an $8 billion to $10 billion per year business over the next five to seven years in the Delaware-Permian.”
Some worry that the growth of crude oil production in the Permian will be constrained by the challenges of safe water disposal, although the industry is working on solutions and the challenges are likely to be manageable.
We are invested in CEQP

Important Disclosures
The information provided is for informational purposes only and investors should determine for themselves whether a particular service, security or product is suitable for their investment needs. The information contained herein is not complete, may not be current, is subject to change, and is subject to, and qualified in its entirety by, the more complete disclosures, risk factors and other terms that are contained in the disclosure, prospectus, and offering. Certain information herein has been obtained from third party sources and, although believed to be reliable, has not been independently verified and its accuracy or completeness cannot be guaranteed. No representation is made with respect to the accuracy, completeness or timeliness of this information. Nothing provided on this site constitutes tax advice. Individuals should seek the advice of their own tax advisor for specific information regarding tax consequences of investments. Investments in securities entail risk and are not suitable for all investors. This site is not a recommendation nor an offer to sell (or solicitation of an offer to buy) securities in the United States or in any other jurisdiction.
References to indexes and benchmarks are hypothetical illustrations of aggregate returns and do not reflect the performance of any actual investment. Investors cannot invest in an index and do not reflect the deduction of the advisor’s fees or other trading expenses. There can be no assurance that current investments will be profitable. Actual realized returns will depend on, among other factors, the value of assets and market conditions at the time of disposition, any related transaction costs, and the timing of the purchase. Indexes and benchmarks may not directly correlate or only partially relate to portfolios managed by SL Advisors as they have different underlying investments and may use different strategies or have different objectives than portfolios managed by SL Advisors (e.g. The Alerian index is a group MLP securities in the oil and gas industries. Portfolios may not include the same investments that are included in the Alerian Index. The S & P Index does not directly relate to investment strategies managed by SL Advisers.)
This site may contain forward-looking statements relating to the objectives, opportunities, and the future performance of the U.S. market generally. Forward-looking statements may be identified by the use of such words as; “believe,” “expect,” “anticipate,” “should,” “planned,” “estimated,” “potential” and other similar terms. Examples of forward-looking statements include, but are not limited to, estimates with respect to financial condition, results of operations, and success or lack of success of any particular investment strategy. All are subject to various factors, including, but not limited to general and local economic conditions, changing levels of competition within certain industries and markets, changes in interest rates, changes in legislation or regulation, and other economic, competitive, governmental, regulatory and technological factors affecting a portfolio’s operations that could cause actual results to differ materially from projected results. Such statements are forward-looking in nature and involves a number of known and unknown risks, uncertainties and other factors, and accordingly, actual results may differ materially from those reflected or contemplated in such forward-looking statements. Prospective investors are cautioned not to place undue reliance on any forward-looking statements or examples. None of SL Advisors LLC or any of its affiliates or principals nor any other individual or entity assumes any obligation to update any forward-looking statements as a result of new information, subsequent events or any other circumstances. All statements made herein speak only as of the date that they were made. r
Certain hyperlinks or referenced websites on the Site, if any, are for your convenience and forward you to third parties’ websites, which generally are recognized by their top level domain name. Any descriptions of, references to, or links to other products, publications or services does not constitute an endorsement, authorization, sponsorship by or affiliation with SL Advisors LLC with respect to any linked site or its sponsor, unless expressly stated by SL Advisors LLC. Any such information, products or sites have not necessarily been reviewed by SL Advisors LLC and are provided or maintained by third parties over whom SL Advisors LLC exercise no control. SL Advisors LLC expressly disclaim any responsibility for the content, the accuracy of the information, and/or quality of products or services provided by or advertised on these third-party sites.
All investment strategies have the potential for profit or loss. Different types of investments involve varying degrees of risk, and there can be no assurance that any specific investment will be suitable or profitable for a client’s investment portfolio.
Past performance of the American Energy Independence Index is not indicative of future returns.
Leave a Reply
Want to join the discussion?Feel free to contribute!