Extracting Supply Forecasts from Oil Futures
We thought it would be interesting to expand a little more on the notion that crude oil prices reflect the market’s confidence that oil in the future will be available on approximately the same terms as today (see Oil Futures Say Shale’s Here to Stay). The tool we’re using is the two year spread – the difference between the spot price of crude and the futures price two years hence. The chart below plots spot Brent crude and this two year differential. We used Brent because it’s more reflective of the global oil price. Until late 2015 U.S. crude oil exports were limited to Canada, so the U.S. benchmark WTI reflects some price distortions caused by the export ban. However, it broadly conveys the same information as Brent.

From 2010-2014, with crude oil above $100, the two year spread was negative (known as in backwardation). Crude futures two years out were trading at $5-$15 less than spot. This was the time of the great ramp up in U.S. shale output, and although export constraints kept it in the U.S. by reducing U.S. imports the global market felt its effects.
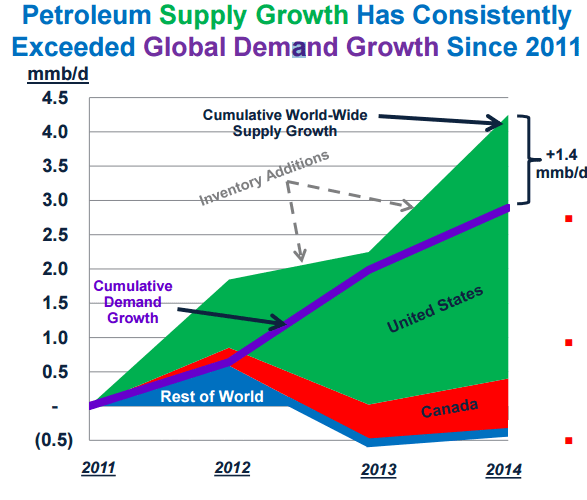
In 2014, Plains All American published a great chart which showed that North American output had been equivalent to fully all of the new global demand for crude oil over the prior four years. As we all know, OPEC responded to this concurrent loss of market share by allowing prices to collapse later that year.
As spot crude dropped, the two year spread moved sharply positive (known as contango). There are many factors driving the slope of the crude curve, not least of which is storage for near term contracts. High levels of inventories will tend to depress spot prices versus future ones, so the spread offers a guide with these caveats. With that said, two years ago the market was signaling that supply would only be available at sharply higher prices. The market was reflecting an expectation that OPEC’s strategy of bankrupting large swathes of the U.S. shale industry would be successful. Had it happened, the drop in supply would have allowed crude to return to substantially higher prices and vindicated OPEC’s strategy.
OPEC conceded defeat in November and agreed to cut production. This allowed prices to rise and in recent months has brought the two year spread back towards $0. Today’s oil prices reflect confidence that future supply will be available on roughly the same terms as today. Since capex commitments into conventional oil plays keep falling (see Why Shale Upends Conventional Thinking) and shale is bucking the trend with increased drilling budgets by the Exploration and Production (E&P) companies active there, a logical inference is that oil traders expect continued increases in shale output.

The success of shale drilling is due in no small part to continued technological innovation. E&P companies such EOG and Pioneer include examples of the impact of IT on their activities. American technological innovation is increasingly what’s driving the Shale Revolution. Below are six slides from earnings presentations to illustrate:

Fracking 3.0 focuses on more targeted areas supported by detailed geological analysis to identify the best spots to drill. It also uses more grades of sand including very fine grains, resulting in greater variety of cracks being propped open as the water/sand mixture ruptures the rock.

Often the drill bore used to drill the well is remotely guided by an operator sitting in a control room miles away. Increasing data mining allows for greater precision in drilling the most productive spots.

Artificial Intelligence and Predictive Analytics play a role. Often, today’s oil drillers leave their hard hat at the door to sit in front of a computer screen.

This slide from EOG illustrates the extraordinarily deep layer of exploitable rock formation in the Delaware (Permian) Basin in West Texas, compared with much shallower opportunities in the Eagle Ford (South Texas) and Bakken (North Dakota). They compare the thickness of the Delaware Basin play with the distance from Battery Park in lower Manhattan to City Hall. The Permian makes possible multi-layer drilling which greatly improves the economics. It’s why there is so much interest in the Permian.

This illustrates how EOG has been able to raise the percentage of its wells defined as “Premium Standard” based on meeting a certain minimum After Tax Rate of Return (ATROR). On their earnings call last week EOG had Sandeep Bhakhri, Chief Information and Technology Officer. Bhakri provided a summary of EOG’s intense use of data to make accurate, fast decisions. EOG is a leader in providing actionable data to front-line personnel which allows them to adapt drilling plans as they receive new information. As he said, “We built 10 web-based self-service applications, eliminating the need for employees to ask each other what questions and to instead focus on why and how questions.”

Finally, this slide is EOG’s analysis of the required break-even for various sources of crude supply globally. U.S. shale is the swing producer because its opportunities are short-cycle, able to return capital invested within a matter of quarters. But shale is no longer the marginal producer. Based on this chart, the price of crude oil will eventually need to move higher in order to draw enough supply to meet demand.
E&P companies are the customers of MLPs, so their success is obviously important. Recent earnings reports from E&P companies, as well as the energy infrastructure businesses that are vital in getting their hydrocarbons to market, support growing output. This is confirmed by the U.S. Energy Information Administration, which recently increased its forecast of U.S. crude output to an average of 9.3 MMB/D for 2017 and nearly 10.0 MMB/D in 2018.
This greater certainty about future supply is reflected in the narrowing dispersion of price forecasts for crude oil (see U.S. Oil Output Continues to Grow). Steadily growing hydrocarbon output is expected by the energy industry and the U.S. Federal government. Even OPEC expects more U.S. oil production; last week they increased their forecast U.S. growth by 285K barrels a day, to 820K. It’s a factor causing OPEC to likely extend last year’s production cuts, which further concedes market share to shale. The only place where growing U.S. output is seemingly not expected is in the stock prices of MLPs, as investors know only too well. The last chart, from midstream business Enterprise Products (EPD), shows that it’s not only U.S. E&P companies expecting the market to balance at current/planned levels of supply.

The strong correlation between crude and MLPs from 2015 is well remembered by many and is part of the history of every risk model, which probably reinforces today’s connection. But the continued operating efficiencies of U.S. shale drillers are supporting higher levels of production at lower prices than many investors expected. A key difference between 2015 and today is the two year oil spread, which reflects a far more positive view of sustaining domestic production than was the case during the MLP Crash. MLP investors shaken by the recent drop in the sector would do well to consider the information reflected in other markets.
We are invested in EPD

Important Disclosures
The information provided is for informational purposes only and investors should determine for themselves whether a particular service, security or product is suitable for their investment needs. The information contained herein is not complete, may not be current, is subject to change, and is subject to, and qualified in its entirety by, the more complete disclosures, risk factors and other terms that are contained in the disclosure, prospectus, and offering. Certain information herein has been obtained from third party sources and, although believed to be reliable, has not been independently verified and its accuracy or completeness cannot be guaranteed. No representation is made with respect to the accuracy, completeness or timeliness of this information. Nothing provided on this site constitutes tax advice. Individuals should seek the advice of their own tax advisor for specific information regarding tax consequences of investments. Investments in securities entail risk and are not suitable for all investors. This site is not a recommendation nor an offer to sell (or solicitation of an offer to buy) securities in the United States or in any other jurisdiction.
References to indexes and benchmarks are hypothetical illustrations of aggregate returns and do not reflect the performance of any actual investment. Investors cannot invest in an index and do not reflect the deduction of the advisor’s fees or other trading expenses. There can be no assurance that current investments will be profitable. Actual realized returns will depend on, among other factors, the value of assets and market conditions at the time of disposition, any related transaction costs, and the timing of the purchase. Indexes and benchmarks may not directly correlate or only partially relate to portfolios managed by SL Advisors as they have different underlying investments and may use different strategies or have different objectives than portfolios managed by SL Advisors (e.g. The Alerian index is a group MLP securities in the oil and gas industries. Portfolios may not include the same investments that are included in the Alerian Index. The S & P Index does not directly relate to investment strategies managed by SL Advisers.)
This site may contain forward-looking statements relating to the objectives, opportunities, and the future performance of the U.S. market generally. Forward-looking statements may be identified by the use of such words as; “believe,” “expect,” “anticipate,” “should,” “planned,” “estimated,” “potential” and other similar terms. Examples of forward-looking statements include, but are not limited to, estimates with respect to financial condition, results of operations, and success or lack of success of any particular investment strategy. All are subject to various factors, including, but not limited to general and local economic conditions, changing levels of competition within certain industries and markets, changes in interest rates, changes in legislation or regulation, and other economic, competitive, governmental, regulatory and technological factors affecting a portfolio’s operations that could cause actual results to differ materially from projected results. Such statements are forward-looking in nature and involves a number of known and unknown risks, uncertainties and other factors, and accordingly, actual results may differ materially from those reflected or contemplated in such forward-looking statements. Prospective investors are cautioned not to place undue reliance on any forward-looking statements or examples. None of SL Advisors LLC or any of its affiliates or principals nor any other individual or entity assumes any obligation to update any forward-looking statements as a result of new information, subsequent events or any other circumstances. All statements made herein speak only as of the date that they were made. r
Certain hyperlinks or referenced websites on the Site, if any, are for your convenience and forward you to third parties’ websites, which generally are recognized by their top level domain name. Any descriptions of, references to, or links to other products, publications or services does not constitute an endorsement, authorization, sponsorship by or affiliation with SL Advisors LLC with respect to any linked site or its sponsor, unless expressly stated by SL Advisors LLC. Any such information, products or sites have not necessarily been reviewed by SL Advisors LLC and are provided or maintained by third parties over whom SL Advisors LLC exercise no control. SL Advisors LLC expressly disclaim any responsibility for the content, the accuracy of the information, and/or quality of products or services provided by or advertised on these third-party sites.
All investment strategies have the potential for profit or loss. Different types of investments involve varying degrees of risk, and there can be no assurance that any specific investment will be suitable or profitable for a client’s investment portfolio.
Past performance of the American Energy Independence Index is not indicative of future returns.
Leave a Reply
Want to join the discussion?Feel free to contribute!