Crude and MLPs March Higher Together
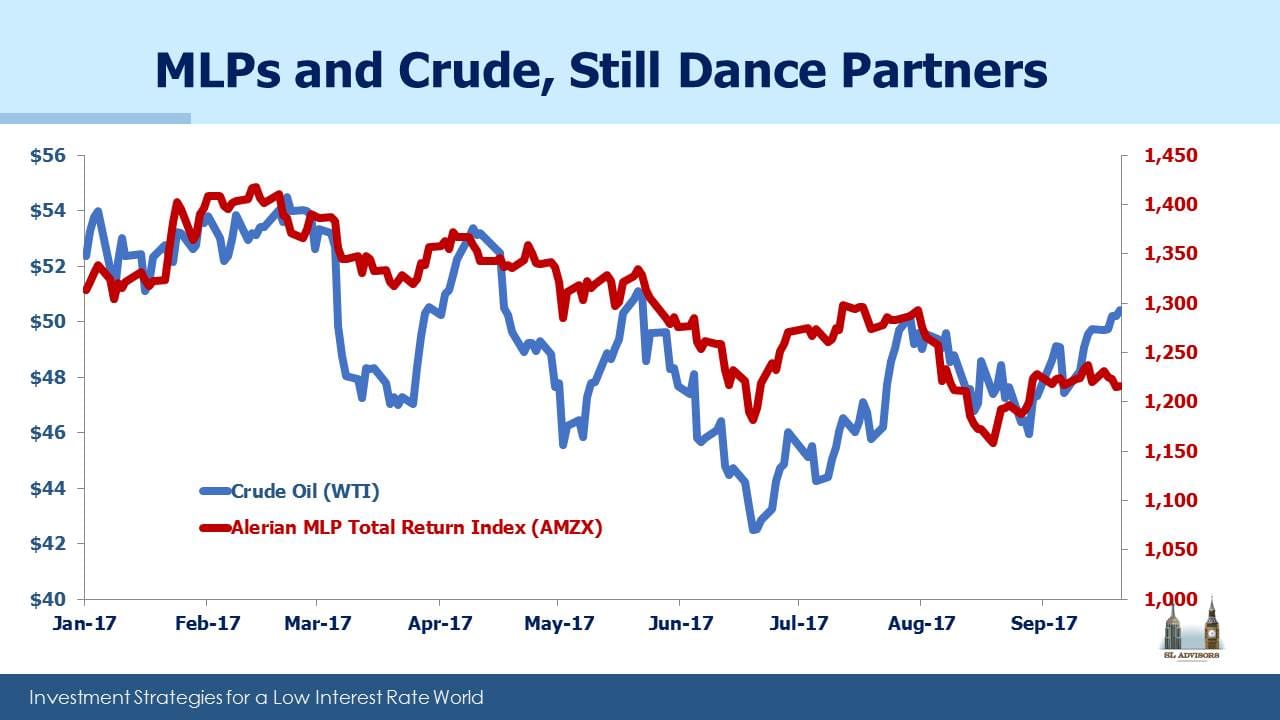
For the first half of the year crude oil prices moved irregularly lower before bottoming in June, since when they’ve moved smartly higher. Master Limited Partnerships (MLPs) have roughly followed this path, and have also moved smartly higher in recent weeks. Non-crude cashflows drive MLP operating performance, but crude drives investor sentiment. No amount of typing by this blogger will shake the relationship between the prices of MLPs and crude.
Interestingly though, U.S. crude oil production has continued to grow all year, seemingly impervious to prices. From 8.85 Million Barrels a Day (MMB/D) in January, output reached 9.2 MMB/D in June. Hurricane season caused a slight late Summer dip in the Gulf of Mexico, but the Energy Information Administration (EIA) is forecasting an average of 9.3 MMB/D for the full year. Production is therefore forecast to continue rising into 2018, for which the EIA is forecasting 9.8 MMB/D. That would eclipse the prior record of 9.6 MMB/D set in 1970. America is Great!
Longer term oil forecasts from both the EIA and the International Energy Agency (IEA) are for rising prices. The EIA’s International Energy Outlook 2017 models crude oil roughly $25 higher by 2020. The IEA goes even further, warning of the risk of a price spike by 2020. They cite growth in annual demand of 1.6MMB/D (around 1.7%) as well as too little new investment in new sources of production. They note that spare capacity (mostly OPEC) of 2 MMB/D doesn’t even cover two years of growth in demand, and expect OPEC to eventually abandon their production limits.
As an aside, a friend recently told me about an investor he knows who is convinced oil prices will collapse as consumers flock to electric vehicles (EVs) and shun the internal combustion engine. That is almost certainly not going to happen. In fact, depressed crude oil would be just about the worst thing for Tesla fans, because it would hurt their competitiveness. High oil prices combined with strong demand for EVs is a possibility; low oil prices and disinterest in EVs is another. Cheap gasoline will dampen the enthusiasm of those opting for environmentally-inspired transportation choices. Moreover, internal combustion engine technology improvements continue to reduce emissions, narrowing the gap with EVs.
The EIA expects overall energy use to grow worldwide even while energy intensity drops (meaning it’s used more efficiently for a given level of GDP). Other than coal, all sources of energy will see growing production with renewables growing the fastest. Non-OECD Asia is responsible for most of the forecast growth in energy consumption through 2040, including 80% of the growth in petroleum and other liquid fuels.
During the 2015 collapse in crude prices, U.S. production dipped but surprised many (including OPEC) at how robust it stayed. The drop in crude early this year didn’t seem to affect domestic output at all. We now seem to be moving into a period of rising prices combined with rising production. U.S. shale output just isn’t growing fast enough to satisfy the 1.6 MMB/D in new demand noted above as well as offset global depletion (estimated at 3-4 MMB/D annually; see Why Shale Upends Conventional Thinking). The world needs another 5-6 MMB/D in new supply, annually. Rising prices will stimulate shale drillers into more activity, but not enough to depress prices.
In presenting their latest forecast, IEA oil markets head Neil Atkinson conceded, “We underestimated the resilience of U.S. shale producers. We failed to understand the resilience. We failed to appreciate the technical ingenuity.” In other words, the IEA underestimated America. So did OPEC last year (see OPEC Blinks). Both the EIA and the IEA have had to recalibrate their models to reflect the ongoing success of U.S. shale (see Oil Forecasters Have to Work Harder).
Rising crude prices along with rising U.S. output could be just as potent for energy infrastructure stocks as the opposite combination was bad in 2015. Moreover, it’s not only crude output that is rising; the EIA is forecasting natural gas production to average 73.7 Billion Cubic Feet per Day (BCF/D) in 2017. This is up 1.4 BCF/D from 2016, and in 2018 a further jump of 4.4 BCF/D is expected.
Clearly, for the U.S. energy sector, its best days are still ahead.
Below is a new trademarked logo we have designed for our energy infrastructure business. We believe the Shale Revolution is leading to American Energy Independence, and our investment choices increasingly reflect the search for those businesses that will most clearly benefit. Expect to see more of this logo in the months ahead.
Important Disclosures
The information provided is for informational purposes only and investors should determine for themselves whether a particular service, security or product is suitable for their investment needs. The information contained herein is not complete, may not be current, is subject to change, and is subject to, and qualified in its entirety by, the more complete disclosures, risk factors and other terms that are contained in the disclosure, prospectus, and offering. Certain information herein has been obtained from third party sources and, although believed to be reliable, has not been independently verified and its accuracy or completeness cannot be guaranteed. No representation is made with respect to the accuracy, completeness or timeliness of this information. Nothing provided on this site constitutes tax advice. Individuals should seek the advice of their own tax advisor for specific information regarding tax consequences of investments. Investments in securities entail risk and are not suitable for all investors. This site is not a recommendation nor an offer to sell (or solicitation of an offer to buy) securities in the United States or in any other jurisdiction.
References to indexes and benchmarks are hypothetical illustrations of aggregate returns and do not reflect the performance of any actual investment. Investors cannot invest in an index and do not reflect the deduction of the advisor’s fees or other trading expenses. There can be no assurance that current investments will be profitable. Actual realized returns will depend on, among other factors, the value of assets and market conditions at the time of disposition, any related transaction costs, and the timing of the purchase. Indexes and benchmarks may not directly correlate or only partially relate to portfolios managed by SL Advisors as they have different underlying investments and may use different strategies or have different objectives than portfolios managed by SL Advisors (e.g. The Alerian index is a group MLP securities in the oil and gas industries. Portfolios may not include the same investments that are included in the Alerian Index. The S & P Index does not directly relate to investment strategies managed by SL Advisers.)
This site may contain forward-looking statements relating to the objectives, opportunities, and the future performance of the U.S. market generally. Forward-looking statements may be identified by the use of such words as; “believe,” “expect,” “anticipate,” “should,” “planned,” “estimated,” “potential” and other similar terms. Examples of forward-looking statements include, but are not limited to, estimates with respect to financial condition, results of operations, and success or lack of success of any particular investment strategy. All are subject to various factors, including, but not limited to general and local economic conditions, changing levels of competition within certain industries and markets, changes in interest rates, changes in legislation or regulation, and other economic, competitive, governmental, regulatory and technological factors affecting a portfolio’s operations that could cause actual results to differ materially from projected results. Such statements are forward-looking in nature and involves a number of known and unknown risks, uncertainties and other factors, and accordingly, actual results may differ materially from those reflected or contemplated in such forward-looking statements. Prospective investors are cautioned not to place undue reliance on any forward-looking statements or examples. None of SL Advisors LLC or any of its affiliates or principals nor any other individual or entity assumes any obligation to update any forward-looking statements as a result of new information, subsequent events or any other circumstances. All statements made herein speak only as of the date that they were made. r
Certain hyperlinks or referenced websites on the Site, if any, are for your convenience and forward you to third parties’ websites, which generally are recognized by their top level domain name. Any descriptions of, references to, or links to other products, publications or services does not constitute an endorsement, authorization, sponsorship by or affiliation with SL Advisors LLC with respect to any linked site or its sponsor, unless expressly stated by SL Advisors LLC. Any such information, products or sites have not necessarily been reviewed by SL Advisors LLC and are provided or maintained by third parties over whom SL Advisors LLC exercise no control. SL Advisors LLC expressly disclaim any responsibility for the content, the accuracy of the information, and/or quality of products or services provided by or advertised on these third-party sites.
All investment strategies have the potential for profit or loss. Different types of investments involve varying degrees of risk, and there can be no assurance that any specific investment will be suitable or profitable for a client’s investment portfolio.
Past performance of the American Energy Independence Index is not indicative of future returns.


Leave a Reply
Want to join the discussion?Feel free to contribute!