Monetary Policy Is Increasing The Deficit

Last week the Congressional Budget Office (CBO) released their latest ten year budget projection. It invariably makes for depressing, if unsurprising reading. Significant deterioration in our fiscal outlook is visible with every release.

For example, in February we noted that one particular milestone, the year in which interest on the Federal debt exceeds $1TN, keeps moving closer (see Our Darkening Fiscal Outlook).

In 2022, this was forecast for 2030. A year later the date had drawn two years closer, to 2028. In February it was projected to happen in 2026. And in the CBO’s latest release they now expect Federal interest expense to exceed $1TN next year.

.avia-image-container.av-81yl52-73effdcb10030869cd3485df90592b30 img.avia_image{ box-shadow:none; } .avia-image-container.av-81yl52-73effdcb10030869cd3485df90592b30 .av-image-caption-overlay-center{ color:#ffffff; }

It seems our fiscal outlook is not just getting worse – it’s deteriorating at an increasing pace. Two years ago, 2025 Federal revenues (mostly taxes) were projected to be 17.6% of GDP. Now it’s 17.0%. 2025 spending has gone from 22.3% to 23.5%. Mandatory, discretionary and net interest have all increased – the latter from 2.1% to 3.4% of GDP.

The pandemic-related inflation surge was hugely damaging. It’s consistently among the top concerns of voters, which augurs poorly for Joe Biden’s re-election hopes. It’s made worse because traditional inflation gauges don’t correspond with how consumers experience higher prices. Hedonic quality adjustments, owners’ equivalent rent and even insurance (see Another Inflation Omission) are all subjected to statistical purity which renders them less comprehensible to non-economists. Higher inflation has exacerbated the metric’s impenetrability for many.

.avia-image-container.av-1pfajfq-1131e6375e63f8cf4901f9d653f6bc3b img.avia_image{ box-shadow:none; } .avia-image-container.av-1pfajfq-1131e6375e63f8cf4901f9d653f6bc3b .av-image-caption-overlay-center{ color:#ffffff; }

On top of that, Democrat policies have been inflationary, starting with the $1.9TN stimulus package signed within a few months of Biden’s inauguration. The energy transition is also inflationary – it’s increasing electricity prices and pumping hundreds of billions of dollars into the economy through tax breaks and subsidies.

The resulting tighter monetary policy has been costly. Two years ago, the CBO was projecting the average rate on public debt in 2025 at 2.39%. Now they expect it to be 3.55%. Monetary policy caused the recent fiscal deterioration and is driving our debt higher.

.avia-image-container.av-1bl55l2-87ac0f2c68b271981d86c8a536e530d4 img.avia_image{ box-shadow:none; } .avia-image-container.av-1bl55l2-87ac0f2c68b271981d86c8a536e530d4 .av-image-caption-overlay-center{ color:#ffffff; }

Fed chair Powell has argued that our economic future can only be assured by returning inflation to 2%. A less robust monetary response would have reduced the damage to our debt outlook, but orthodoxy holds that we would ultimately have been worse off.

There are no votes in fiscal prudence. Bill Clinton was the last president to make a serious attempt at reducing the deficit. Our current path is democratic if ill-advised. It demonstrates that democracies are ill-suited to tackle long term problems whose benefits accrue to later generations while the costs are incurred today.

Climate change shares this generational misalignment of interests. The warnings of climate catastrophe are persistent, yet coal consumption continues higher as poorer countries value higher living standards today over a cooler future.

Fiscal catastrophe gets no coverage – on this issue the warnings have worn themselves out. Because we’ve continued to muddle through there’s no urgency to address the issue.

The long term investor has to ponder how this will resolve itself. An onslaught of selling by foreign central banks abandoning hope of fiscal reform was once felt to be a threat. Japan owns $1.1TN and China just under $800BN. They couldn’t sell that much if they tried, and in any case the Fed’s $7.3BN balance sheet could absorb it. If bond yields spiked, the Fed would step in to assure an orderly market. Quantitative Easing has emasculated the bond vigilantes.

Currency debasement has been the refuge of profligate governments for centuries, as I explained over a decade ago in Bonds Are Not Forever; The Crisis Facing Fixed Income Investors. Higher inflation allows for negative real interest rates on debt, a stealth default that is less painful than a sudden one.

.avia-image-container.av-rdjb6u-c974e4ba0ee95f7f7c9301a66f53d5cf img.avia_image{ box-shadow:none; } .avia-image-container.av-rdjb6u-c974e4ba0ee95f7f7c9301a66f53d5cf .av-image-caption-overlay-center{ color:#ffffff; }

The CBO expects the cost of financing our debt to average around 3.4%, 1.4% above the Fed’s inflation target. A 3-4% inflation target would lower the real cost by making it easier for short term rates to be below inflation, if only the Fed would accept it. The support among monetary thinkers for such flexibility is growing. Jay Powell has already modified the FOMC’s interpretation of its dual mandate to allow for temporary inflation overshoots in the interests of maximizing employment. Because this is an asymmetric shift, it means higher than 2% inflation over a cycle.

The voter dissatisfaction with higher inflation is supportive of the Fed’s monetary response but makes it tricky to accommodate the negative real interest rates that will ameliorate our debt outlook.

US Debt:GDP is 1.0X and the Fed owns 15% of our bonds. In Japan the equivalent metrics are 2.4X and 43%. Deflation has been a persistent problem for Japan. But US voters would not long tolerate the anemic GDP growth that accompanied it — 0.6% pa over the past decade in Japan vs 2.5% pa in the US. Fiscal stimulus would be an electoral winner.

This is why higher US inflation remains likely.

We have three have funds that seek to profit from this environment:
Energy Mutual Fund

Energy ETF

Real Assets Fund


Cheniere Keeps Returning Cash

Cheniere Energy Inc (CEI) has come a long way since its founding by Charif Souki in 1996. Three decades ago the US looked likely to be an importer of Liquefied Natural Gas (LNG) as demand outgrew dwindling domestic production. CEI planned to meet the gap with LNG imports. By 2008 the company’s LNG import terminal was ready at Sabine Pass, LA just as the shale revolution was boosting US production. Domestic gas was cheaper than imports.

By 2011 Cheniere was preparing to reverse its flow – planning to export US LNG which was becoming abundant and cheap. Today CEI has 30 Million Tonnes per Annum (MTPA) of capacity at Sabine Pass and another 25 MPTA at its Corpus Christi, TX facility. Their $45BN investment in infrastructure allows them to export 8% of US production.

Souki long ago left CEI, forced out by activist shareholder Carl Icahn in 2015. They disagreed over Souki’s desire to add a marketing capability to CEI which would have provided the ability to speculate on natural gas prices. CEI’s business model is to charge a liquefaction fee for chilling natural gas to around –260 degrees Fahrenheit so it can be loaded onto a tanker.

The long term contracts CEI signs with highly rated counterparties provide cashflow visibility that can justify a high multiple on CEI stock. Speculating on natural gas prices offered less certain results and in Icahn’s view would have depressed the valuation.

We always felt Souki’s risk appetite was excessive. After being fired by CEI he founded Tellurian (TELL). Souki’s bullish view on natural gas prices led him to agree Sale Purchase Agreements (SPAs) with buyers that left Tellurian with the price risk.

During the pandemic TELL’s collapsing stock price resulted in a margin call on Souki, who had leveraged his personal holdings.

Investors didn’t share his enthusiasm for betting on higher prices, and TELL’s failure to secure financing led several SPAs to be canceled as the construction timeline was repeatedly pushed back. Souki was once again pushed out.

Earlier this year the Biden administration announced a pause on new LNG permits. This has left TELL languishing in limbo, unable to make commitments to deliver LNG in the future to potential buyers because there’s no visibility on when their proposed Driftwood LNG terminal will be built.

By contrast NextDecade (NEXT) which was once competing with TELL to sign up buyers, has moved ahead with construction of Stage 1 of their Rio Grande LNG terminal and looks likely to move ahead on Stage 2 by the end of this year.

.avia-image-container.av-5yn93z-43d92109f469667ed67c32d7a7e36d85 img.avia_image{ box-shadow:none; } .avia-image-container.av-5yn93z-43d92109f469667ed67c32d7a7e36d85 .av-image-caption-overlay-center{ color:#ffffff; }

Creating another CEI is the goal of both companies. With their recent update on capital allocation, CEI showed why others want to emulate them.

Although CEI’s $45BN outlay shows LNG terminals require enormous capital commitments, once built the ongoing maintenance capex is modest. CEI reinvests the smallest percentage of EBITDA in the midstream infrastructure sector on upkeep of their existing assets.

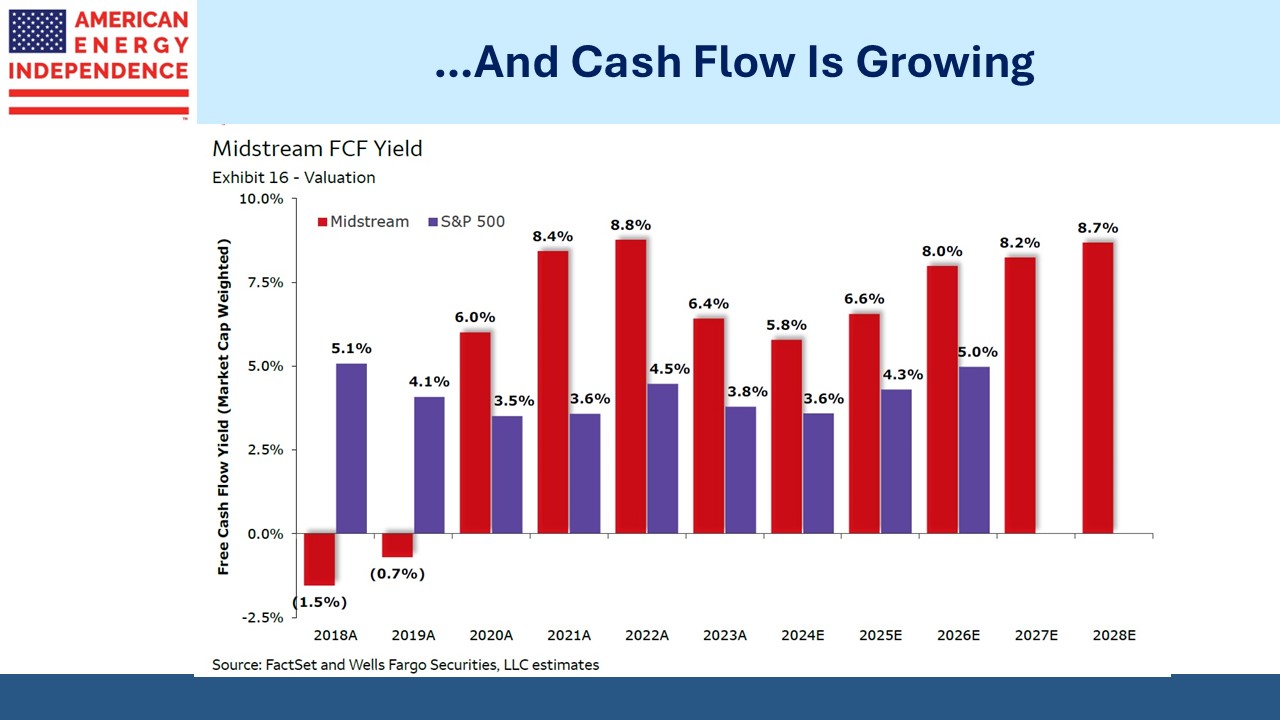
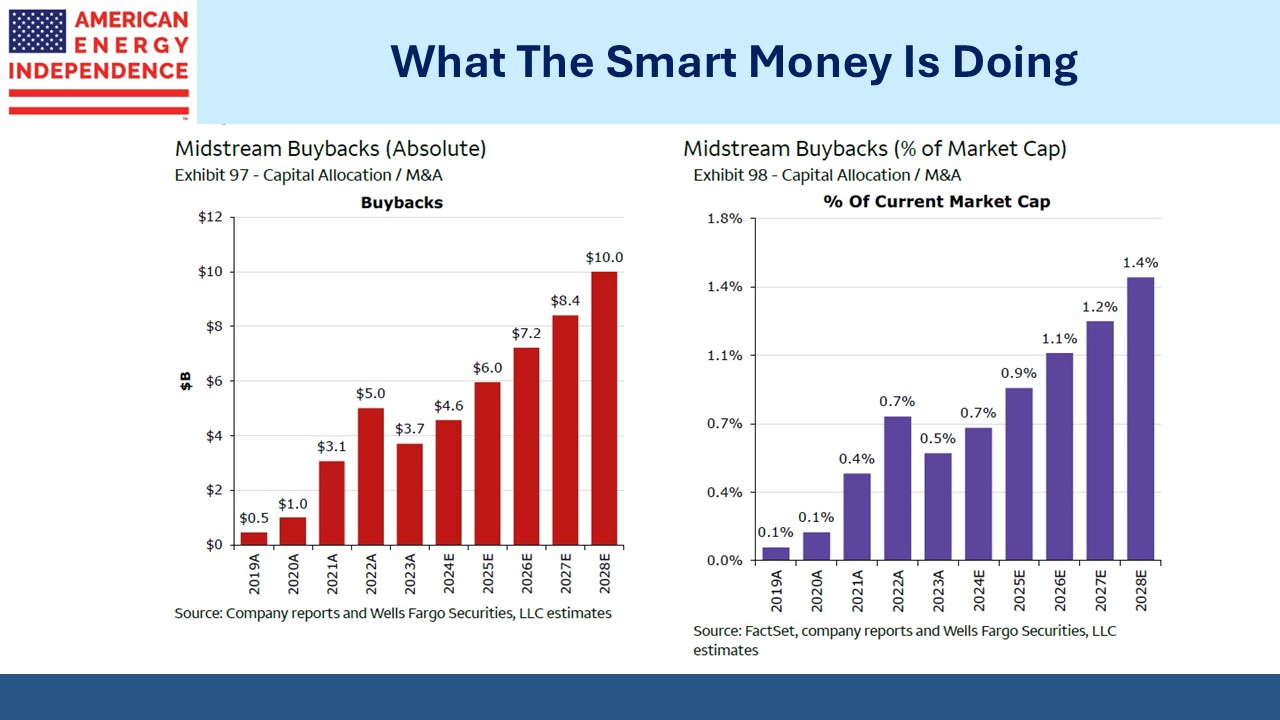
This has led free cash flow to boom. They increased their share buyback authorization by $4BN and are aiming to retire 10% of their outstanding shares by 2027. Past share repurchases since 2022 have already retired over 10% of their sharecount.

.avia-image-container.av-17f3x4v-562dd47eee585cf759c0ae1488d0131d img.avia_image{ box-shadow:none; } .avia-image-container.av-17f3x4v-562dd47eee585cf759c0ae1488d0131d .av-image-caption-overlay-center{ color:#ffffff; }

Having instituted a dividend in 2021, CEI is targeting 10% growth and a 20% payout ratio. They expect to deploy $20BN in new capital on expansion projects by 2026 while also reaching >$20 per share in Distributable Cash Flow (DCF), around a 12% DCF yield based on their current stock price. They’re targeting an investment grade balance sheet with 4X Debt:EBITDA which will further reduce their cost of financing.

CEI plans to add 35 MTPA of capacity to the 55 MTPA already in operation, maintaining their dominant position in US LNG exports. Their shipments are 95% contracted through the mid 2030s with highly rated counterparties including Petrochina, South Korea’s Kogas, Spain’s Iberdrola and Shell. Williams Companies and Kinder Morgan are among those providing supporting natural gas infrastructure.

.avia-image-container.av-oq5o2n-ba35ee9742070b644dec90e0054a1d3f img.avia_image{ box-shadow:none; } .avia-image-container.av-oq5o2n-ba35ee9742070b644dec90e0054a1d3f .av-image-caption-overlay-center{ color:#ffffff; }

Exporting LNG is an attractive business model because the infrastructure only gets built when enough SPAs are in hand to obtain financing. 75% of recoverable US natural gas can be profitable at under $4 per Million BTUs, assuring US LNG exports will benefit from cheap supply.

Investors didn’t lose $BNs on TELL because they couldn’t raise much capital. Construction barely started on Driftwood. The cash wasn’t there.

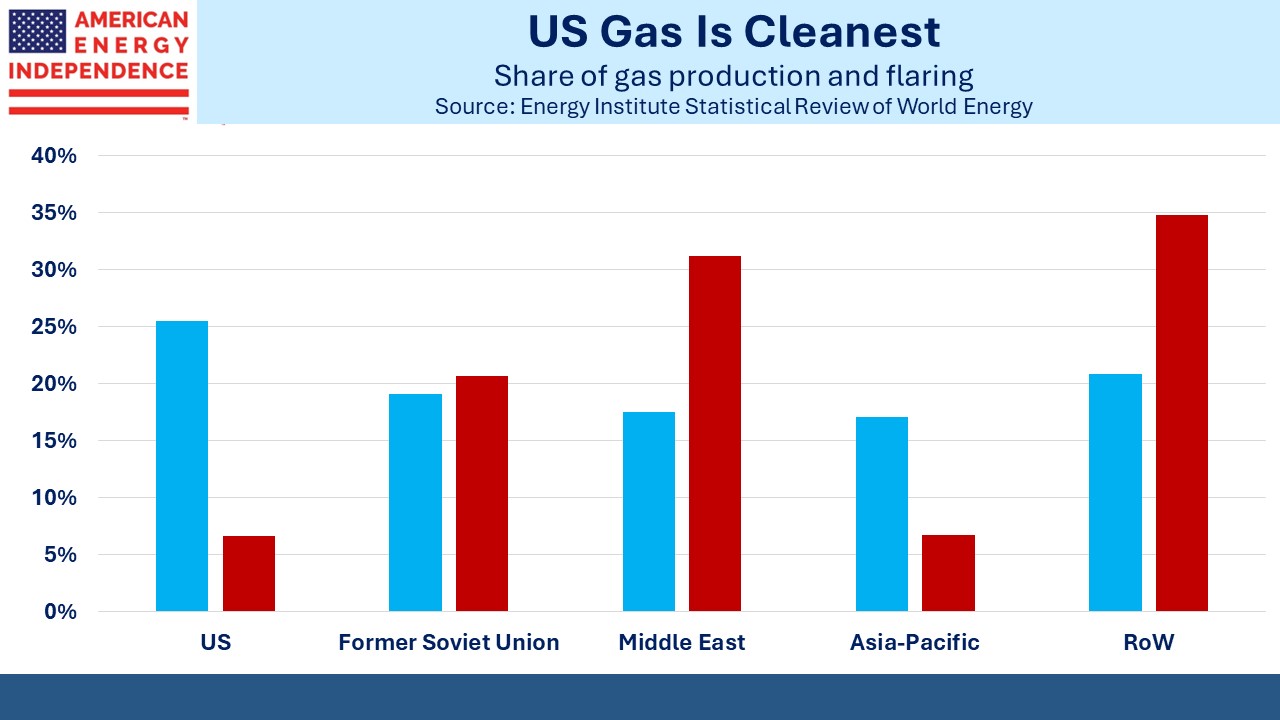
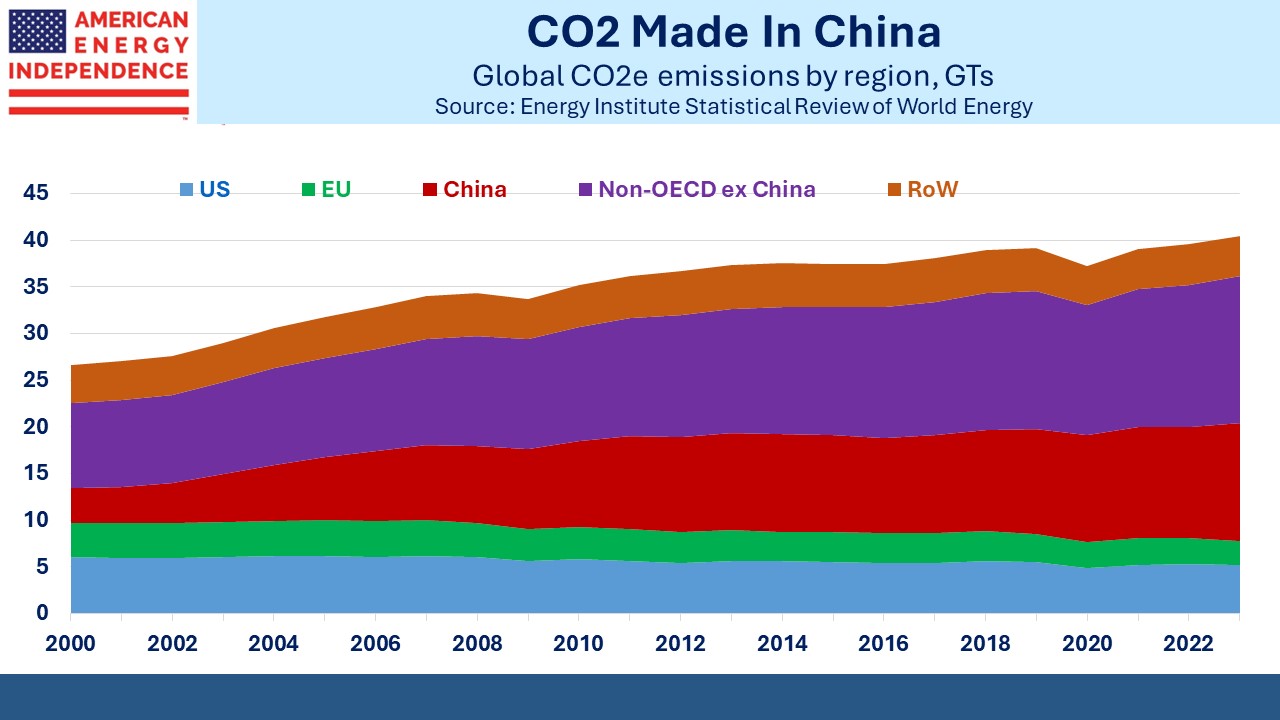
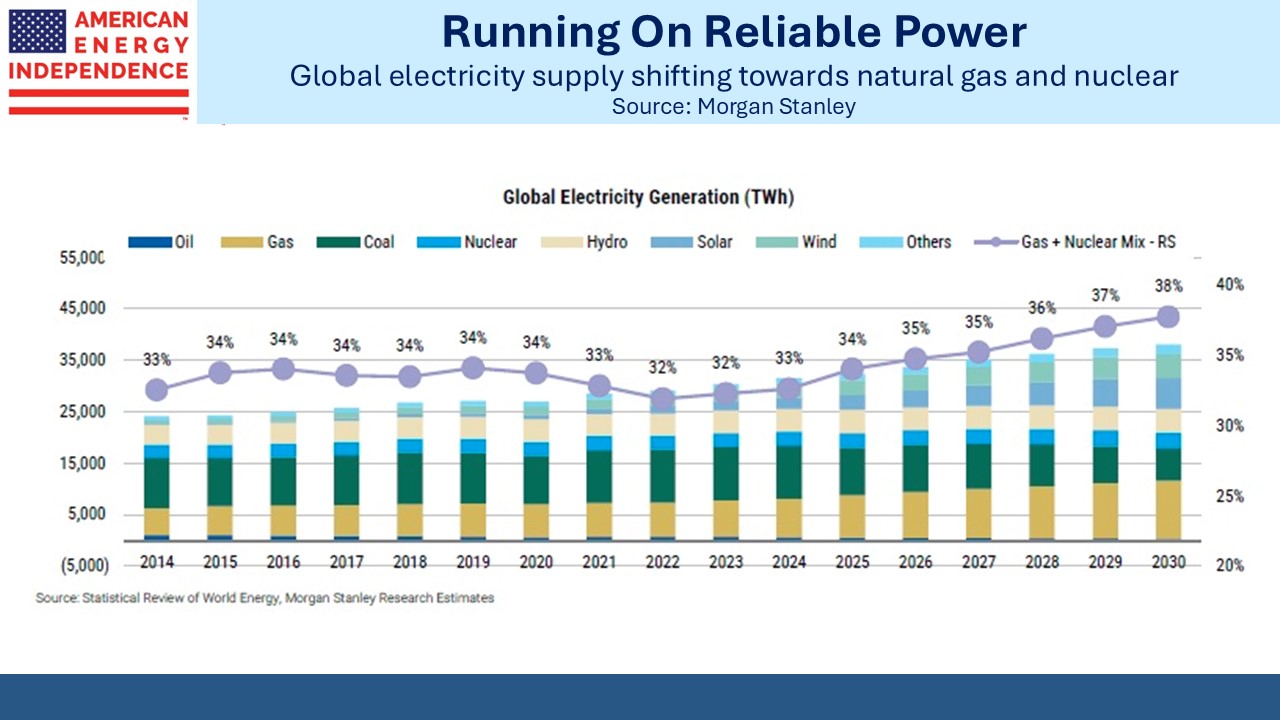
Global coal consumption continues to grow. Natural gas burns with around half the greenhouse gas emissions and can substitute for power generation and many other uses. People who think seriously about the most effective ways to mitigate global warming know US LNG is an important part of the solution. Cheniere’s exports will be in demand for decades to come.

We have three have funds that seek to profit from this environment:
Energy Mutual Fund

Energy ETF

Real Assets Fund


Drilling Down On AI

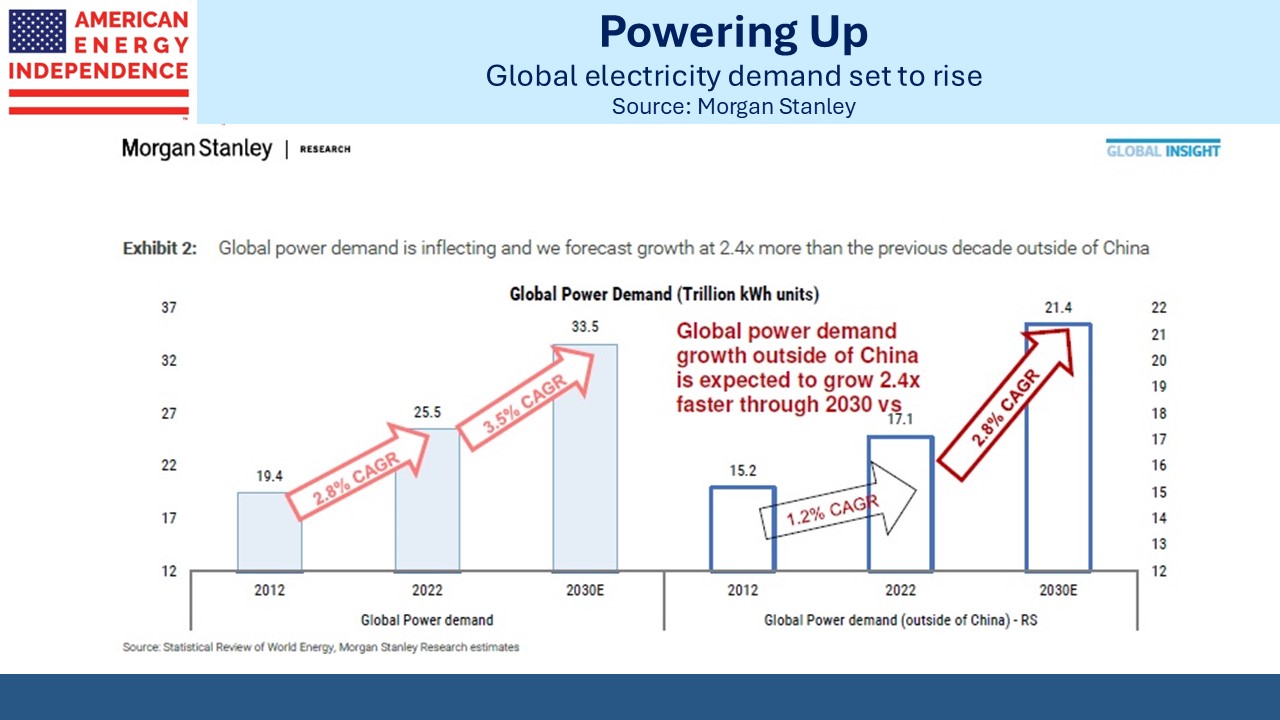
It says something about one company’s dominance of AI chips when a presentation on power demand growth starts with Nvidia’s revenue forecast. But that’s how John Schultz of the Advanced Data Center Consulting Group opened a recent webinar. Unit volumes can be derived from sales, and the number of chips being bought determines the amount of new power demand.

Consequently, AI electricity use is forecast to more than double this year versus 2023.

Blackstone is investing $8BN with data center provider QTS preparing for the AI boom.

AI chips are power hogs, but less appreciated is the need for electricity to cool them as well.  As more computing is packed into smaller spaces, the physical limits of blowing cold air on the equipment are being reached. Combining water with data centers was long rejected by the industry as too risky, but direct to chip liquid cooling is becoming the only practical way to stop the expensive kit from from melting.

Microscopic fragments in the cooling fluid can damage the chips, so stainless steel pipes are required to move PG25 (85% water/15% anti-freeze).  Mesh filters with openings measured at 100 microns – ten times the size of a human blood cell — are used to trap particulates.

Schultz reviewed some of the AI uses already deployed.

Microsoft Office uses Copilot (dubbed “AI for the workplace”) to create powerpoint presentations, write in Word based on an outline and build Excel macros. Google’s Duet aims to compete.

.avia-image-container.av-ncsu0k-c8600ccf4d628593fc1a909bca221bf3 img.avia_image{ box-shadow:none; } .avia-image-container.av-ncsu0k-c8600ccf4d628593fc1a909bca221bf3 .av-image-caption-overlay-center{ color:#ffffff; }

There are important applications in drug research, where development times are coming down sharply. Terray Therapeutics captures 50 terabytes of raw data (more than 12,000 movies) on billions of molecular interactions every day in their quest for new treatments. McKinsey thinks pharmaceuticals have a “once in a century” opportunity.

Interpretation of medical images is 2.5X more effective since AI can learn from 10,000 examples in less than three months whereas a radiologist would need twelve years to see the same number of images.

Finance is using AI-powered chatbots for customer service, to detect fraud and to evaluate investments.

Data center location depends on proximity to its customers. AI training can be done anywhere as long as the data consists of words and text that can be moved easily. Video data requires far more bandwidth, so this type of AI training happens where the video is stored.

Latency is another issue. Microsoft’s Copilot can tolerate latency of 100-250 milliseconds, which means they need fewer data centers (Schultz believes four) across the US to serve most of their customers. Applications requiring less latency need more data centers across the country to reduce the physical distances data must cover to the customer.

Powering the AI revolution will be challenging. Some data centers will rely on dedicated electricity generation, with natural gas an obvious choice. Given the sensitivity of many IT companies to their green credentials, expect much buying of carbon credits and other efforts to offset CO2 emissions.

Solar and wind will require excess generation capacity to compensate for their intermittency. And nobody likes power lines passing over their land.

Microsoft is considering using small modular reactors, but given popular opposition to nuclear power, they’ll need to be in rural areas.

The scale of the jump in power demand is already a political issue. The Electric Reliability Council of Texas (ERCOT) now expects electricity demand to increase to 150GW by 2030, up from 85GW today. Last year their 2030 forecast was for 130GW.

This will challenge the current approach whereby customers sign up for power supply whenever they’re ready. ERCOT CEO Pablo Vegas said more than half the new demand will come from crypto-miners and data centers. Bitcoin production is a misallocation of resources and should be near the bottom of any priority list.

Data centers create few local jobs once they’re built, so there’s the potential for a political backlash if retail electricity prices are perceived to be rising because of AI. Some new customers, such as hospitals, schools and residential areas may receive priority in connecting to the grid.

It is somewhat reminiscent of the dot.com excitement 25 years ago. The internet brought hype but was hugely consequential. Overbuilt fiber-optic networks led to sharply lower communications costs which stimulated demand.

AI hasn’t yet had a discernible impact on how we do our jobs at SL Advisors. I still type every word of every blog, and the videos are me. But the use case examples provide compelling evidence that another computing revolution is underway. Increased power demand will boost natural gas consumption, benefiting companies such as Energy Transfer, Kinder Morgan and Cheniere.

Try googling will AI boost natural gas demand?

Pipeline multiples are still too low, with 6% dividend yields plus 4% growth providing a potential 10% total return.

We have three have funds that seek to profit from this environment:
Energy Mutual Fund

Energy ETF

Real Assets Fund


Serious Energy Forecasts Are Rare

The International Energy Agency (IEA) issued a report forecasting an oil glut by 2030, with 113.8 Million Barrels per Day (MMB/D) of supply capacity versus demand of only 105.4 MMB/D. They expect oil demand to plateau over the next few years. By contrast, OPEC sees continued demand growth, albeit slowing to around 1 MMB/D by 2030.  

The IEA has taken on the role of energy transition cheerleader, and their forecasting is increasingly colored by an optimistic view of the penetration of renewables and EVs. By contrast, capital is flowing more freely towards traditional energy. This is most clearly seen in transactions such as Exxon’s acquisition of Pioneer Natural Resources, or Chevron’s deal to buy Hess.  

.avia-image-container.av-1jfnc3s-1f5dec8f0d8189a01bf982cf2515d098 img.avia_image{ box-shadow:none; } .avia-image-container.av-1jfnc3s-1f5dec8f0d8189a01bf982cf2515d098 .av-image-caption-overlay-center{ color:#ffffff; }

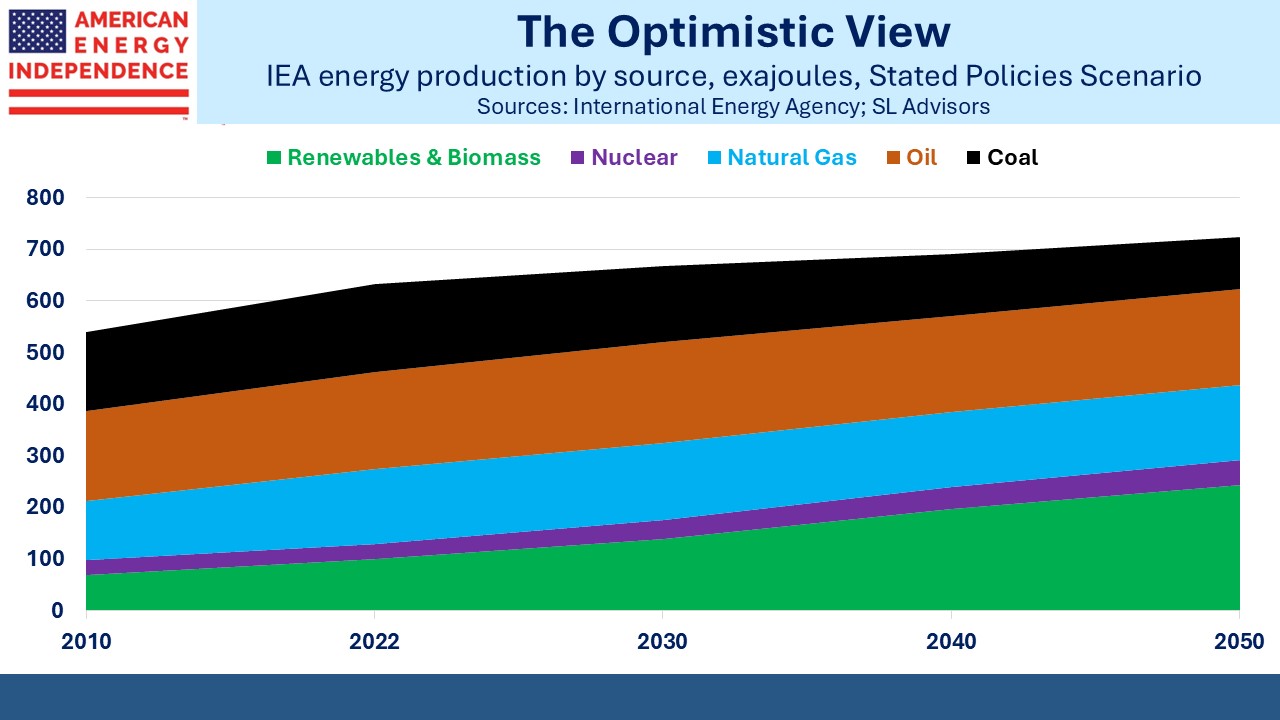
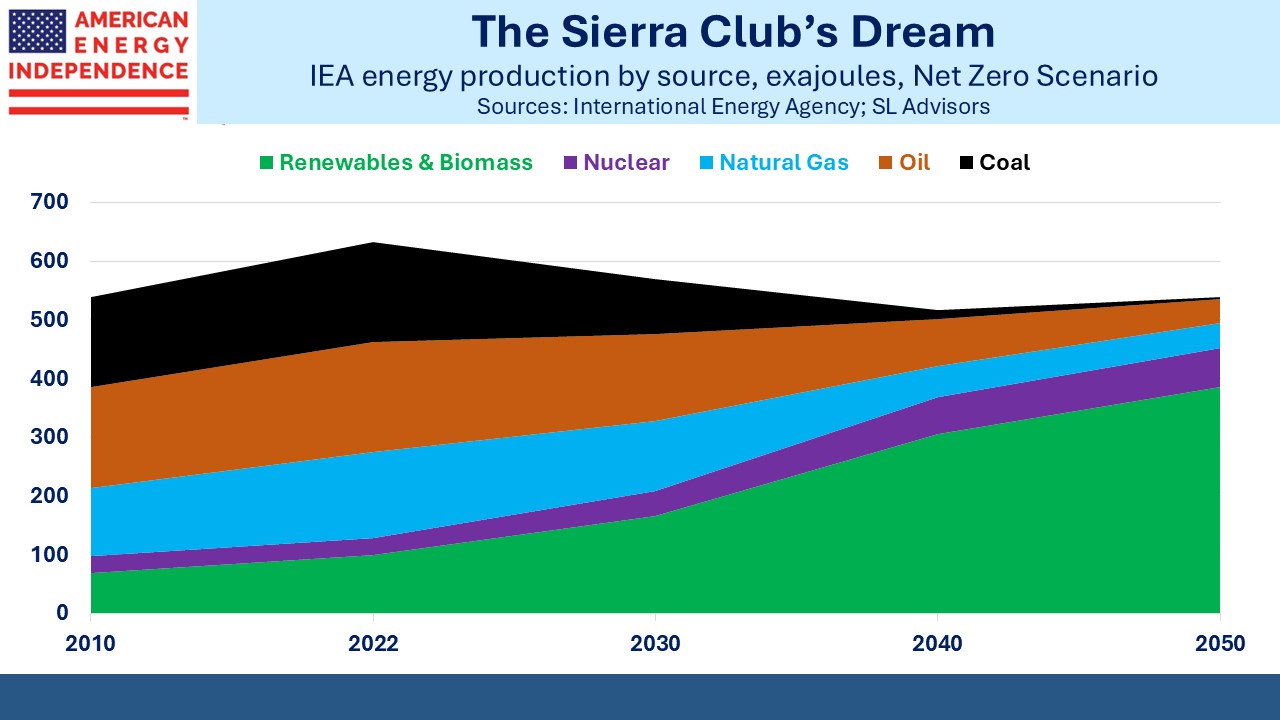
Most long term energy forecasts are intended to support the narrative of a rapid energy transition away from fossil fuels. Few offer a neutral, plausible scenario. The IEA is not alone in their partisan stance. European energy firms are especially sensitive to criticism and understand that the media equates their public outlook with their future exploration and production. BP is so cowed by environmental extremists that all their public forecasts show declining oil and gas consumption. Their Net Zero 2050 scenario sees even less than the IEA’s Net Zero and less than a quarter the demand of ExxonMobil’s outlook. 

My partner Henry and I watched a webinar organized by Wells Fargo featuring Amrita Sen of Energy Aspects. One thing that struck us was how the Administration is trying to control oil prices. They have shown a willingness to vary the imposition of sanctions on Russia to keep prices below $90 a barrel. Sen recounts how a US delegation visited India during a run-up in oil and told them it was now fine to buy Russian oil, sanctions notwithstanding. Lower oil prices allow tighter sanctions.  

.avia-image-container.av-14nz8w8-7ed56845ab3b2a1642217c9a19a78af5 img.avia_image{ box-shadow:none; } .avia-image-container.av-14nz8w8-7ed56845ab3b2a1642217c9a19a78af5 .av-image-caption-overlay-center{ color:#ffffff; }

Another useful insight concerned the growing caution of refineries to invest in costly upgrades given the uncertain long term outlook for refined product demand. Sen thinks this will lead to a tighter global market for gasoline within the next five years.  

The IEA also has an optimistic EV outlook. Energy Aspects sees an increasing shortfall in actual sales versus the IEA, with the EV fleet by 2030 being less than two thirds of the IEA’s forecast. This underpins the warning of an “oil glut” that provided the headline for coverage of the IEA’s latest forecast.  

The US should stop funding the IEA. It’s a waste of money.  

NextDecade (NEXT) had more good news with South Korea’s Hanwha Group announcing a 6.83% stake in the LNG company. Through various subsidiaries Hanwha expects its holding in Next to reach 15%.  

Last week the WSJ published an interactive poll (see What Type of Voter Are You?). If you subscribe to the online version you can see where you rank compared with 1,200 respondents on economic, social and civic dimensions. The point is that only a small minority of us fall neatly into red or blue voters, even though those are the choices on offer. 

.avia-image-container.av-kujip4-67082ee5d45c43f16a44e07da7224b98 img.avia_image{ box-shadow:none; } .avia-image-container.av-kujip4-67082ee5d45c43f16a44e07da7224b98 .av-image-caption-overlay-center{ color:#ffffff; }

I’m on the extreme right on economic issues, favoring deregulation and low taxes; dead center on social issues; and in the 1% of most optimistic on the civic scale. This includes questions such as “How proud are you of America’s history (answer: Very) and agreeing with the statements “The US stands above all countries in the world” and “Life in America is better than 50 years ago for people like you.” 

The last question is self-evidently true based on incomes. But I’m regularly surprised at how negative polls are. Things could always be better, but jobs are plentiful, we’re not at war, life expectancy is improving (although it dipped with the pandemic and opioid crisis) and there’s never been a better time or place to be alive. Things could be a lot worse. I generally see the glass as half full – for most Americans this is easily supported by the facts, and anyway life is more fun that way. Try the survey – it’s brief and your result will probably be interesting.  

Elections overseas reveal voters to be in a surly mood. Right wing parties achieved surprising gains in EU elections. France’s President Macron called a snap election which is looking like a poor decision. Britain’s ruling Conservative party, having delivered Brexit with no discernible benefits, is heading for their biggest loss in a century. And Mexico just elected a populist whose agenda doesn’t look encouraging for the owners of capital.  

These are country-specific issues and don’t represent a political shift. The UK is moving left while France is moving right. But the dissatisfaction perhaps you and your friends feel isn’t limited to the US. You’re just not going to hear it from me.  

We have three have funds that seek to profit from this environment:
Energy Mutual Fund

Energy ETF

Real Assets Fund


The Pipeline Outlook Keeps Improving

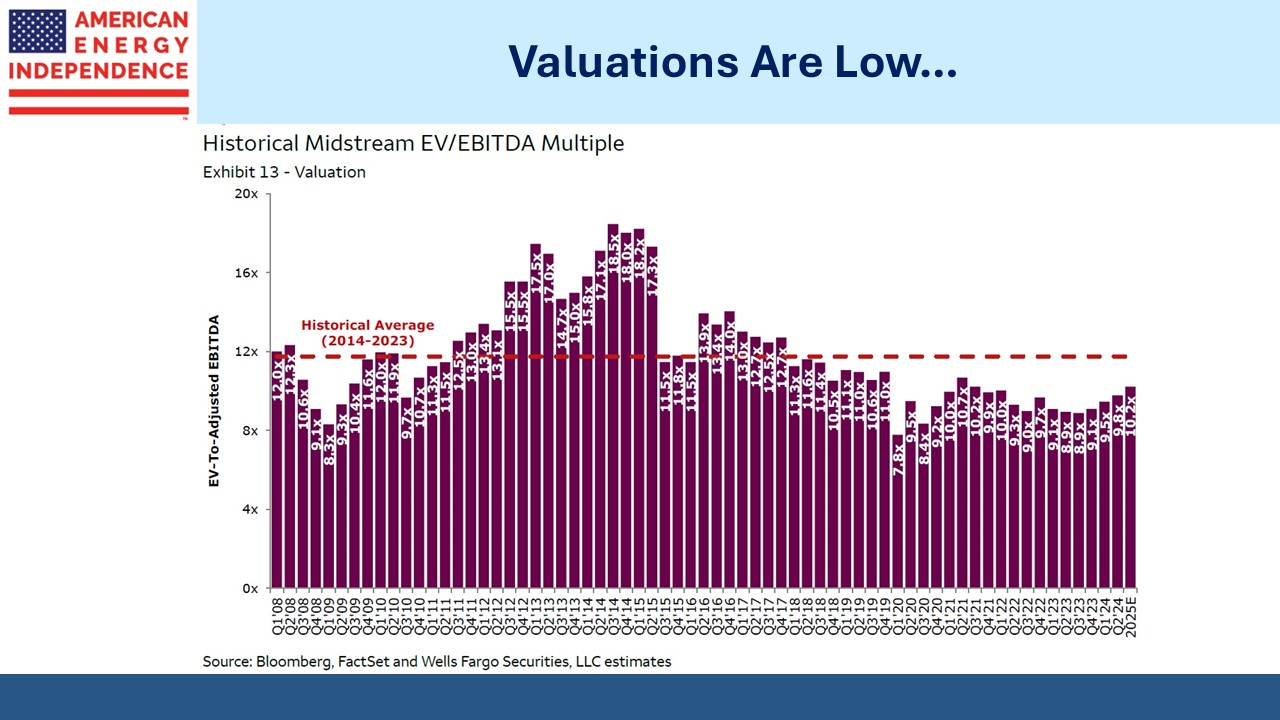
The trend of positive assessments is continuing for the pipeline industry. Sell-side analysts are pressing the case for their favorite names. JPMorgan sees further upside for Targa Resources (TRGP) even though it’s returned 40% YTD. They have a $140 price target for the end of next year, up from ~$120 today. They cite a “fully integrated well-to-dock Permian NGL value chain” and attractive Enterprise Value /EBITDA multiple of 9.0X (2025E) versus a peer group median of 9.7X.

NGLs are natural gas liquids, mostly ethane and propane. The latter is used in agriculture (for crop drying) cooking and heating where natural gas isn’t available, and also as a petrochemical feedstock. NGLs get less attention than oil and gas, but their production has also grown through fracking. US propane exports are now well above 1.5 Million Barrels per Day. They’ve more than tripled in the past decade. TRGP is one of the beneficiaries.

.avia-image-container.av-zwzjy2-cd4a458a9cc2cbe6dac413af27577471 img.avia_image{ box-shadow:none; } .avia-image-container.av-zwzjy2-cd4a458a9cc2cbe6dac413af27577471 .av-image-caption-overlay-center{ color:#ffffff; }

Years ago when MLPs were overinvesting and investors wanted to see reduced capex, then-CEO Joe Bob Perkins would flippantly talk about “capital blessings” on earnings calls where he defended unwelcome big outlays.

Today TRGP has a greater focus on capital discipline, but it’s also fair to note that many of those prior investments have worked out fine.

Wells Fargo recently upgraded several natural gas-oriented names based on attractive valuations and power demand from AI data centers. Some investors are skeptical that enough new power plants will be built to drive the 7 Billion Cubic Feet per Day of increased natural gas demand they expect. New rules from the Environmental Protection Agency require all coal-fired and any new gas-fired power plants operating past 2039 to control 90% of their CO2 emissions, meaning capture and sequestration.

Regulations can always be changed, but the counter is that enough existing power generating plants have available capacity to drive gas demand higher anyway.

Morgan Stanley expects the median pipeline stock to return 21% over the next year, including a 6.1% median dividend yield. Buybacks are supportive of this, with $1.5BN of stock retired during 1Q24. Cheniere was $1.2BN of this and TRGP $124MM.

Some of the best energy analysts in the market remain constructive on the sector.

I’ve been searching for a good energy podcast. Progressive “renewables will solve everything and the world’s on fire” podcasts are abundant and useless. I did stumble on the educational Energy Policy Now and found Power Struggle: The Electric Grid’s Natural Gas Challenge informative. AI will drive the increased demand for natural gas. This drills down into some of the consequences.

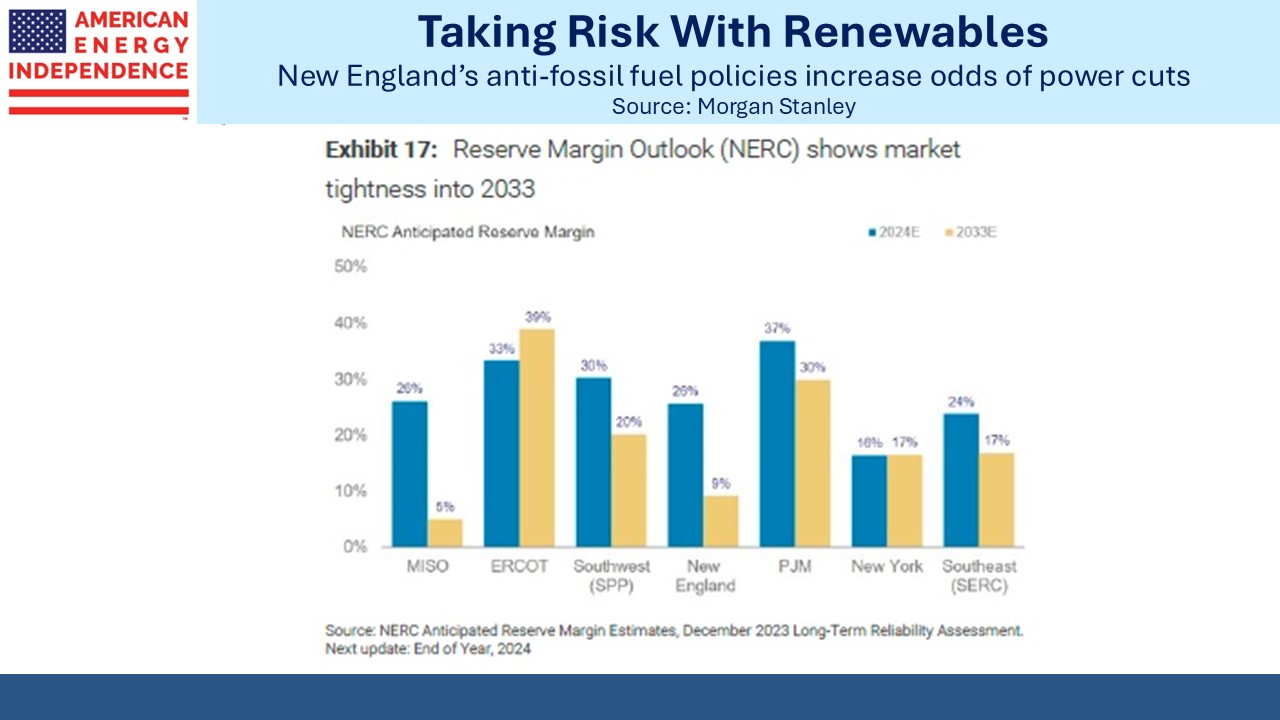
When Storm Uri hit Texas in 2021 it didn’t only highlight the need for winterized natural gas production facilities. Many power plants had natural gas contracts that didn’t guarantee supply, because there’s a big price difference. The Texas grid, run by ERCOT, has tended to place less importance on reliability than the rest of the country in exchange for low prices. Uri led to a reassessment.

At the Federal level, NERC, which oversees electricity, prioritizes reliability while FERC, which regulates interstate natural gas, values safety most highly. Electricity “days” that govern contracts start and end at midnight, whereas gas “days” begin at 10am ET. So a gas-fired power plant faces a mismatch between its pricing for inputs versus outputs.

These problems can be solved more easily than coping with the 20-35% utilization that burdens intermittent solar and wind.

If you enjoy learning about the intricacies of the energy business, you’ll enjoy the podcast. Or you can rely on me to chronicle the highlights.

.avia-image-container.av-n0jaxm-e90d3ddeeed2b2655d616346b83e21dd img.avia_image{ box-shadow:none; } .avia-image-container.av-n0jaxm-e90d3ddeeed2b2655d616346b83e21dd .av-image-caption-overlay-center{ color:#ffffff; }

Once or twice a year I play golf with my old boss from JPMorgan, Don Layton. In 1986 he decided to hire a 23 year old derivatives broker as a trader. It was to my great benefit and hopefully not something he had later reason to regret. Don (often referred to by his initials, DHL) went on to become vice-chair of JPMorgan, running the investment bank. I soon took over interest rate derivates trading in NY.

Later in his career Don was CEO of E*Trade and then Freddie Mac, from 2012-2019.

Don was a terrific leader, with the rare ability to combine strategic vision with command of detail. I’ve remained in touch with many who used to work for Don in the 1980s and 90s. We all retain fond memories and great respect for him. On Monday we reminisced with two other former colleagues, Don Taggart and Don Allison.

DHL remains strongly competitive and draws unseemly pleasure from beating me at golf on one of his home courses. The nostalgia easily compensates.

We have three have funds that seek to profit from this environment:
Energy Mutual Fund

Energy ETF

Real Assets Fund


Another Inflation Omission

The inflation statistics offer a rich trove of counterintuitive methods that often inspire this blogger. It’s an important issue because voters cite inflation, for which they blame Joe Biden, as one of their top concerns. Inflation reports show it’s coming down, although that doesn’t mean earlier price hikes are being reversed, simply that prices are going up more slowly.

The latest statistician’s gem is how the CPI treats insurance, something noted recently in the NYTimes (see Home Insurance Is Clobbering Consumers. Yet It’s Barely Counted in Inflation).

The article notes that the typical homeowner with a government-backed mortgage has seen a 41% increase over five years, 7.1% pa. Many parts of the country have seen bigger increases. This is especially true in Florida, where the only reasonable coverage comes from state-backed Citizens. Our condo building’s policy in Naples is up 54% over the past two years.

The CPI only picks up what renters pay for insurance. This comes back to how economists at the Bureau of Labor Statistics (BLS) treat housing (see Why You Can’t Trust Reported Inflation Numbers). Since the CPI measures goods and services, the BLS estimates the value of shelter (a service) provided by a home (an asset). It’s not an intuitive approach since two thirds of Americans obtain shelter by owning their home. But the BLS uses Owners’ Equivalent Rent which in theory should, over the long run, equate to the cost of owning a home.

Therefore, the CPI omits homeowners’ insurance, because that’s part of the cost of owning an asset and they’re not measuring assets.

The Personal Consumption Expenditure (PCE) index includes home insurance but with a very low weight. They take insurance premiums less underwriting losses and expenses (referred to as the insurers’ combined ratio) to set the weight. In effect they’re looking at the margin insurance companies charge over claims as the service. So if premiums go up 10% to match claims, the PCE index will capture that but if insurers have a 95% combined ratio (ie a 5% profit margin) then the weight will be 1/20th of what it is to the consumer.

Presumably if households self-insured their homes and endured repair and replacement costs that rose 10%, this would flow through fully into the PCE although not the CPI since it’s not concerned with the cost of holding assets.

Insurance expenditures last year were $469BN out of total PCE of $19TN, around 2.5% of disposable income.

It’s an arcane topic and scarcely one that any politician can address in a soundbite. Insurance premiums have been outpacing inflation. It’s another reason why the published inflation statistics aren’t that useful for the typical consumer. There’s no conspiracy –  simply a bunch of economists producing numbers that fit their theoretical models but not the actual experience of Americans. It shows why inflation as perceived by voters is higher than the reported numbers.

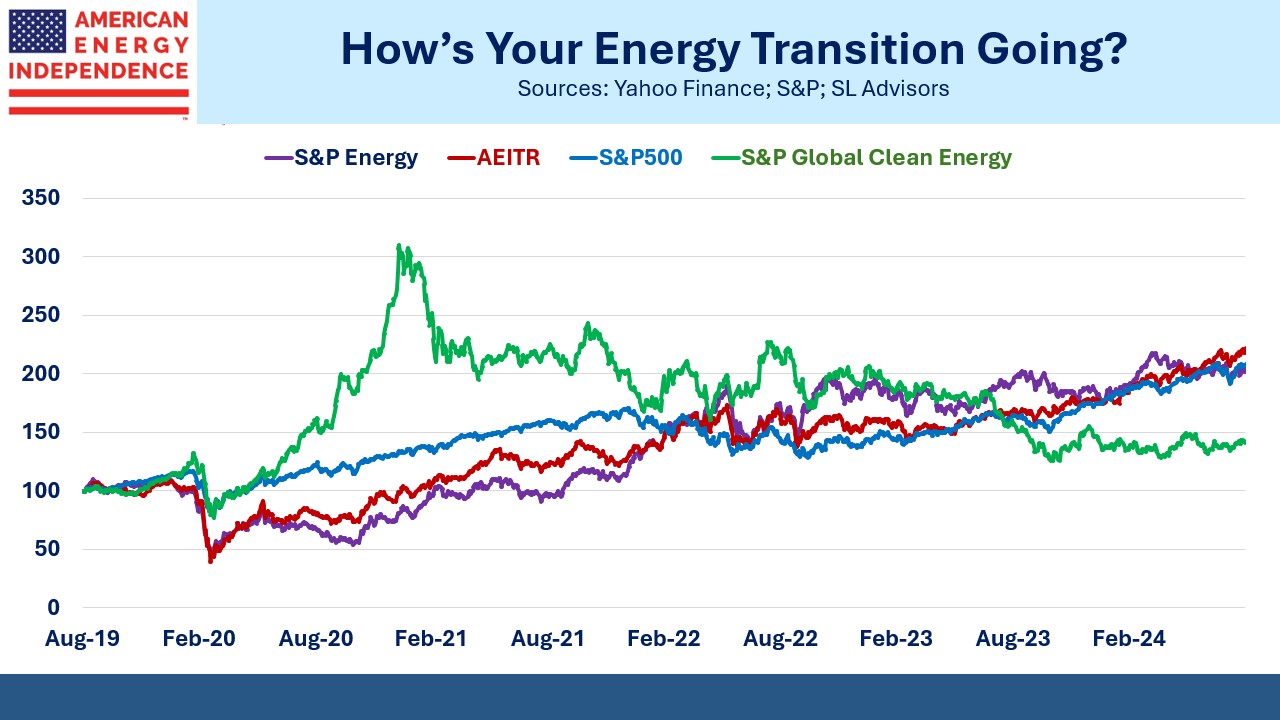
The AI boom continues to improve the fundamentals for natural gas. Wells Fargo recently upgraded Kinder Morgan and Williams Companies to Overweight. A few years ago fears of “stranded assets” caused some to worry that pipelines would lose their customers within a decade or so, greatly reducing the npv of their anticipated cashflows. Since then, renewables stocks have collapsed as energy realism has started to return.

If Enterprise Value/EBITDA (EV/EBITDA) moves from 9X-10X, assuming a 50/50 split between equity and debt the typical company could appreciate by around 20%. Wells Fargo analyst Michael Blum thinks EV/EBITDA multiples for natural gas pipeline companies could eventually increase by around 2.5X.

New York governor Kathy Hochul abandoned the planned congestion charge for New York city, worried about the impact on businesses still recovering from the pandemic. Forcing more travelers onto public transit reduces emissions and should find support among Democrat voters in NY and neighboring New Jersey. But Democrats have mostly failed to convince people that the energy transition is worth paying for.

I endured a two hour, delayed journey on NJ Transit one day last week which made me late for dinner in NY. Public transit from the suburbs isn’t reliable enough.

.avia-image-container.av-1asomtw-8e097ee9cc6ac1e2d47c4e275262ad38 img.avia_image{ box-shadow:none; } .avia-image-container.av-1asomtw-8e097ee9cc6ac1e2d47c4e275262ad38 .av-image-caption-overlay-center{ color:#ffffff; }

A couple of weeks ago I had the opportunity to meet Vlad Zherenovsky from NJ –based Kraner, LLC along with his colleagues Robert Castella and Joe Pandolfo. We chatted about midstream energy, a sector we all agreed offers attractive upside.

Vlad and his family fled Latvia following the collapse of the Soviet Union with their savings wiped out. He finished his education here and went into finance, starting Kraner in 2010. Vlad’s is another immigrant success story.

.avia-image-container.av-u94qes-1d8f169fae29ea401e9e3e92bab23dc4 img.avia_image{ box-shadow:none; } .avia-image-container.av-u94qes-1d8f169fae29ea401e9e3e92bab23dc4 .av-image-caption-overlay-center{ color:#ffffff; }

Bill Shepherd recently turned 98. He is our oldest client, although not by much. Lunch with Bill is always a pleasure as we delve into the intricacies of the energy sector together. His father and mother were both born in England, in 1897 and 1900 respectively. They emigrated to the US and married in Brooklyn, NY in 1924. Like me, Bill is proud of his English heritage.

We have three have funds that seek to profit from this environment:
Energy Mutual Fund

Energy ETF

Real Assets Fund


Blue State Energy Policies

Oregon is typical of many liberal states in that it is reviewing the infrastructure plans of the utilities it regulates. The concern is that too much capital will be invested in new natural gas infrastructure that will subsequently result in “stranded assets” as renewables reduce natural gas demand. The fear is that poor capex decisions will saddle future ratepayers with the cost of un-needed infrastructure as cheap solar and wind gain share.

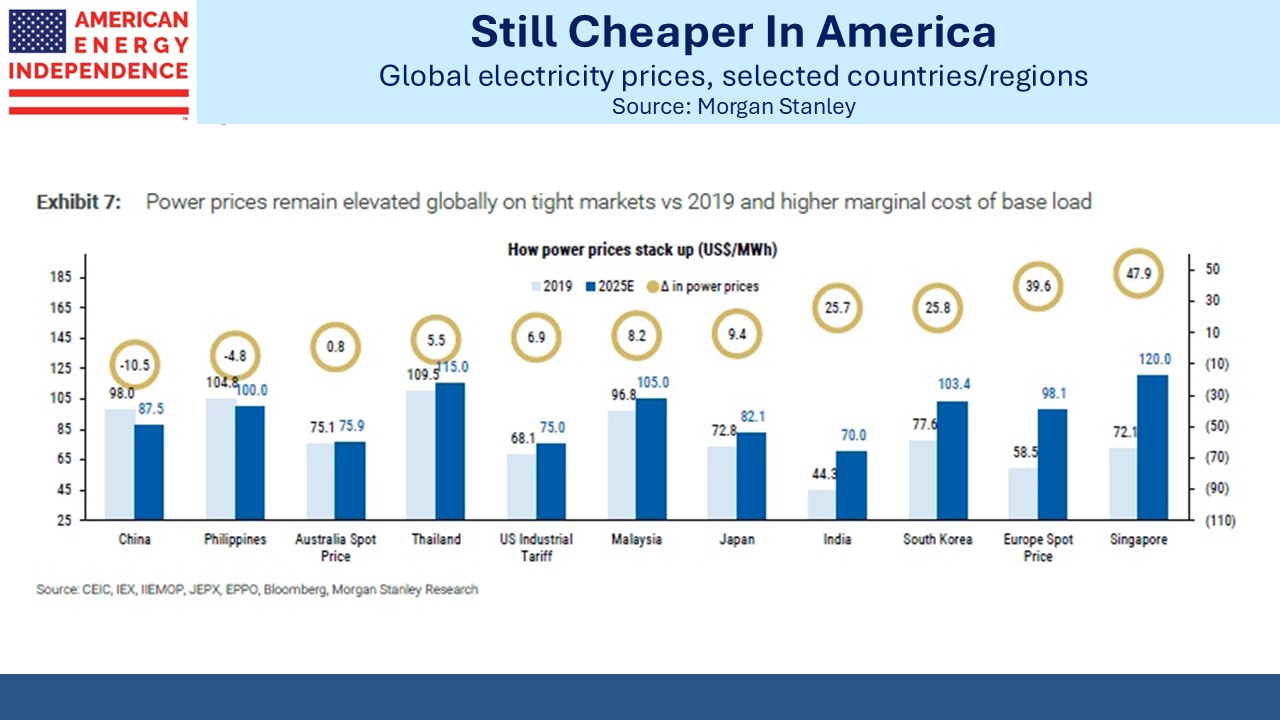
Renewables aren’t cheaper – that theory has been debunked by the rising price of electricity over the past couple of years (see The Inflationary Energy Transition). There’s a case that reducing CO2 emissions is a desirable public policy goal and pursuing it is worth more expensive electricity. Liberals rarely make this case, preferring instead to claim that weather-dependent power costs less in defiance of evidence to the contrary.

So the Oregon Public Utilities Commission is challenging assumptions about future natural gas demand, which they deem “unreasonably optimistic.”

.avia-image-container.av-mmhh1s-b39dd6cfb7b91436099385658c4f680f img.avia_image{ box-shadow:none; } .avia-image-container.av-mmhh1s-b39dd6cfb7b91436099385658c4f680f .av-image-caption-overlay-center{ color:#ffffff; }

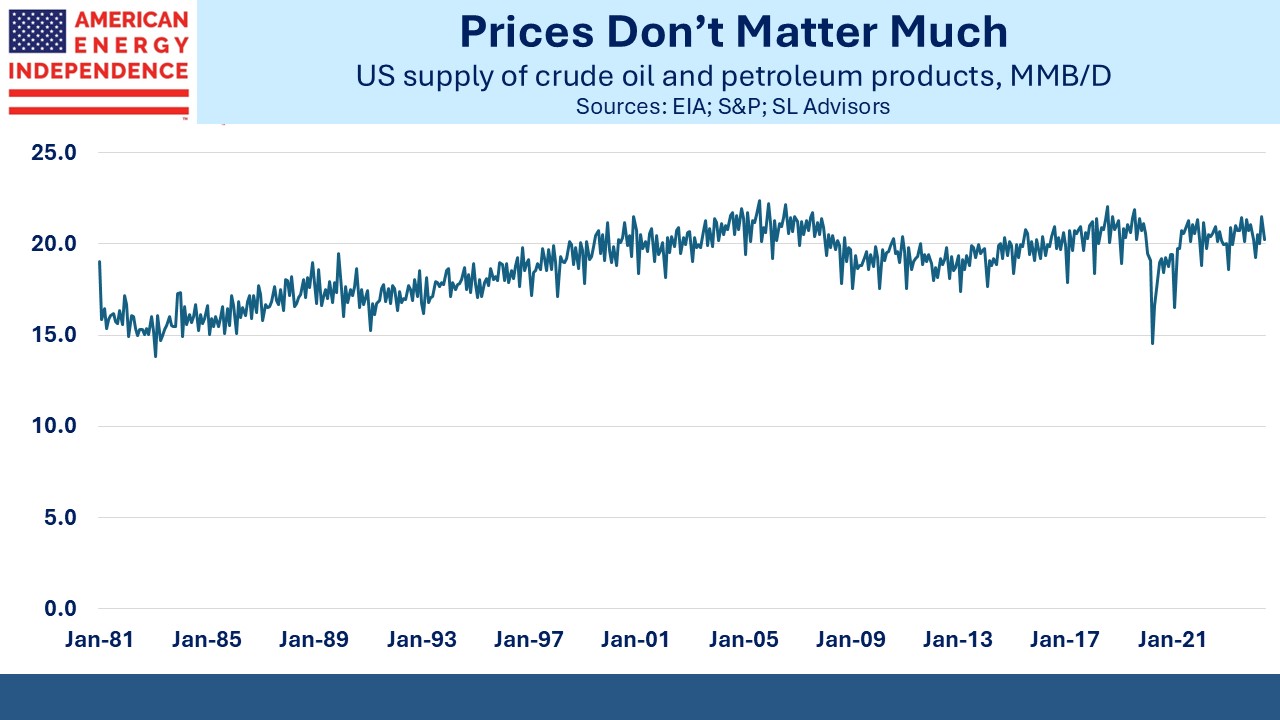
Additions to US natural gas pipeline capacity were a record low in 2022, down 97% from the high five years earlier. It’s helping boost cashflow at pipeline operators because their capex is down but may not always be in the public interest.

By contrast, India’s PM Narendra Modi is pushing to turn India into a “gas-based economy.” The country’s largest steel mill is planning to invest $1BN to help it switch to natural gas, which will reduce its coal consumption and therefore India’s CO2 emissions.

The Indian Oil Corporation recently signed a long-term LNG deal with TotalEnergies, a key investor in NextDecade.

The White House pause on new LNG export permits impedes India’s energy objectives even though they’re in everyone’s interests. India’s JSW Steel is not going to use solar and wind to make steel.

This is why it’s correct to bet on continued growth in demand for US natural gas. The world is shifting to a more realistic energy transition which acknowledges it’ll take generations and that reducing coal consumption anywhere and everywhere is good. As policymakers and businesses adopt practical solutions, the US is well positioned to lead.

Several major European power companies are scaling back their renewables’ targets.  Italian, Spanish and Portuguese electricity prices may be among the highest in the world, but they aren’t high enough to make such investments profitable.

“There has been a big reality check around renewables growth,” said Norman Valentine, head of renewables research at consultancy Wood Mackenzie.

It is against this backdrop that your blogger is replacing an old oil furnace with a new gas one. This requires the local gas company to upgrade our existing gas line to higher capacity, work that is mercifully still permissible in blue New Jersey. In New York, Con Edison requires anyone with a gas service request to accept the “Acknowledgement of the Climate Leadership and Protection Act” which sounds as if they’d rather you didn’t make such a request in the first place.

Heat pumps have outsold natural gas furnaces for the past two years. This doesn’t mean that more homes are installing heat pumps, because some homes may be using more than one unit. For example, we already have one natural gas furnace so will be adding a second.

Heat pumps, which run on electricity, use less energy and are cheaper to operate. This should mean they’ll eventually displace natural gas furnaces. However, their installation is complex and expensive. They also don’t work well with the cast iron radiators in our almost century-old home, which require large volumes of very hot water to operate effectively.

Heat pumps reportedly run less efficiently as it gets cold, when they rely on a backup heating element which is much less efficient. I’d be concerned that they wouldn’t keep the house as warm as I’d like – I have little tolerance for being cold, which is why I spend much of the winter in south Florida.

Unlike our gas furnace, a heat pump would be placed outside where it would be vulnerable to ice formation. Defrosting it would reduce the heat available for the house, probably just when it is most needed. They’re apparently also noisy. They use a longer operating cycle than gas furnaces which means they’re running more of the time.

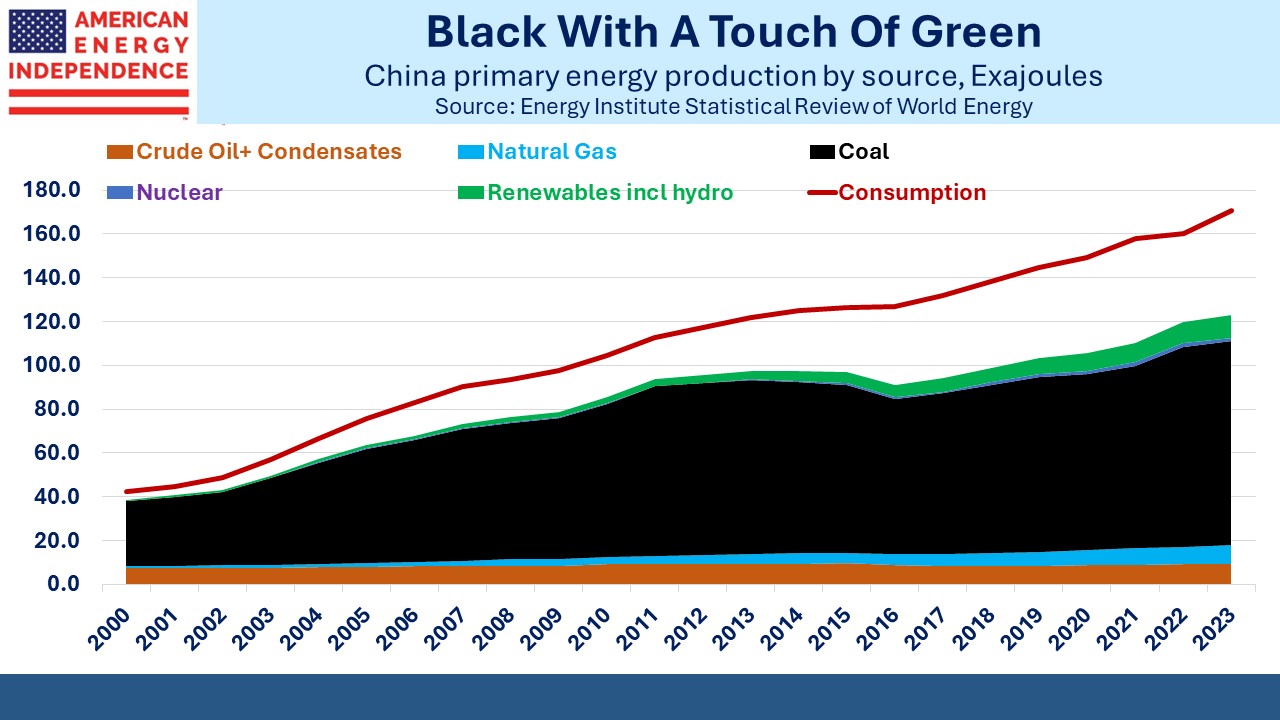
The added gas infrastructure that will enable our additional gas furnace will not be stranded for at least as long as we’re living here. My criteria for a heating system begins with whether it will keep us warm enough. There’s no efficiency or cost benefit that would compensate for being cold. And any reduced emissions would be offset by one of China’s new coal-burning power plants within a few moments, so that doesn’t factor in at all.

I don’t want to be forced to rely on a heat pump in the future if I don’t think it’ll meet my needs.

Ray Dalio sees political polarization in America causing people to, “…move to different states that are more aligned with what they want.”

Energy policy in liberal states is one reason why.

We have three have funds that seek to profit from this environment:
Energy Mutual Fund

Energy ETF

Real Assets Fund


A Closer Look At Canada’s Newest Pipeline

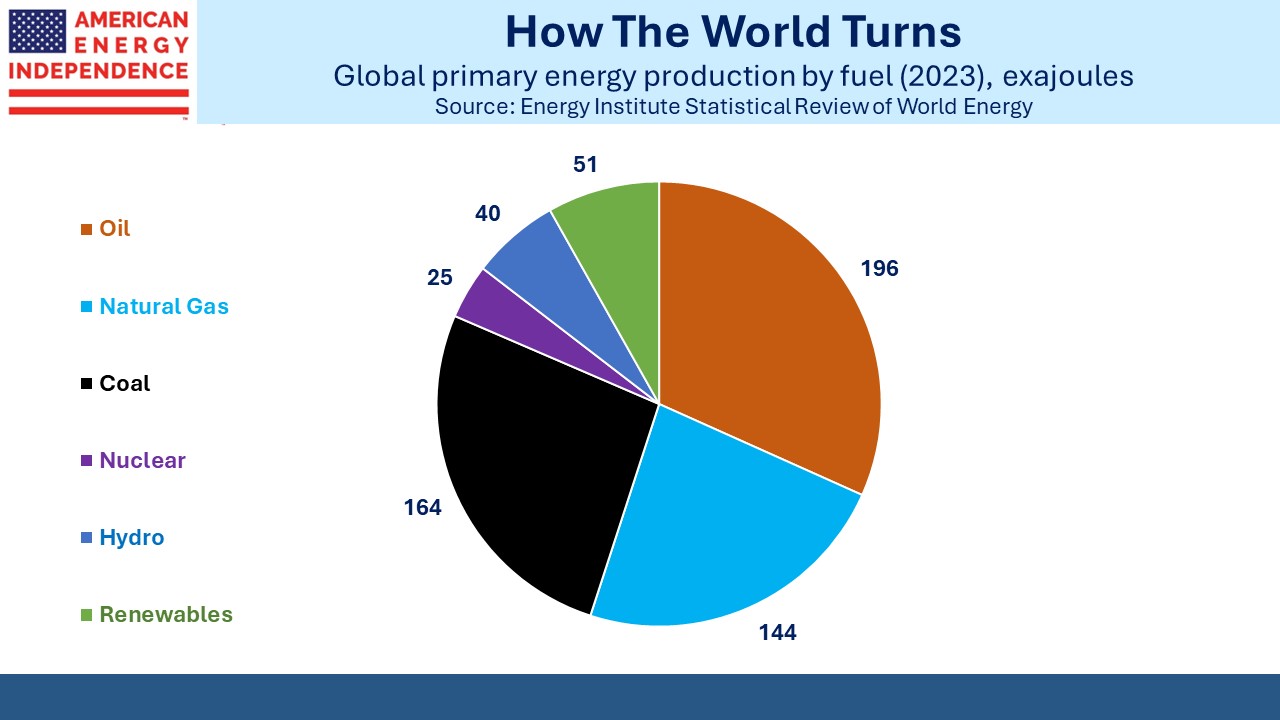
I was perusing energy podcasts the other day. Disappointingly they all seemed to be about renewables – nothing about where over 80% of the world’s energy comes from today. Hopefully I started listening to one by Shell, but quickly realized it’s part of their PR campaign to convince people they’re fully committed to the energy transition while they struggle to make any money outside of their fossil fuels business.

Then I stumbled on an interview with Dawn Farrell, President and CEO of Trans Mountain Corporation (TMC). Originally called TMX, this was a project begun by Kinder Morgan to expand crude capacity on the existing pipeline connecting Edmonton, Alberta with Burnaby, British Columbia.

As we chronicled several times over the years (see Canada’s Failing Energy Strategy), Kinder Morgan eventually tired of navigating the politics between oil-rich Alberta and liberal British Columbia. Canada has long struggled to get its crude oil to market. The Keystone XL expansion was finally killed off by Joe Biden as soon as he became president in a slap to our ally. The Western Canada Sedimentary Basin crude benchmark trades below WTI – sometimes as much as $30. The Canadian Federal government decided completing TMX was in the national interest and bought it from KMI in 2018.

It is now finished. Dawn Farrell explains what it was like to oversee a project backed with theoretically unlimited government funds.

The cost grew from an estimated C$7BN to C$29BN (C$34BN including interest expense), although Farrell notes that the scope increased somewhat. The complexity of building infrastructure isn’t always apparent to those not directly involved.

The route included 47KM of steep slopes with a 15% grade. If not correctly built the pipeline will over time come apart in such terrain. Oil is moved through pipelines in batches of varying grades. Nitrogen has to be inserted between each batch to ensure no gaps open up in between them.

Farrell said they encountered 360 archeological sites, making them probably the largest dig in Canadian history. Every time a new one was encountered work stopped while archeologists were brought in.

Representatives of First Nations, Canada’s indigenous people, were involved at every step. They have stronger rights that native Americans and their consent was needed at numerous points for the project to proceed. TMC employed an ambassador who spent countless days courting First Nations leaders. They were awarded 10% of the jobs and may eventually own a stake in TMC.

.avia-image-container.av-2k6dxn-4ff1b7db66b01cbb11b15c781c95adc4 img.avia_image{ box-shadow:none; } .avia-image-container.av-2k6dxn-4ff1b7db66b01cbb11b15c781c95adc4 .av-image-caption-overlay-center{ color:#ffffff; }

Archeologists uncovered 250K artifacts that were mostly First Nations ancestors dating back as much as 1,500 years.

TMC moved 27,000 birds’ nests. They relocated 1.5 million amphibians. Biologists were ever present supervising the process. They passed through nine golf courses, all of which Farrell reports were restored to their previous condition. They met the needs of 69 regulatory agencies.

TMC expanded the oil loading facilities at Vancouver. An estimated 100 whales live in nearby waters, so all ships operate at lower-than-normal speed and employ specialized sonar which is audible to whales, reducing the odds of contact.

TMC increased TransMountain’s capacity from 300 Thousand Barrels per Day (KB/D) to 890KB/D. Filling the pipeline took 24 days and 4.2 million barrels of oil, but it’s now operational.

Canadian politics is more liberal than the US, but there are still plenty of realists up north who recognize that the world will need gasoline, jet fuel, diesel, lubricants and asphalt for the rest of our lives.

The cancelation of Keystone XL was intended to appease climate extremists, but it didn’t stop Canadian oil getting to market. It’s simply going west instead of south, with no US benefit. Similarly, the LNG permit pause won’t stop countries buying natural gas, but it will increase coal consumption by emerging countries in Asia. Democrat energy policies are often more about optics than results.

TMC was a huge infrastructure project with numerous stakeholders including landowners, regulators, oil shippers, indigenous tribes and environmentalists. Past struggles include: Energy Transfer’s Dakota Access pipeline which was fiercely opposed by indigenous tribes; Equitrans’ Mountain Valley Pipeline which suffered numerous judicial delays; and the Cardinal-Hickory Creek transmission line which environmentalists opposed even though it will bring solar and wind power to population centers in Iowa and Wisconsin.

TMX in China would have been different. Building energy infrastructure in rich, western countries is excruciatingly complex. Federal permit reform has support from both political parties but remains unaddressed. Until the process is improved it will impede the energy transition. There’s much more of this ahead for western nations as we electrify more of our energy consumption.

We have three have funds that seek to profit from this environment:
Energy Mutual Fund

Energy ETF

Real Assets Fund


Picking The Top Pipeline

Which is the best pipeline company? It depends on what you’re measuring. Income-seeking investors might focus on Distributable Cash Flow (DCF) yield or distribution (dividend) yield. Dividend coverage is usually important. Lowest leverage would provide comfort to those concerned about downside. Momentum investors will look at dividend growth – and few will ignore price performance. So how do they rate?

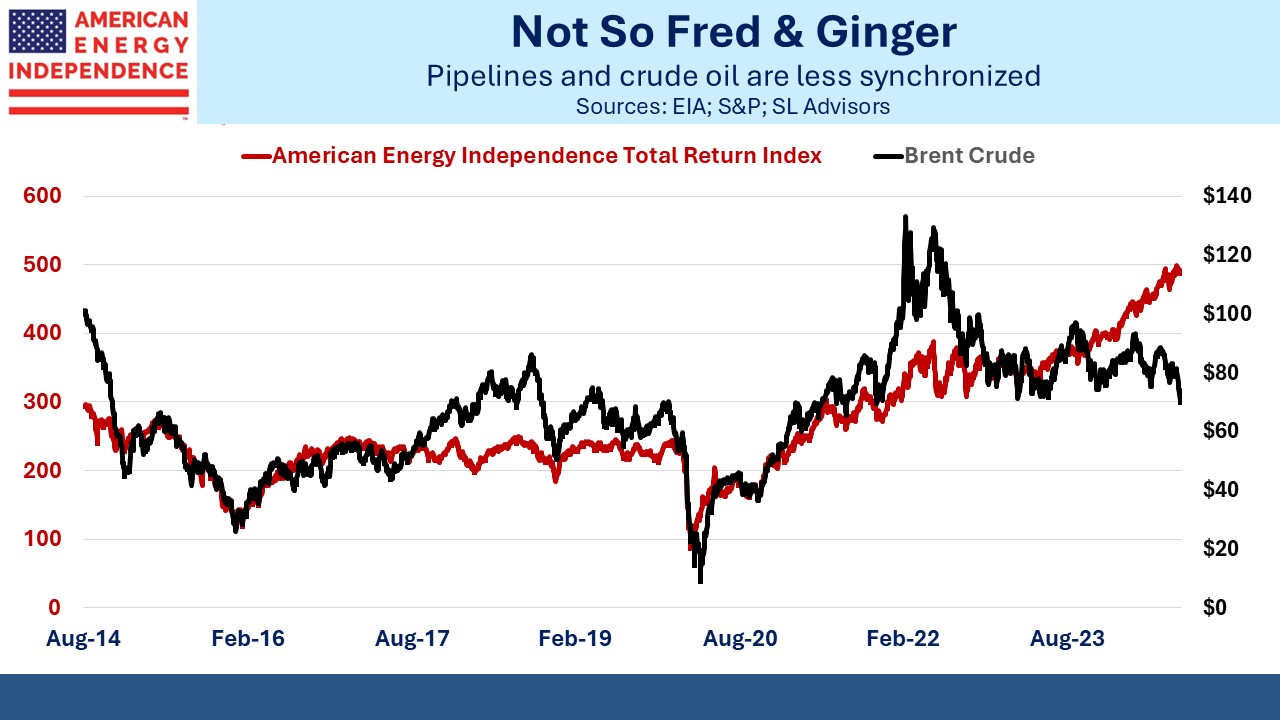
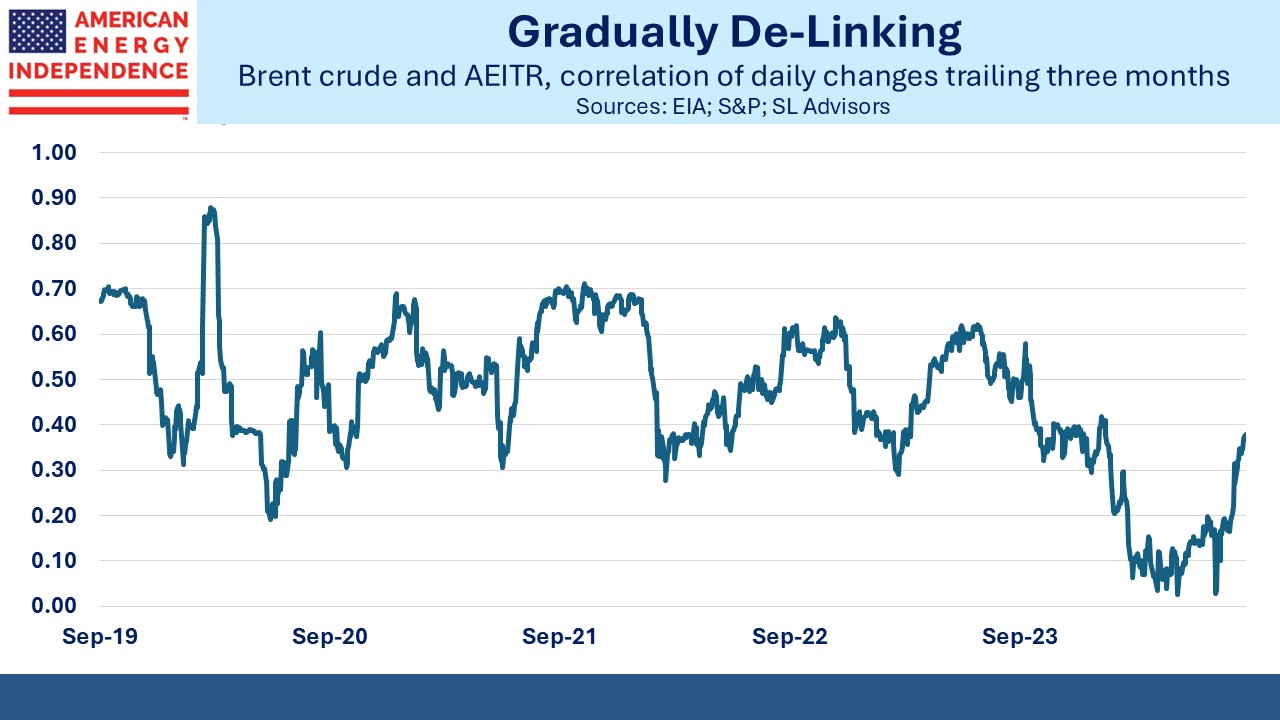
We’ll focus on the biggest companies and MLPs, all part of the American Energy Independence index (AEITR). If DCF yield is what you’re after, Energy Transfer (ET) is top at 17.2%. For years this stock labored under the “Kelcy discount” as potential buyers were wary of past management actions that weren’t fiduciary best practice (see A Look Back At Energy Transfer).

.avia-image-container.av-qqdjpg-274a63f856fb23f17d93f388e0f266bf img.avia_image{ box-shadow:none; } .avia-image-container.av-qqdjpg-274a63f856fb23f17d93f388e0f266bf .av-image-caption-overlay-center{ color:#ffffff; }

However, this company knows how to execute. Last year’s acquisition of Crestwood has been absorbed with more synergy benefits than forecast. Many advisors we talk to own ET, and their reputation has evolved away from most likely to self-deal to great operator with an “in-your-face” posture to competitors and regulators.

One investor said he’d heard that some analysts are downgrading ET, but JPMorgan and Wells Fargo both reaffirmed Overweight ratings following earnings earlier in the month.

The highest dividend yield is Western Midstream Partners (WES) at 9.4%. Their DCF yield is only 10%, giving them a scant 1.1X coverage. It’s many years ago now but low distribution coverage ratios used to be typical when MLPs were the dominant corporate form in midstream energy infrastructure. They were routinely doing secondary offerings to buy “drop-down” assets from their controlling general partner.

The shrinking pool of MLP-oriented money forced a more conventional single entity c-corp structure on most of the industry. Giving up the partnership structure meant accepting the double taxation common to most equity securities (ie first on corporate profits then on dividends paid to owners).

Depreciation charges help lower taxable income in many cases.

The best payout coverage is a whopping 10.2X at Cheniere. Their DCF yield of 11.2% is close to the median. They paid their first dividend in November 2021. It’s grown by a third since then but still only represents a derisory 1.1%. One of the features we like about Cheniere is that once an LNG terminal is built its ongoing maintenance capex is low. As a % of EBITDA Cheniere has the lowest ratio in the industry.

Pipelines have been reducing leverage in what’s become a virtuous cycle. Falling capex, caused in part by opposition from climate extremists, has boosted free cash flow. This has allowed some debt paydown as well as driving EBITDA higher. MPLX currently has the lowest Debt/EBITDA of 2.7X.

The two big Canadians, Enbridge (ENB) and TC Energy (TRP), have both been bucking this trend (5.1X and 5.4X respectively) with big capex programs and (in ENB’s case) acquisitions. This has caused their stocks to lag the market, although both are continuing to raise dividends and reduce leverage.

Growth, as measured by three-year CAGR in payout, is distorted by companies that have significantly increased their payout ratio. Hence Targa Resources (TRGP) is top with a 22% CAGR having raised their annual payout from $2 per share in 2023 to an estimated $3.63 (re JPMorgan). More representative growth rates from companies that were always paying a reasonable dividend are Williams Companies (5%), ET (6%) and MPLX (7.1%).

When it comes to trailing one year performance, Equitrans is the clear winner with a +155% return. Resolution of Mountain Valley Pipeline (MVP) thanks to its inclusion in a debt ceiling bill makes Senator Joe Manchin (WVa) their MVP.

In 2022 NextEra, a JV partner in MVP, was so pessimistic about the prospects of completion that they wrote down their interest to zero (see Why Pipeline Construction Is Hard). The repeated delays and cost overruns show why making the permit process more predictable is so important to all kinds of energy infrastructure, especially renewables. If courts can rescind authorizations years after the fact, building big projects will carry an additional layer of risk.

Other strong performers over the past year include TRGP (+66%), WES (+58%) and Oneok (+46%). I received a hefty tax bill due to their acquisition of Magellan Midstream (MMP) last year, which we and others opposed (see Still Uncovinced By Oneok Magellan Combo).

Since New Jersey doesn’t recognize tax loss carryforwards, the gain on MMP which I’d held for close to two decades was fully taxed on my state return while my federal return allowed some older losses to offset.

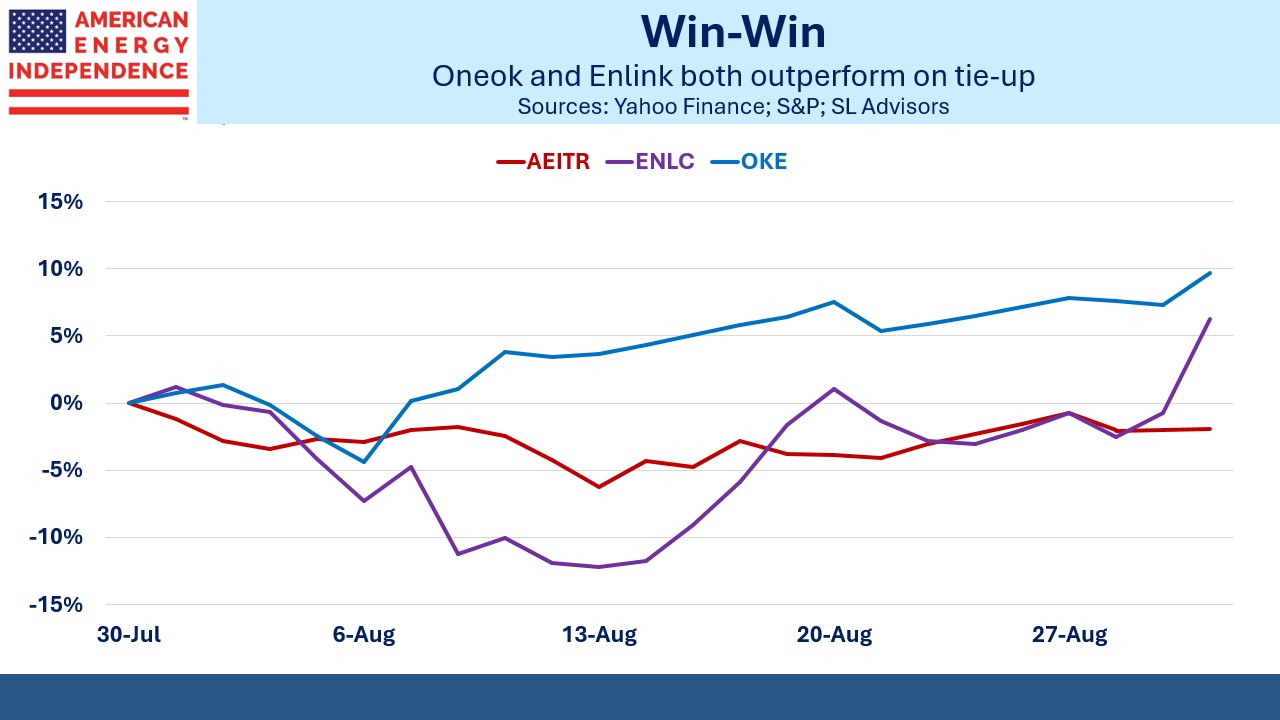
The NJ tax code is the most effective tool for encouraging those with means to flee the state. Fortunately, the OKE-MMP combination has performed better than expected.

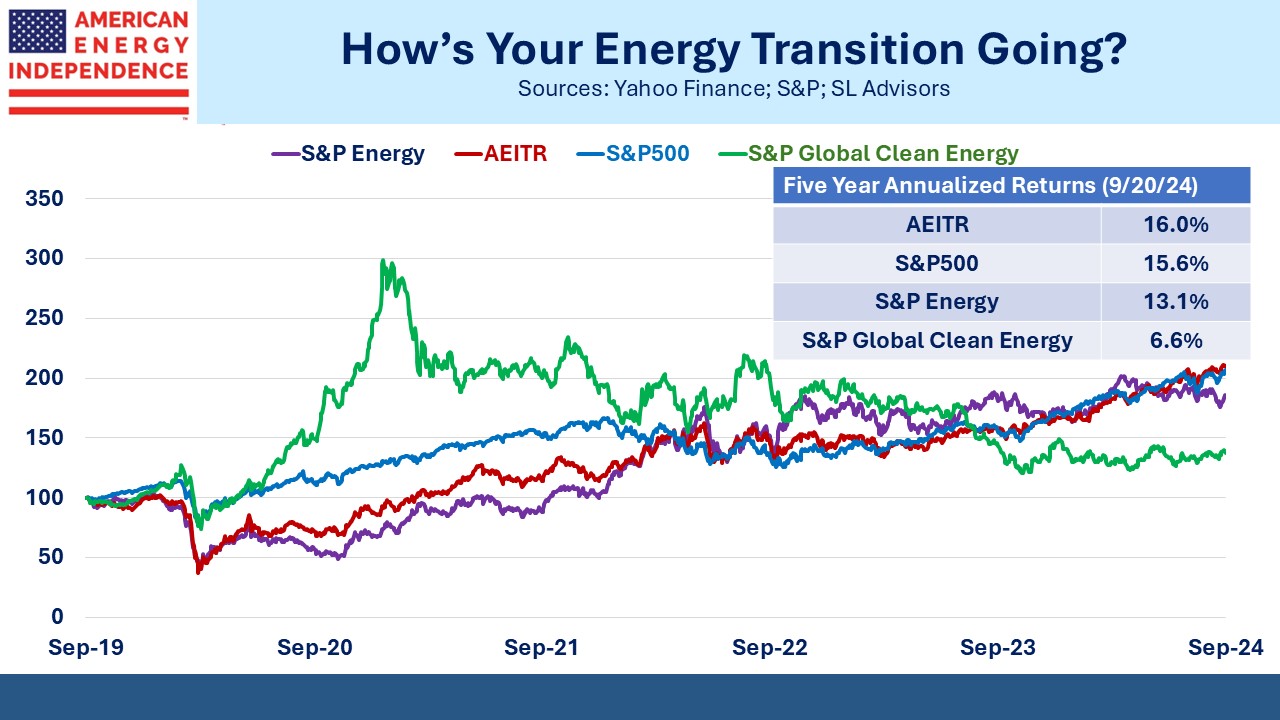
Whichever metric you prefer in selecting stocks, midstream energy infrastructure has names that measure up well. It’s why the sector continues to outperform.

We have three have funds that seek to profit from this environment:
Energy Mutual Fund

Energy ETF

Real Assets Fund


Revising The Gas Outlook Higher

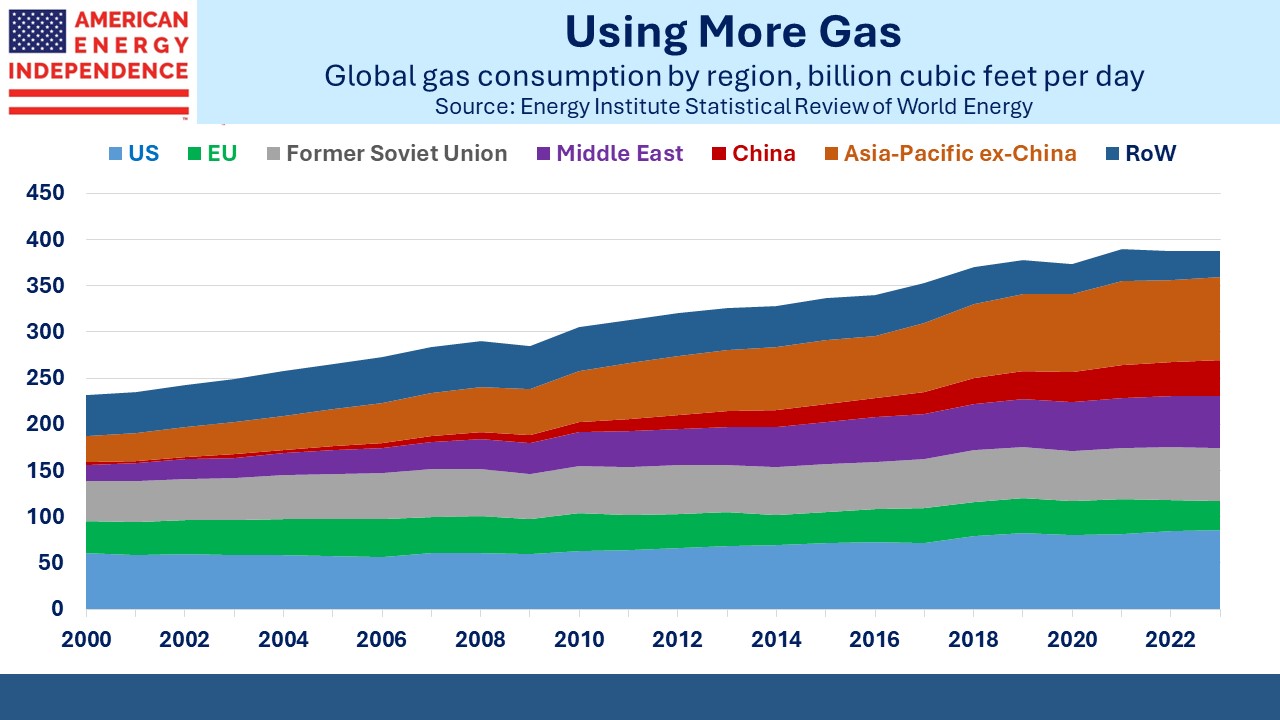
Natural gas prices have been recovering in the US following several months below $2 per Million BTUs (MMBTU). The techniques of horizontal drilling and hydraulic fracturing (“fracking”) have enjoyed steady improvement, allowing break-evens to fall. An additional factor has been associated gas from the Permian in west Texas. E&P companies want oil but they get gas anyway, and in many cases the production is becoming more “gassy”.  

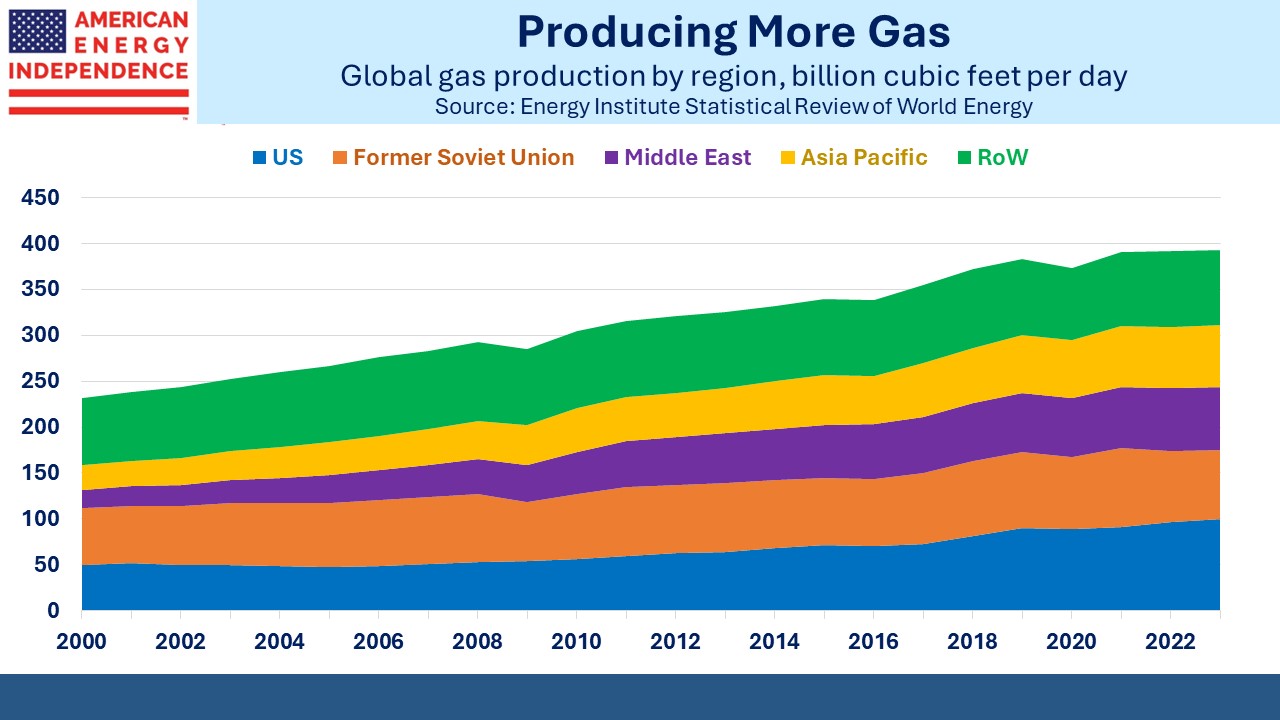
Natural gas rigs employed are 27% lower than a year ago. This reflects improved efficiency but also production cutbacks in plays that are all or mostly gas (“dry gas”). Late last year natural gas production surged, averaging 104.6 Billion Cubic feet per Day (BCF/D) in November. Full year 2023 production averaged 102.4 BCF/D, up from 97.5 BCF/D in 2022. This year it’s likely to fall slightly to 101.6 BCF/D, demonstrating the old saw that the cure for low prices is low prices. But it should rebound in 2025. 

.avia-image-container.av-1jevgz7-32d02dff73dbc8d48a32f623e46a7c90 img.avia_image{ box-shadow:none; } .avia-image-container.av-1jevgz7-32d02dff73dbc8d48a32f623e46a7c90 .av-image-caption-overlay-center{ color:#ffffff; }

That’s because demand growth is coming. Public utility companies quickly turned the conversation to AI power demand on earnings calls. Forecasts of 5% annual revenue growth are not uncommon in this sector. It’s caused a surprising turnaround in utility stocks. Following –7.2% performance last year, the S&P Utilities ETF (XLU) is +12.7 YTD. The recovery coincided inconveniently with our warning that many of these companies face substantial future capex (see To Lose On The Energy Transition Buy Utilities).  

.avia-image-container.av-14pgtv7-6ab8e3fcee4f627d50f711ea450608b2 img.avia_image{ box-shadow:none; } .avia-image-container.av-14pgtv7-6ab8e3fcee4f627d50f711ea450608b2 .av-image-caption-overlay-center{ color:#ffffff; }

It’s hard to overstate the level of new investment in data centers. JPMorgan estimates $300BN globally this year, up from $200BN in 2020. They see $500BN by 2027. The big spenders are Microsoft, Google, Amazon, Meta, Apple, IBM, and Oracle. Nvidia’s recent results provided real-time confirmation of the spending on AI chips.  

AI power demand is on track to double from 2022-26. 

JPMorgan estimates that the increase in power demand should require an additional 1.4 BCF/D of natural gas by 2027 and 6.2 BCF/D by 2030.  

.avia-image-container.av-kzpzmb-59aed02a70c3a97e7203d8e2428058f7 img.avia_image{ box-shadow:none; } .avia-image-container.av-kzpzmb-59aed02a70c3a97e7203d8e2428058f7 .av-image-caption-overlay-center{ color:#ffffff; }

The Energy Information Administration (EIA) has consistently forecast declining natural gas consumption in the US power sector. Unlike many forecasters, the EIA is non-partisan so they don’t regard their publications as providing cheerleading support for renewables. The International Energy Agency does just that, devaluing their output.  

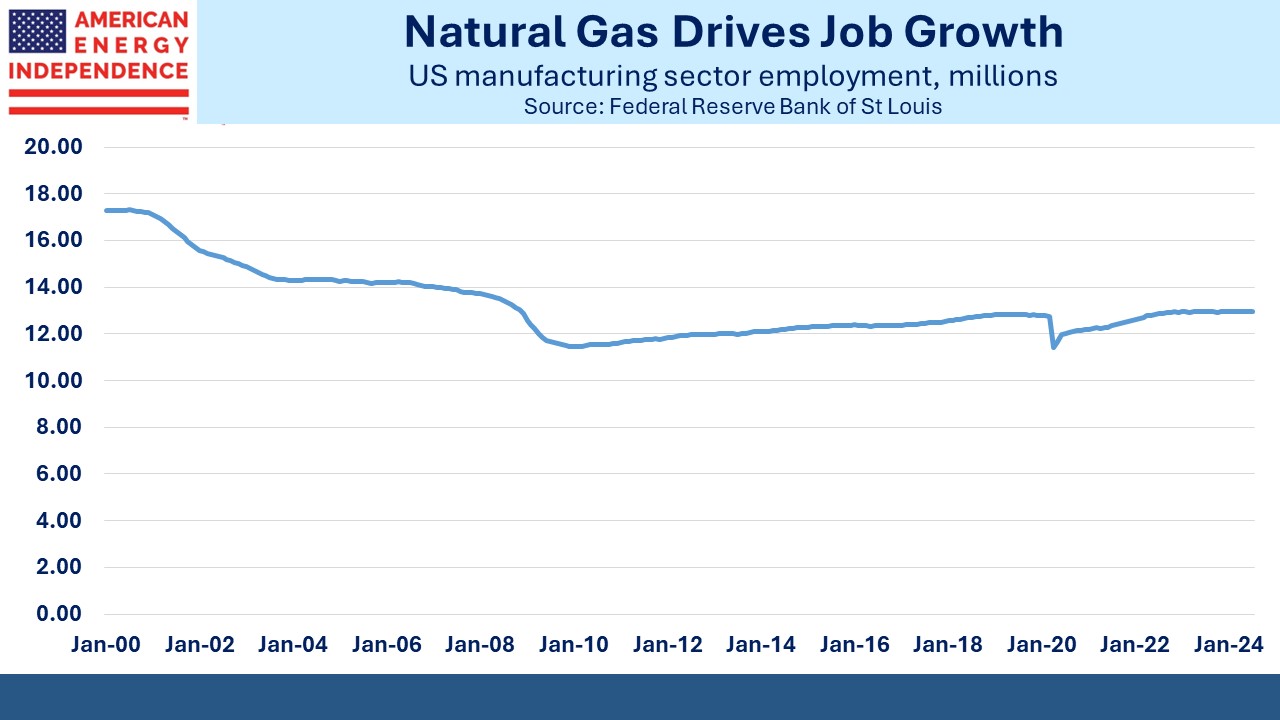
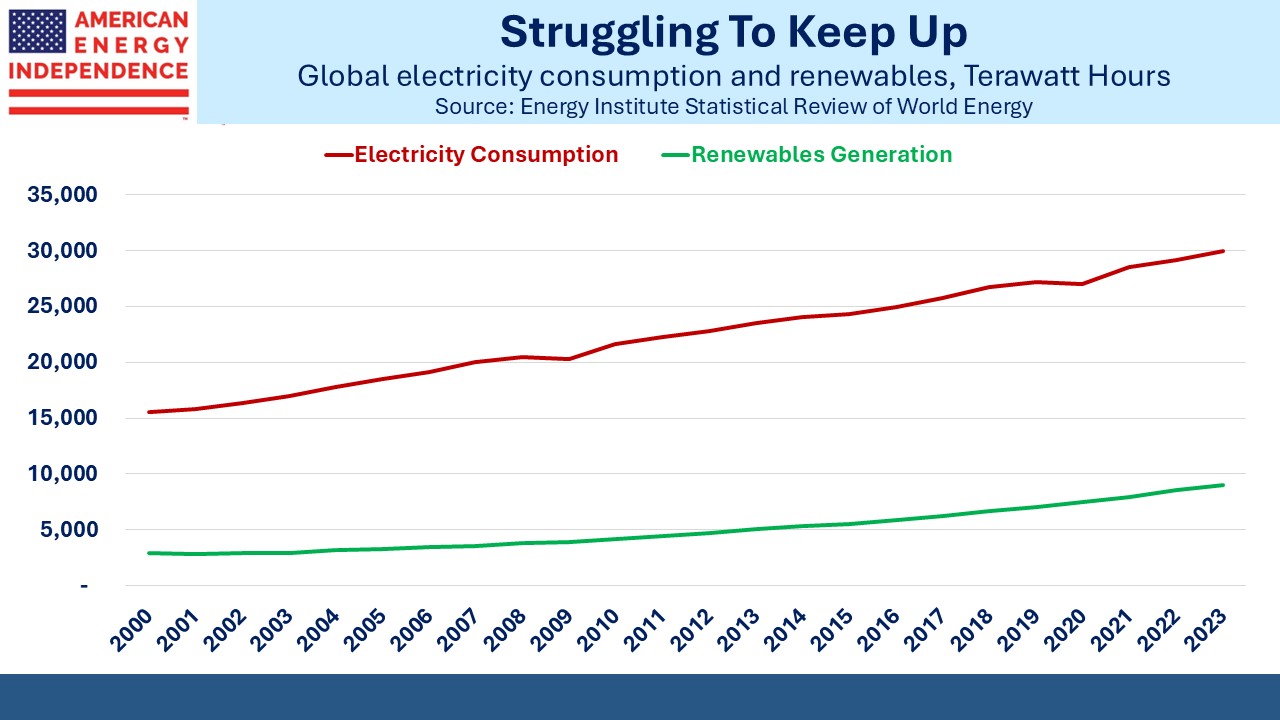
The EIA’s outlook has been predicated on renewables gaining market share. Since 2010 solar and wind have gone from 2% to 15% of US power generation. Casual reporting often presents this as evidence that weather-dependent electricity is taking over. But natural gas has gone from 23% to 42% over the same period.  

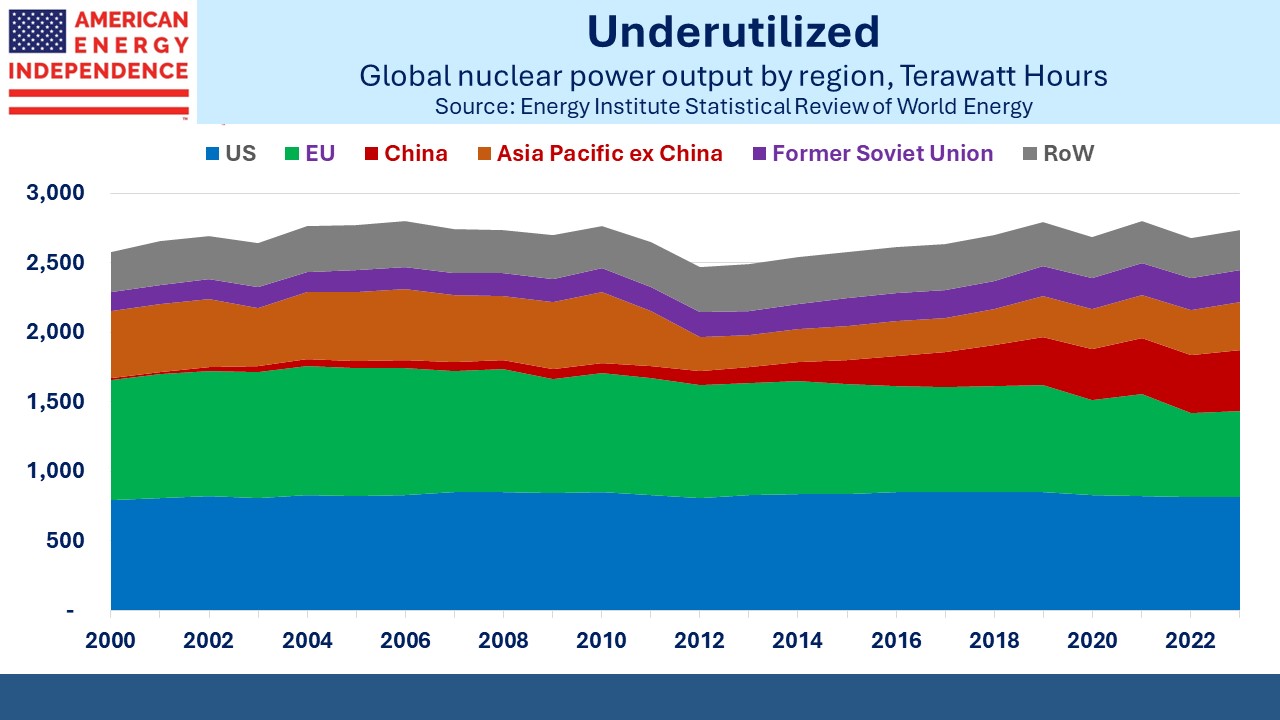
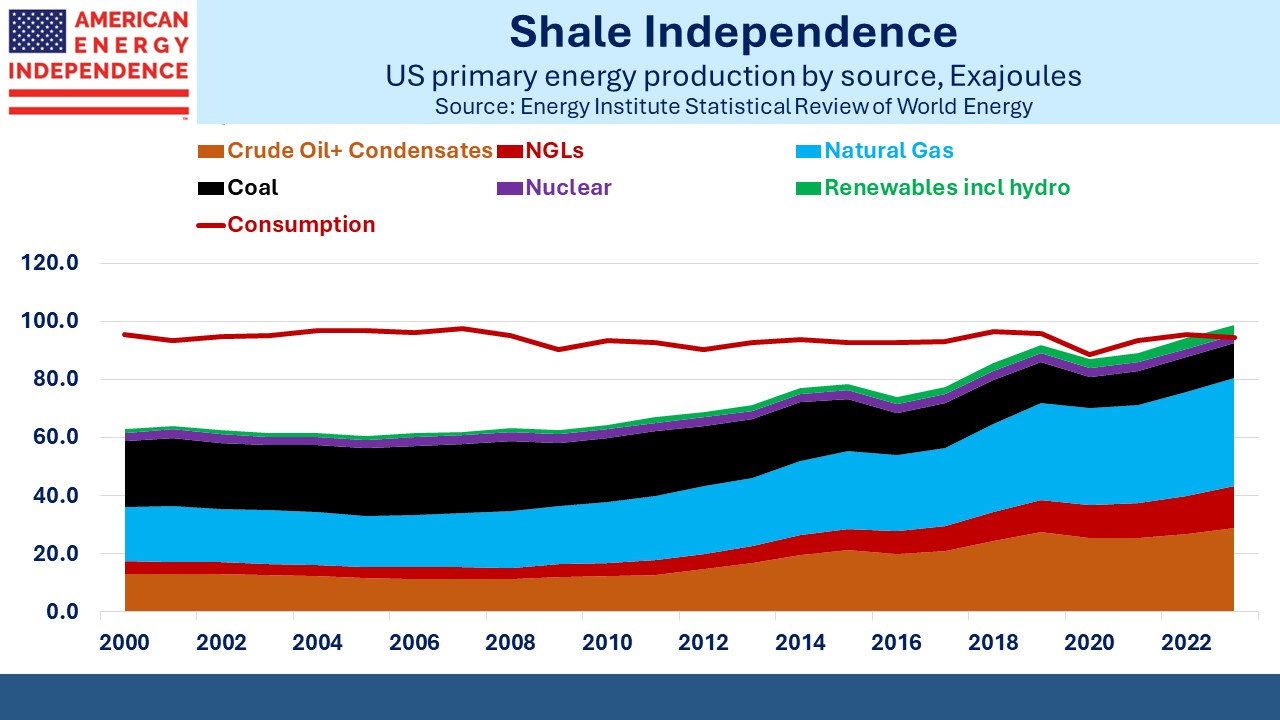
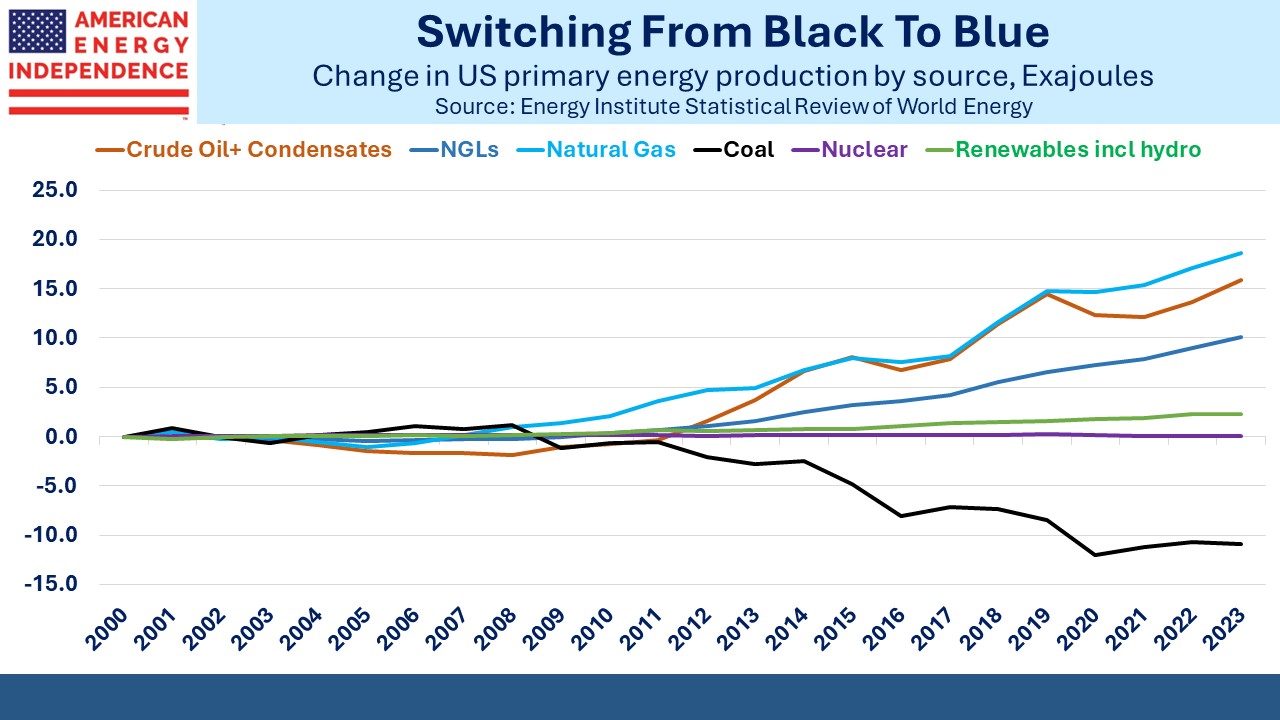
By the numbers, America’s biggest electricity story is the growth of natural gas which has displaced coal. Intermittent power is growing, but thankfully is not yet to the point at which we fear dunkelflaute, the German word for cloudy or windless days.  

In January Texas, which relies substantially on windpower, set a winter record for natural gas provided electricity.  

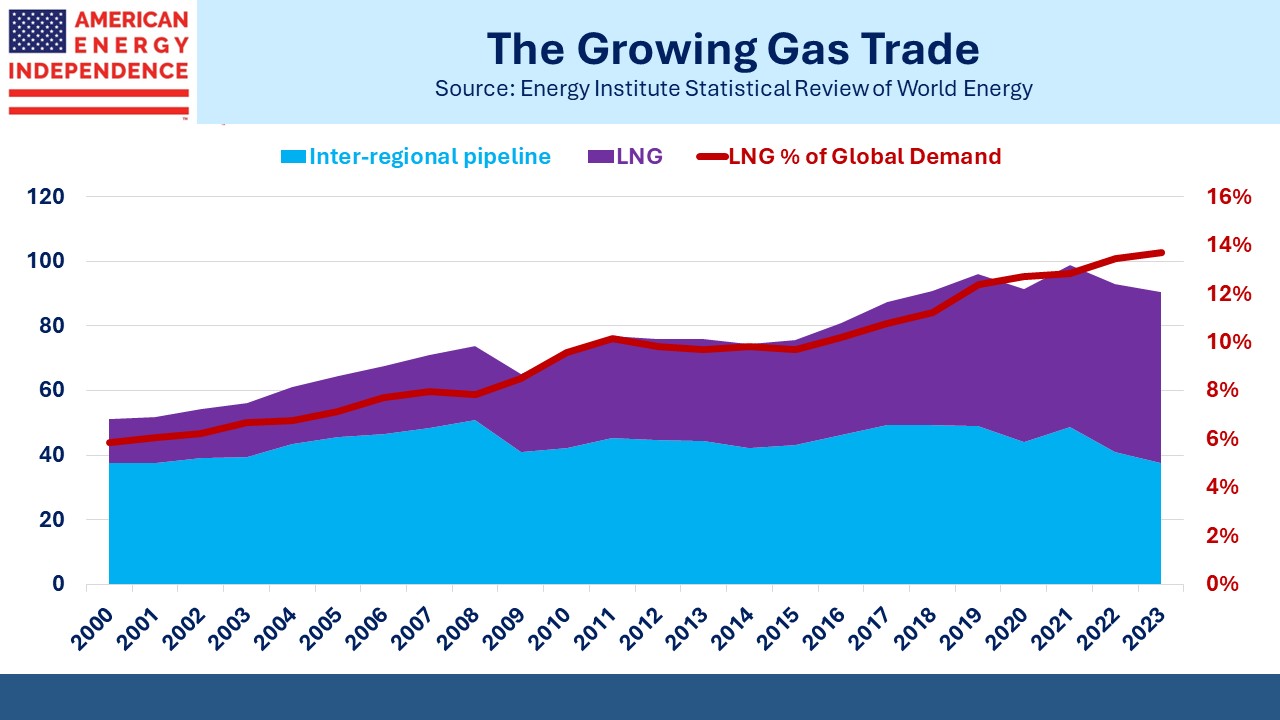
Feedstock for LNG export terminals is set to increase by 9.4 BCF/D through 2030 based on facilities already under construction. This will take total US LNG export capacity to 26 BCF/D, including NextDecade’s Rio Grande Stage 1 with 2.2 BCF/D (see What’s Next For NextDecade?). 

However, JPMorgan assumes 86% utilization given the possibility of excess global LNG supply by then, resulting in 22.4 BCF/D of exports. roughly a quarter of current production.  

The combination of AI power demand and LNG exports will require an additional 15 BCF/D of production by 2030, bringing us to around 120 BCF/D. Achieving that increased level of output will require activating wells with higher break evens. However, natural gas bulls will need to temper their enthusiasm because JPMorgan believes a price of around $3.50 per MMBTUs will be sufficient for the market to clear.  

The EIA has sharply reduced their forecast natural gas price since early last year. They previously had it oscillating either side of $5 per MMBTUs but have adjusted that roughly $1 lower.  

The arbitrage between global LNG prices and US looks likely to remain for the foreseeable future. The European TTF benchmark trades at $11 per MMBTUs and the Asian JKM at $12. Both these offer enough margin to cover the transportation cost from the US. We’re just capacity constrained.  

The Golden Pass LNG project, co-owned by Exxon Mobil Corp. and QatarEnergy LNG, faces possible delays as the general contractor filed for bankruptcy. 3,000 workers were laid off. It’s scheduled to be operational in less than a year, and that timeline must presumably be in doubt.  

US natural gas has a bright outlook. It’s a blue flame future.  

We have three have funds that seek to profit from this environment:
Energy Mutual Fund

Energy ETF

Real Assets Fund