Same Assets, Different Payout
We regularly get questions from investors about why the dividend yield on MLPs is often higher than for energy infrastructure C-corps that are in the same business. In recent years several MLPs have transferred their assets into their C-corp parent. Examples are Kinder Morgan (KMI), Targa Resources (TRGP) and Oneok (OKE). The merger of an MLP with its C-corp parent has typically been accompanied by a dividend cut for the MLP investors, who wind up with C-corp shares through a swap.
The assets don’t perform any differently just because they’ve been moved to another entity. But it highlights the differences between C-corps and MLPs from both a taxation and a financing perspective.
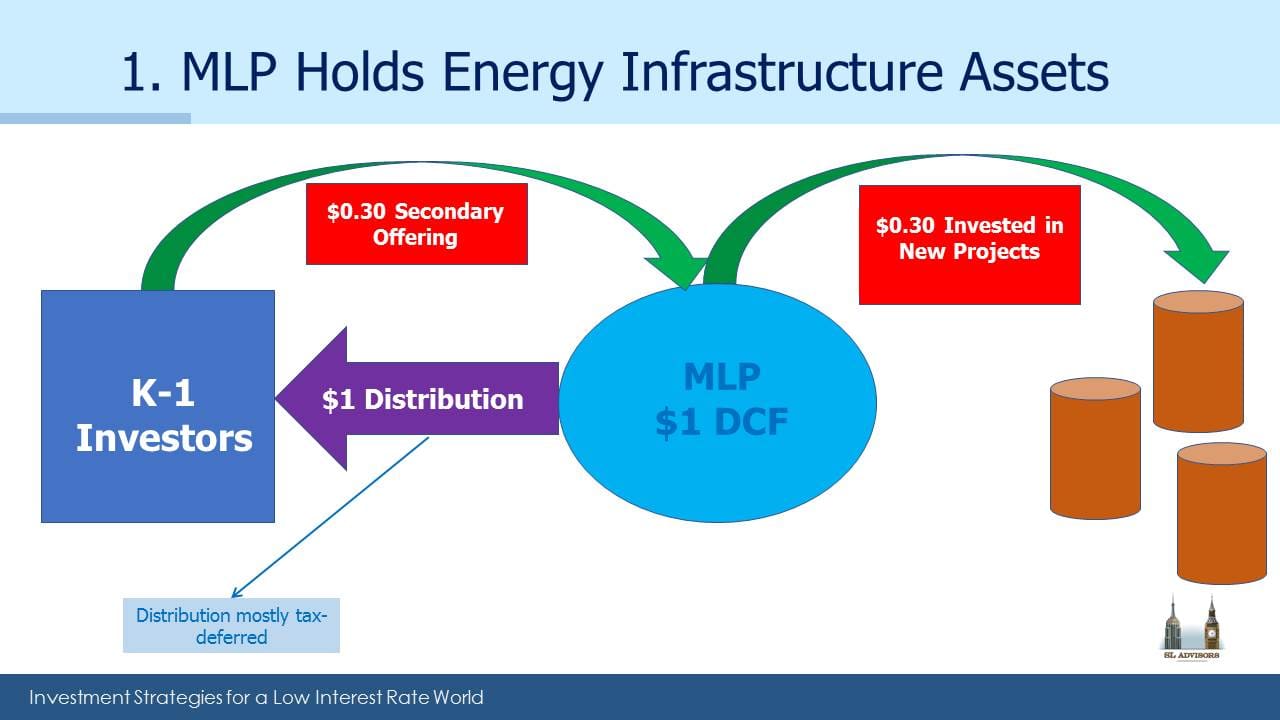
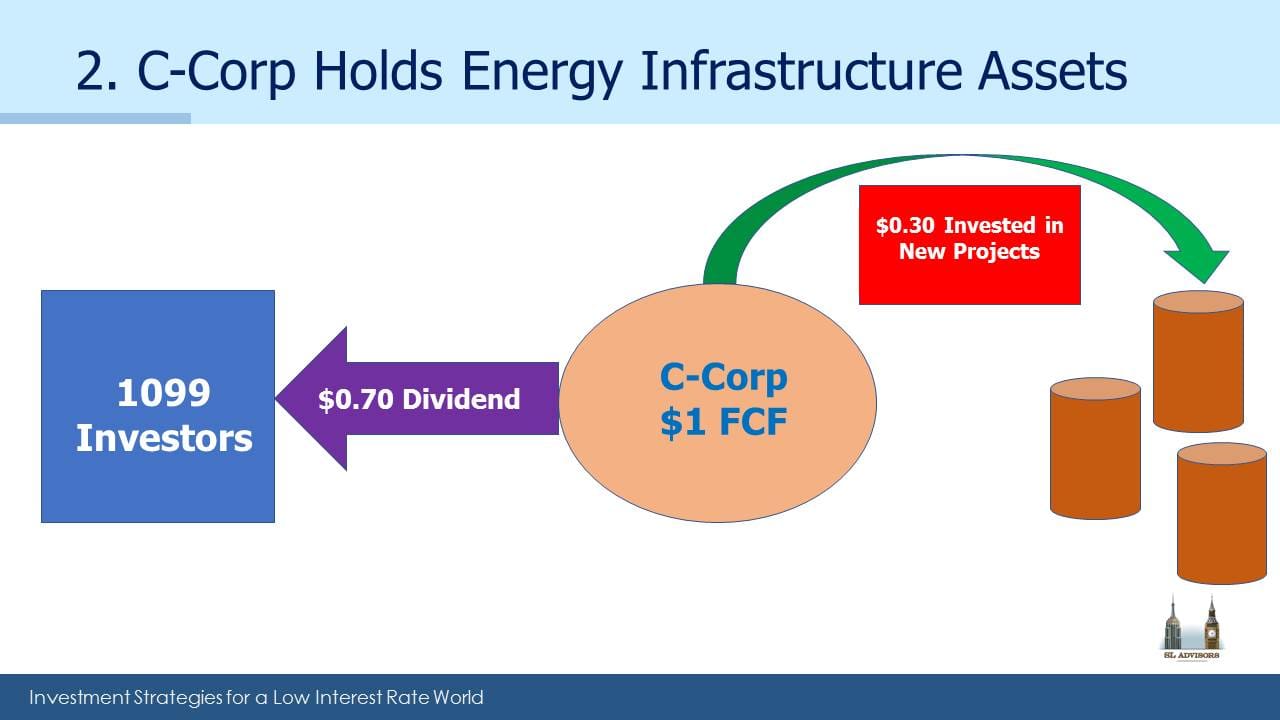
The two diagrams below show this. In each case, assume the underlying assets and the need for growth capital are the same; the only difference is the type of entity (MLP or C-corp) owning the assets.
Traditionally, MLPs pay out >90% of their Distributable Cash Flow (DCF) in distributions. DCF is defined as cash generated from operations less the cost of maintenance expenditure on existing assets. Note that generally companies (i.e. C-corps) pay out substantially less than this. Across the S&P500 the average payout ratio is currently 42%. This is largely because of the “double taxation” of dividends, in that corporate profits are taxed first at the corporate level (via corporate income tax), and then again at the investor levels (via personal taxes on dividends and capital gains).
Since paying dividends is a very tax-inefficient way for corporations to return value to shareholders, high pay-out ratios would be exceptionally inefficient. The recent trend is for companies to return profits via buying back their stock. S&P500 companies are currently spending 28% more buying back stock than paying dividends. This also reduces their share count, boosting per share growth.
MLPs don’t face the same tax inefficiency, hence the higher payouts. Consequently, they pay out most of their DCF and then issue equity to finance growth. Their number of units outstanding therefore grows, diluting per unit DCF.
When assets formerly held by an MLP are moved into a C-corp, their cashflows are treated differently. Because C-corps have lower payout ratios, less of the Free Cash Flow (roughly analogous to the MLP’s DCF) is paid out in dividends. This has two results:
- Assets held in an MLP will pay a higher yield to investors than those same assets held in a C-corp.
- The C-corp’s lower payout leaves more cash to finance growth, which in our example eliminates the need to issue equity. Not issuing equity means no dilution for shareholders, which in turn means faster per share dividend growth.
Across the energy infrastructure investments we hold, dividends are covered approximately 1.5X by free cashflow. An extreme example is Kinder Morgan (KMI) which has a FCF yield of 10% but a dividend yield of 2.5% (they have announced they’ll be raising it next year). KMI is reinvesting most of its FCF in growth, thereby not issuing any dilutive equity and so driving FCF higher. In addition, since FCF is generally growing, the total return on these investments should exceed the FCF yield itself.
Some will note that the point of MLPs is to hold eligible assets without having to pay corporate tax on the returns, and argue that use of the C-corp subjects those returns to taxes needlessly. In practice, energy infrastructure C-corps that have acquired assets from an MLP have employed tax strategies to minimize or eliminate any corporate tax liability, so this concern is moot (see The Tax Story Behind Kinder Morgan’s Big Transaction).
In summary, C-corps pay less of each dollar earned and reinvest more, compared with an MLP holding the same assets. Lower payouts lead to faster growth, since cash not paid out is reinvested in the business. The dividend yield on a portfolio of equities is an unreasonably low estimate of total return. For example, the S&P500 yields 2%, whereas most observers would assign a higher long term return target to stocks (unless they’re very bearish), because dividends grow over time which contributes to an investors overall return. C-corps that own energy infrastructure exhibit similar characteristics, albeit with higher yields and growth prospects.
We are invested in KMI, OKE and TRGP
Important Disclosures
The information provided is for informational purposes only and investors should determine for themselves whether a particular service, security or product is suitable for their investment needs. The information contained herein is not complete, may not be current, is subject to change, and is subject to, and qualified in its entirety by, the more complete disclosures, risk factors and other terms that are contained in the disclosure, prospectus, and offering. Certain information herein has been obtained from third party sources and, although believed to be reliable, has not been independently verified and its accuracy or completeness cannot be guaranteed. No representation is made with respect to the accuracy, completeness or timeliness of this information. Nothing provided on this site constitutes tax advice. Individuals should seek the advice of their own tax advisor for specific information regarding tax consequences of investments. Investments in securities entail risk and are not suitable for all investors. This site is not a recommendation nor an offer to sell (or solicitation of an offer to buy) securities in the United States or in any other jurisdiction.
References to indexes and benchmarks are hypothetical illustrations of aggregate returns and do not reflect the performance of any actual investment. Investors cannot invest in an index and do not reflect the deduction of the advisor’s fees or other trading expenses. There can be no assurance that current investments will be profitable. Actual realized returns will depend on, among other factors, the value of assets and market conditions at the time of disposition, any related transaction costs, and the timing of the purchase. Indexes and benchmarks may not directly correlate or only partially relate to portfolios managed by SL Advisors as they have different underlying investments and may use different strategies or have different objectives than portfolios managed by SL Advisors (e.g. The Alerian index is a group MLP securities in the oil and gas industries. Portfolios may not include the same investments that are included in the Alerian Index. The S & P Index does not directly relate to investment strategies managed by SL Advisers.)
This site may contain forward-looking statements relating to the objectives, opportunities, and the future performance of the U.S. market generally. Forward-looking statements may be identified by the use of such words as; “believe,” “expect,” “anticipate,” “should,” “planned,” “estimated,” “potential” and other similar terms. Examples of forward-looking statements include, but are not limited to, estimates with respect to financial condition, results of operations, and success or lack of success of any particular investment strategy. All are subject to various factors, including, but not limited to general and local economic conditions, changing levels of competition within certain industries and markets, changes in interest rates, changes in legislation or regulation, and other economic, competitive, governmental, regulatory and technological factors affecting a portfolio’s operations that could cause actual results to differ materially from projected results. Such statements are forward-looking in nature and involves a number of known and unknown risks, uncertainties and other factors, and accordingly, actual results may differ materially from those reflected or contemplated in such forward-looking statements. Prospective investors are cautioned not to place undue reliance on any forward-looking statements or examples. None of SL Advisors LLC or any of its affiliates or principals nor any other individual or entity assumes any obligation to update any forward-looking statements as a result of new information, subsequent events or any other circumstances. All statements made herein speak only as of the date that they were made. r
Certain hyperlinks or referenced websites on the Site, if any, are for your convenience and forward you to third parties’ websites, which generally are recognized by their top level domain name. Any descriptions of, references to, or links to other products, publications or services does not constitute an endorsement, authorization, sponsorship by or affiliation with SL Advisors LLC with respect to any linked site or its sponsor, unless expressly stated by SL Advisors LLC. Any such information, products or sites have not necessarily been reviewed by SL Advisors LLC and are provided or maintained by third parties over whom SL Advisors LLC exercise no control. SL Advisors LLC expressly disclaim any responsibility for the content, the accuracy of the information, and/or quality of products or services provided by or advertised on these third-party sites.
All investment strategies have the potential for profit or loss. Different types of investments involve varying degrees of risk, and there can be no assurance that any specific investment will be suitable or profitable for a client’s investment portfolio.
Past performance of the American Energy Independence Index is not indicative of future returns.


The so-called “tax strategies to minimize or eliminate any corporate tax liability” after the C corp acquires the MLP, is the achievement of a step up in basis of the assets acquired by the C corp from the MLP, leading to enhanced depreciation and then lower taxes by the C corp acquirer. However, this comes at the price to the former MLP unitholders of a substantial income tax on the exchange of their MLP units for C corp shares, and the most loyal unit holders, who have the lowest basis in their units, are taxed the most. That kind of mistreatment of unit holders is reprehensible.
I think that’s accurate, and is why investors should hold units in the GP, in common with management in many cases.