A Slogan Not Science
JPMorgan’s recent Eye on the Market: Energy Outlook 2019 is the best analysis we’ve seen of the Green New Deal (GND). Author Mike Cembalest, whom I know from when I worked there, as always takes a balanced approach supported by insightful research.
Cembalest breaks down the challenge aided by figures and charts to pick the GND apart. Suppose for example, by 2030 the U.S. achieved:
- Primary energy use back to 1988 levels
- 11X more solar generation
- 5X more wind
- 90% decline in coal use
- 40-50% of passenger cars being electric (today 1-2%)
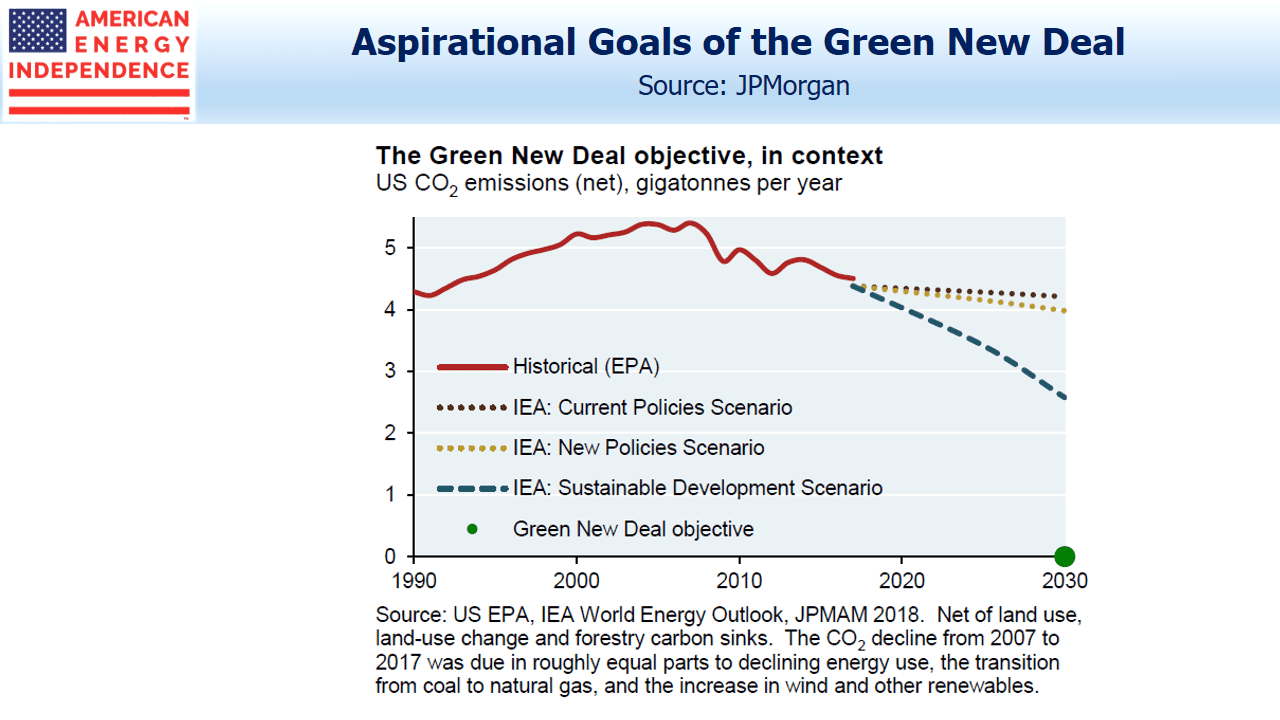
These and related objectives would represent a “Herculean effort” that is unfathomable over the next decade. Even with the necessary political and public support, this would be a path to a 40% drop in CO2 emissions by 2040, versus the GND’s goal of 100% by 2030. If anything, the GND’s unattainability should drive support for significant spending on flood remediation projects, as Cembalest suggests.
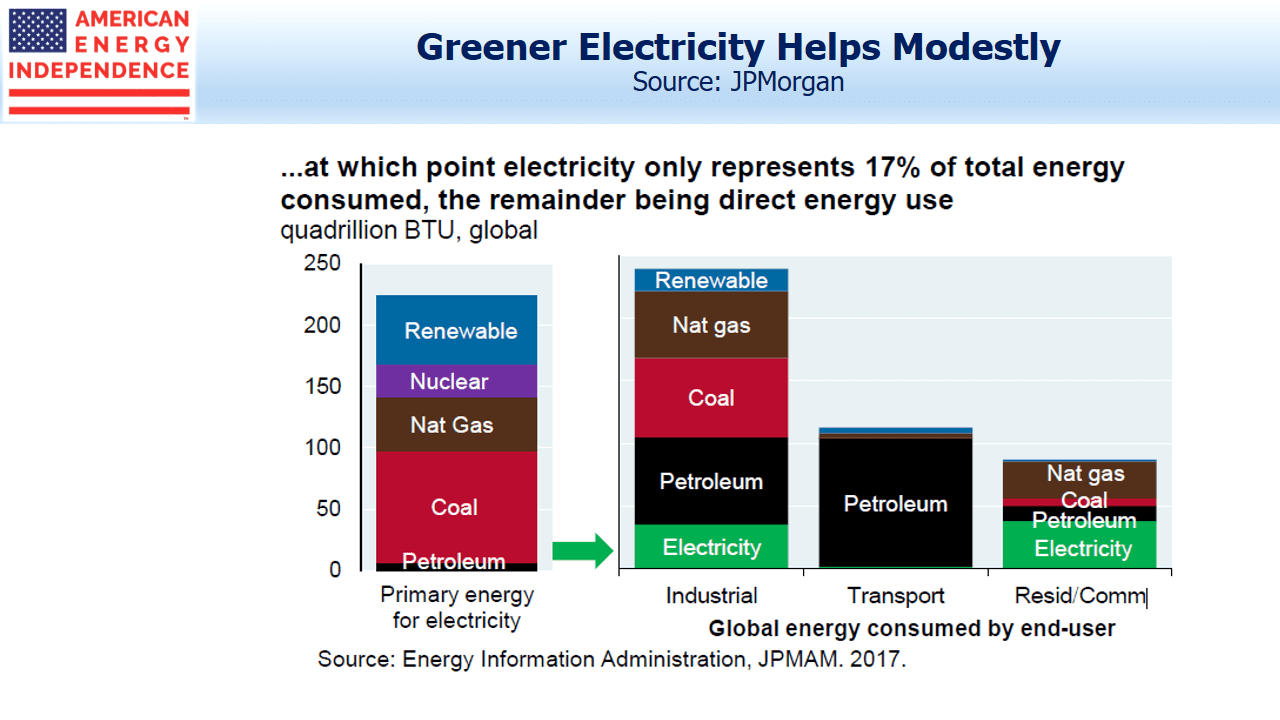
The conversion of electricity generation to solar and wind receives lots of attention. But electricity represents only 17% of primary energy use. A sobering related statistic is that 2/3rds of the primary energy used to generate electricity (coal, natural gas, renewables etc.) gets lost through thermal conversion, power plant consumption and transmission.
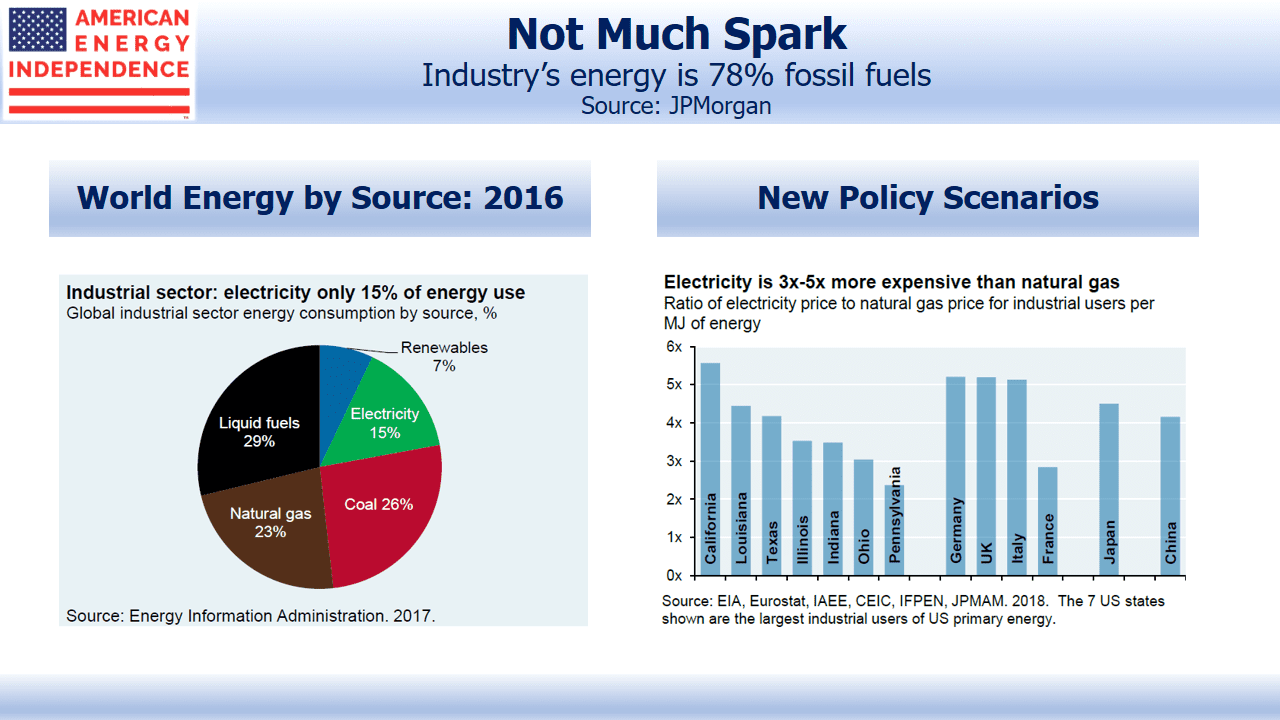
The three big end user sectors of energy are industry, transport and residential/commercial buildings. Industry is more than half – production of cement, steel, ammonia and plastics are the “four pillars of modern society.” Many industrial processes require high heat and temperature, and while electricity can theoretically replace natural gas, it’s 3-5X more expensive. Moreover, that’s based on today’s electricity, which is itself 2/3rds derived from fossil fuels. A 100% renewable electricity supply would be even less competitive.
Lowering greenhouse gases globally can’t happen without China’s active participation. They produced more than half of the world’s cement in 2017, half the steel, and a third of the ammonia, all substantially used domestically. 85% of ammonia is used in fertilizer, without which the world could only feed half its current population. 40-70% of ammonia used in fertilizer is lost due to leaching or erosion. Its production causes 1% of global Greenhouse Gases (GHGs).
The world currently generates around 34 gigatonnes of CO2 annually (a gigatonne is a billion tonnes). The International Energy Agency (IEA) expects global GHGs to increase by a third over the next two decades with unchanged policies. Rising living standards in emerging economies, led by China and India, will swamp greater energy efficiencies in the developed world. Use of plastics (produced with methane, naphtha and ethane) is forecast to rise by 150% over the next thirty years.
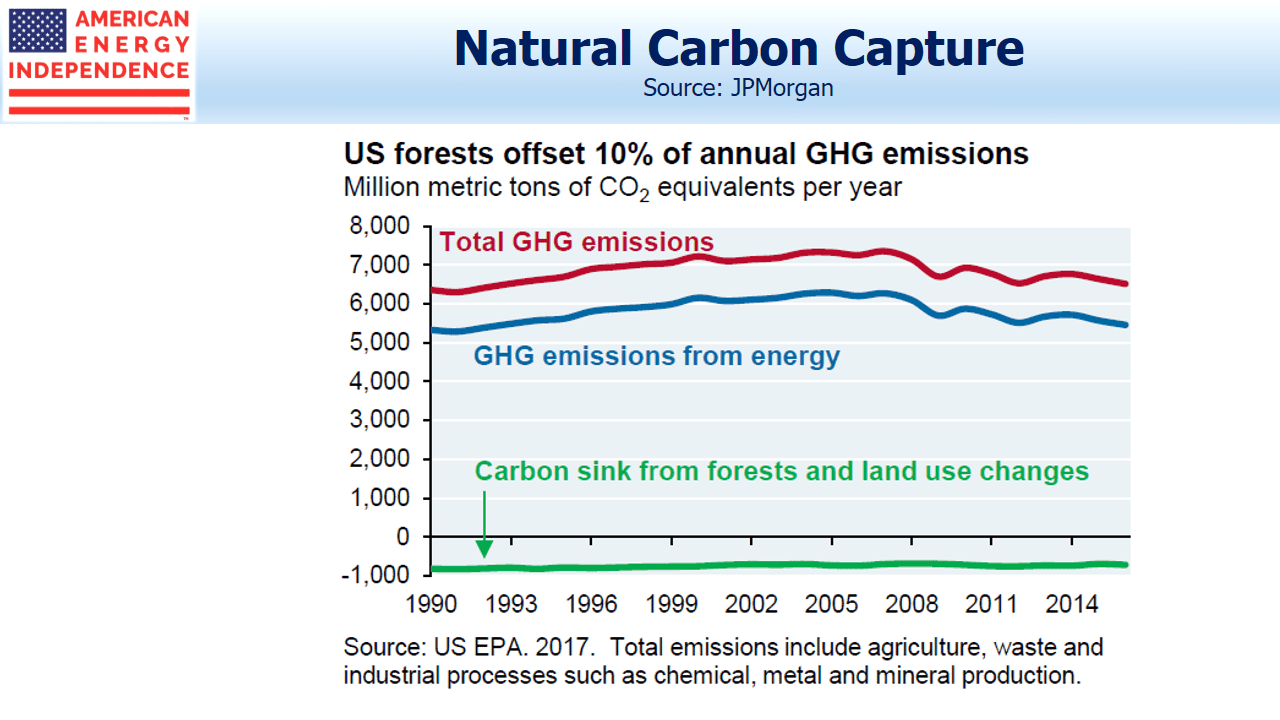
The GND promotes planting more trees. U.S. forestland of 750 million acres captures 10% of emissions. A 2017 study found that replanting trees on 20 million acres of cleared land could offset almost 1% of U.S. GHGs. This would be challenging; current U.S. Forest Service efforts are 120 thousand acres, around 0.5%.
Germany’s “Energiewende” has impressively lifted their renewable share of electricity generation to 38%. However, emission reductions are disappointing. Phasing out of nuclear power, and renewables intermittency (it’s not always sunny and windy) have increased use of coal. Further use of wind requires substantial investment in transmission infrastructure to link the windy north with population centers in the south.
The report is full of fascinating facts like these. Vaclav Smil is JPMorgan’s technical advisor. Smil is the author of 40 books, such as Energy and Civilization: A History. He’s a highly regarded thinker and his writings on energy development and use are absorbing. Smil, who is Bill Gates’ favorite author, describes the GND as “…not a useful foundation for a serious policy discussion.”
Energy Outlook 2019 ranks among Mike Cembalest’s best pieces of work. It’s highly readable.
SL Advisors is the sub-advisor to the Catalyst MLP & Infrastructure Fund. To learn more about the Fund, please click here.
SL Advisors is also the advisor to an ETF (USAIETF.com)
Important Disclosures
The information provided is for informational purposes only and investors should determine for themselves whether a particular service, security or product is suitable for their investment needs. The information contained herein is not complete, may not be current, is subject to change, and is subject to, and qualified in its entirety by, the more complete disclosures, risk factors and other terms that are contained in the disclosure, prospectus, and offering. Certain information herein has been obtained from third party sources and, although believed to be reliable, has not been independently verified and its accuracy or completeness cannot be guaranteed. No representation is made with respect to the accuracy, completeness or timeliness of this information. Nothing provided on this site constitutes tax advice. Individuals should seek the advice of their own tax advisor for specific information regarding tax consequences of investments. Investments in securities entail risk and are not suitable for all investors. This site is not a recommendation nor an offer to sell (or solicitation of an offer to buy) securities in the United States or in any other jurisdiction.
References to indexes and benchmarks are hypothetical illustrations of aggregate returns and do not reflect the performance of any actual investment. Investors cannot invest in an index and do not reflect the deduction of the advisor’s fees or other trading expenses. There can be no assurance that current investments will be profitable. Actual realized returns will depend on, among other factors, the value of assets and market conditions at the time of disposition, any related transaction costs, and the timing of the purchase. Indexes and benchmarks may not directly correlate or only partially relate to portfolios managed by SL Advisors as they have different underlying investments and may use different strategies or have different objectives than portfolios managed by SL Advisors (e.g. The Alerian index is a group MLP securities in the oil and gas industries. Portfolios may not include the same investments that are included in the Alerian Index. The S & P Index does not directly relate to investment strategies managed by SL Advisers.)
This site may contain forward-looking statements relating to the objectives, opportunities, and the future performance of the U.S. market generally. Forward-looking statements may be identified by the use of such words as; “believe,” “expect,” “anticipate,” “should,” “planned,” “estimated,” “potential” and other similar terms. Examples of forward-looking statements include, but are not limited to, estimates with respect to financial condition, results of operations, and success or lack of success of any particular investment strategy. All are subject to various factors, including, but not limited to general and local economic conditions, changing levels of competition within certain industries and markets, changes in interest rates, changes in legislation or regulation, and other economic, competitive, governmental, regulatory and technological factors affecting a portfolio’s operations that could cause actual results to differ materially from projected results. Such statements are forward-looking in nature and involves a number of known and unknown risks, uncertainties and other factors, and accordingly, actual results may differ materially from those reflected or contemplated in such forward-looking statements. Prospective investors are cautioned not to place undue reliance on any forward-looking statements or examples. None of SL Advisors LLC or any of its affiliates or principals nor any other individual or entity assumes any obligation to update any forward-looking statements as a result of new information, subsequent events or any other circumstances. All statements made herein speak only as of the date that they were made. r
Certain hyperlinks or referenced websites on the Site, if any, are for your convenience and forward you to third parties’ websites, which generally are recognized by their top level domain name. Any descriptions of, references to, or links to other products, publications or services does not constitute an endorsement, authorization, sponsorship by or affiliation with SL Advisors LLC with respect to any linked site or its sponsor, unless expressly stated by SL Advisors LLC. Any such information, products or sites have not necessarily been reviewed by SL Advisors LLC and are provided or maintained by third parties over whom SL Advisors LLC exercise no control. SL Advisors LLC expressly disclaim any responsibility for the content, the accuracy of the information, and/or quality of products or services provided by or advertised on these third-party sites.
All investment strategies have the potential for profit or loss. Different types of investments involve varying degrees of risk, and there can be no assurance that any specific investment will be suitable or profitable for a client’s investment portfolio.
Past performance of the American Energy Independence Index is not indicative of future returns.


Leave a Reply
Want to join the discussion?Feel free to contribute!