Oil and Gas Growth Powered by U.S.
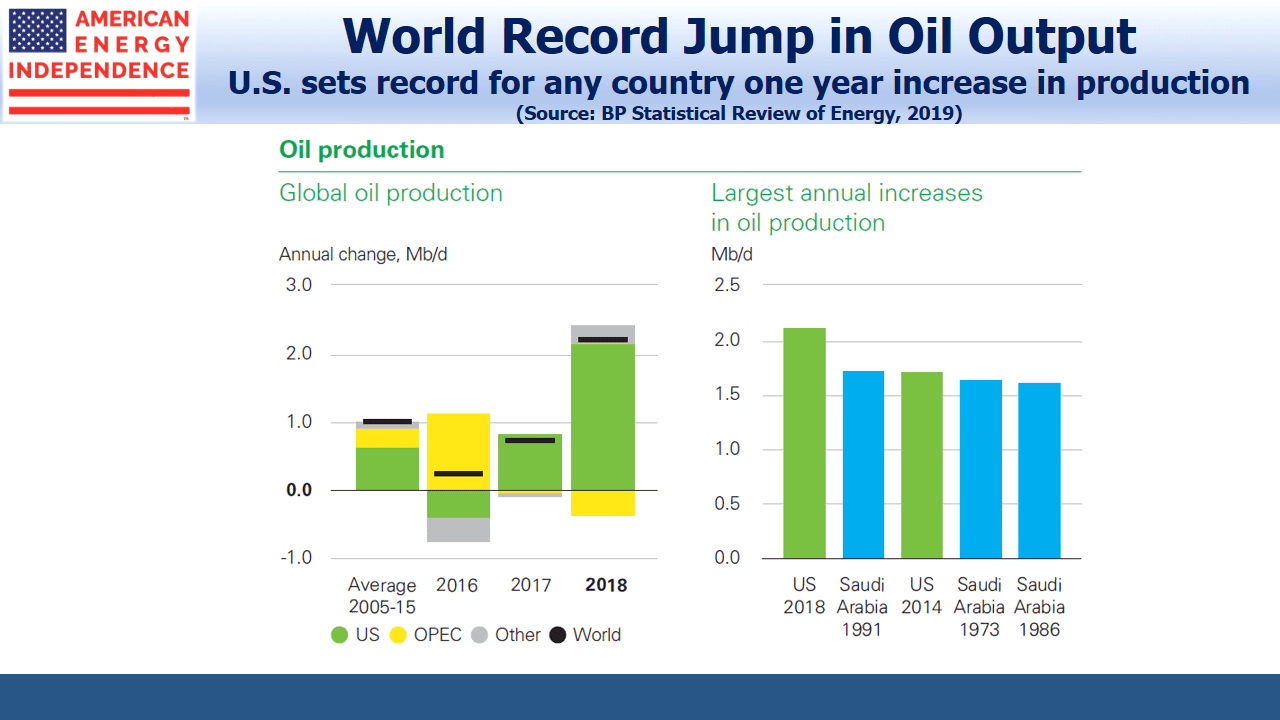
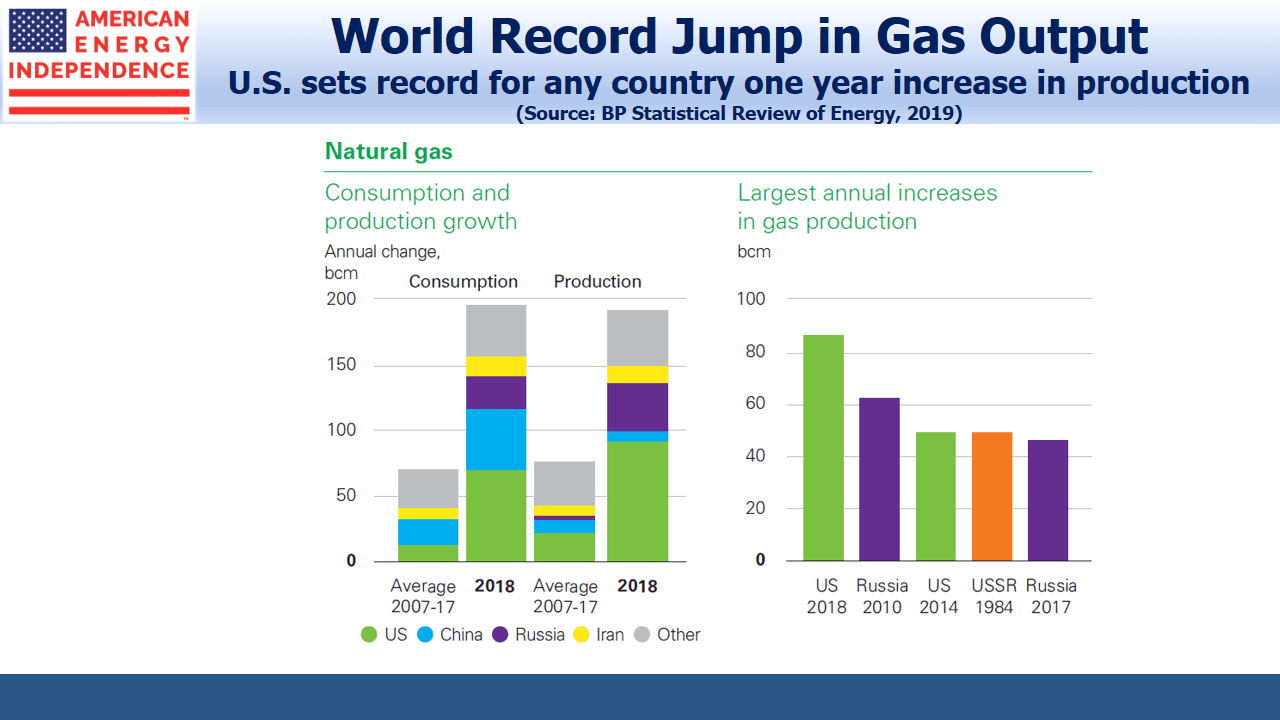
Last year the U.S. set a new world record for annual increase in production of oil and gas by any country in history. The recently-released BP Statistical Review of World Energy 2019 highlights these and many other useful facts.
Total U.S. energy consumption rose by 3.5% last year, the fastest in 30 years and a surprising jump following a decade of no growth. Growth in population and GDP have normally been offset by lower energy intensity and improving efficiency. But periods of extreme weather (both excessive heat and cold) boosted energy demand, as well increased use of ethane for America’s resurgent petrochemicals industry.
The U.S. was one fifth of the 2018 increase in global energy consumption, with China and India together representing half. Climate change and CO2 emissions figured prominently in the report. Developed countries desire lower emissions and emerging countries higher living standards. China consumes 42% more energy than the U.S., a gap that will grow in the decades ahead. The resolution of these conflicting goals dominates the outcome.
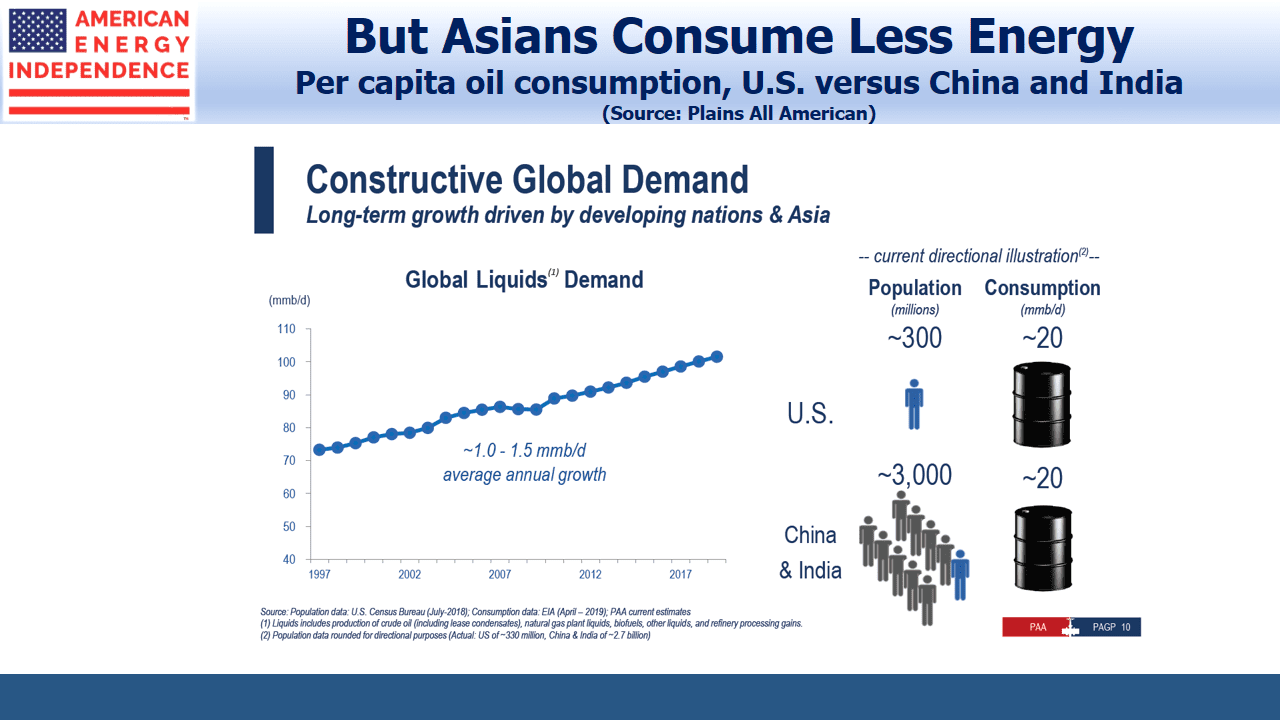
So it’s worth noting that the Asia-Pacific region energy consumption is more than double North America’s, and half of this comes from coal. The difference in coal volumes is by a factor of 8X. China alone consumes 6X as much coal as the U.S. But to illustrate unmet energy demand, China and India’s per capita consumption of crude oil is only 10% that of the U.S.
Until we confront these twin issues, little else that’s done to reduce emissions will have much impact.
Global carbon emissions grew by 600 million tons, or around 2%, the fastest for many years. This is the equivalent of increasing the global passenger car fleet by a third. Last week, India’s Adani Mining won Australian regulatory approval to begin developing one of the world’s largest untapped coalmines. Its critics contend that this project alone will eventually add 700 million tons of CO2 emissions, exceeding last year’s global increase from all sources. This is where India’s desire for more energy to raise living standards manifests itself. New York’s environmental extremists opposing a new natural gas pipeline might consider where the real problem lies.
Increased use of renewables alone will not solve the issues of climate change. BP notes that simply maintaining carbon emissions from the power sector at 2015 levels would have required growth in renewables generation at more than double the actual rate. The additional output is equal to all of the U.S. and China’s 2018 energy output from renewables.
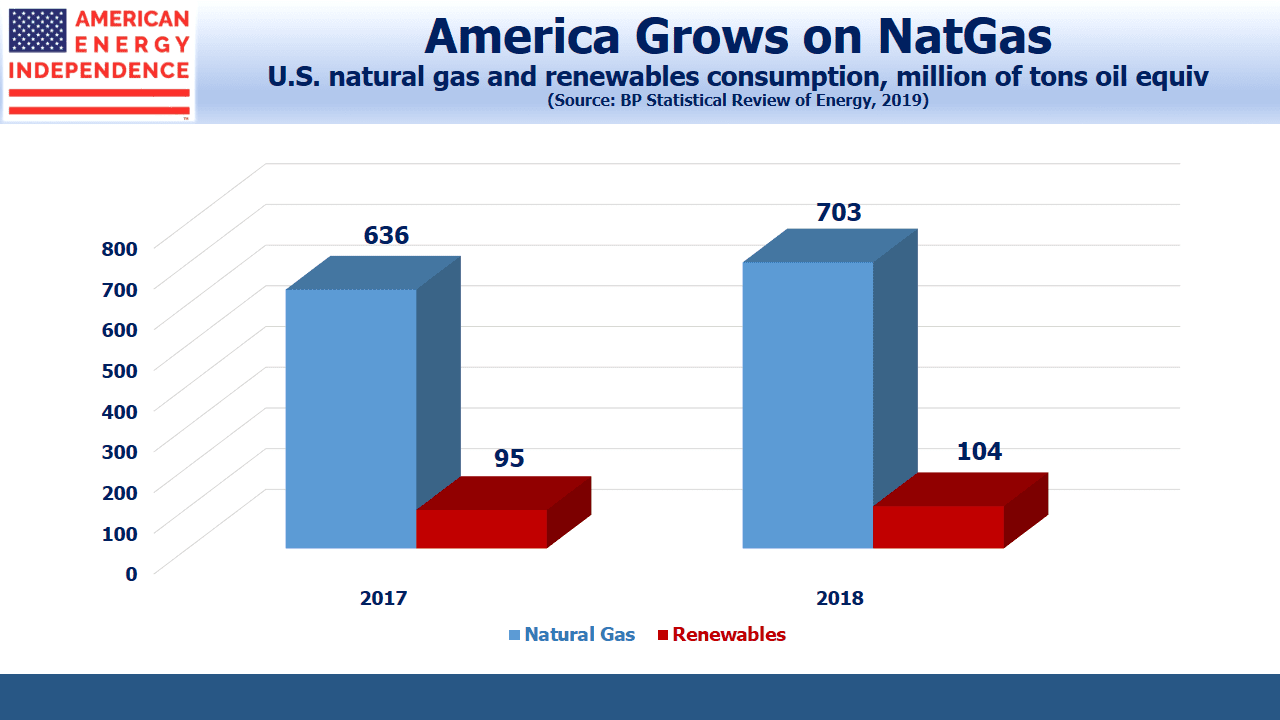
Natural gas provided 43% of the additional power the world consumed, more than twice that provided by renewables. For all the excitement about increasing use of solar and wind, their share rose by 1.4%. 84.7% of the world’s energy came from fossil fuels in 2018, versus 85.1% in 2017. As Bill Gates and others have pointed out, R&D should be directed towards making the 85% less carbon intensive, rather than trying to replace what obviously works.
Netpower is developing the ability to generate electricity from natural gas with no emissions, which would represent a significant breakthrough if successful.
It’s still possible to find writers warning of a production collapse because of shale’s chronic unprofitability. An article on Seeking Alpha (see Here’s Why Oil Stocks Are Priced For Armageddon) or Bethany Mclean’s Saudi America: The Truth About Fracking and How It’s Changing the World both reflect a simplistic view. Exxon Mobil (XOM), now the biggest driller in the Permian, clearly finds it profitable. Anadarko had two suitors for its Permian assets. Volumes keep growing, in defiance of some writers’ claims to better understand the economics.
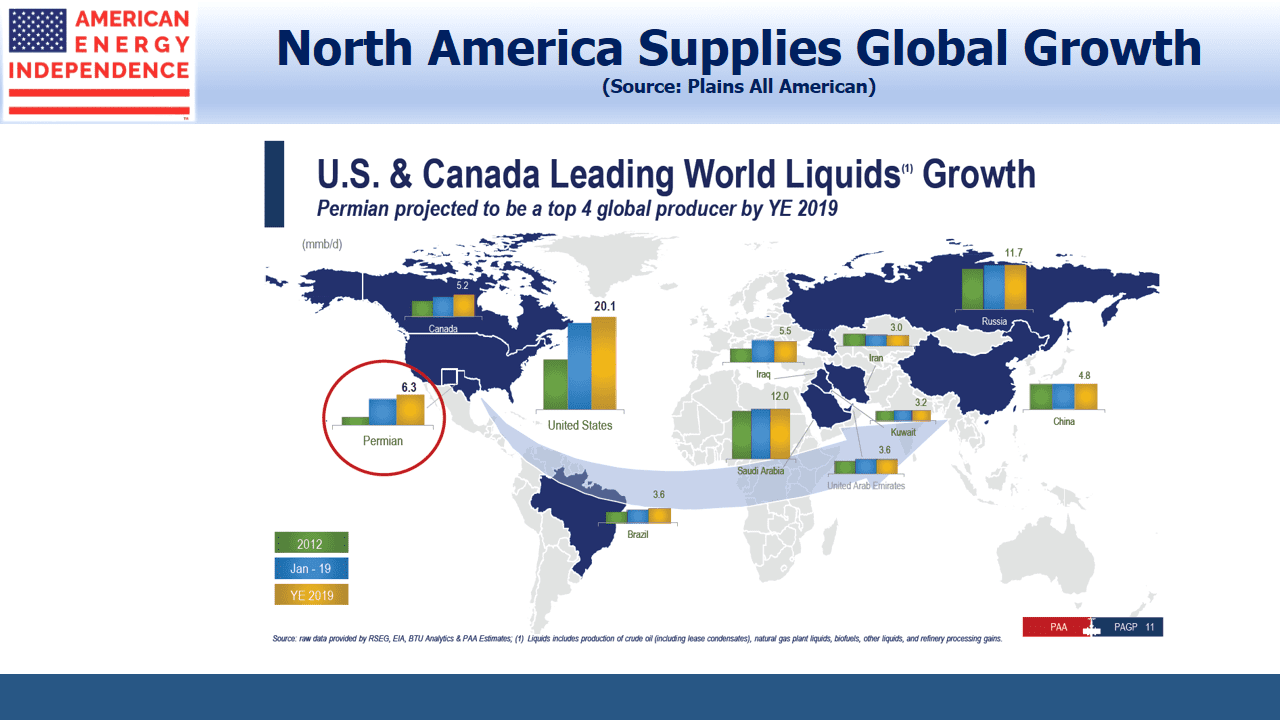
BP’s report showed that the 2.2 Million Barrels per Day (MMB/D) of increased global crude oil production came from the U.S., a point echoed in Plains All American’s (PAA) Investor Day.
The path to lower global emissions requires far more use of nuclear power, far less coal use in China and India, and more R&D into using existing energy sources more efficiently. Otherwise, investments in seawalls and flood mitigation will be a safer bet.
We are invested in PAA, via Plains GP Holdings.
SL Advisors is the sub-advisor to the Catalyst MLP & Infrastructure Fund. To learn more about the Fund, please click here.
SL Advisors is also the advisor to an ETF (USAIETF.com).
Important Disclosures
The information provided is for informational purposes only and investors should determine for themselves whether a particular service, security or product is suitable for their investment needs. The information contained herein is not complete, may not be current, is subject to change, and is subject to, and qualified in its entirety by, the more complete disclosures, risk factors and other terms that are contained in the disclosure, prospectus, and offering. Certain information herein has been obtained from third party sources and, although believed to be reliable, has not been independently verified and its accuracy or completeness cannot be guaranteed. No representation is made with respect to the accuracy, completeness or timeliness of this information. Nothing provided on this site constitutes tax advice. Individuals should seek the advice of their own tax advisor for specific information regarding tax consequences of investments. Investments in securities entail risk and are not suitable for all investors. This site is not a recommendation nor an offer to sell (or solicitation of an offer to buy) securities in the United States or in any other jurisdiction.
References to indexes and benchmarks are hypothetical illustrations of aggregate returns and do not reflect the performance of any actual investment. Investors cannot invest in an index and do not reflect the deduction of the advisor’s fees or other trading expenses. There can be no assurance that current investments will be profitable. Actual realized returns will depend on, among other factors, the value of assets and market conditions at the time of disposition, any related transaction costs, and the timing of the purchase. Indexes and benchmarks may not directly correlate or only partially relate to portfolios managed by SL Advisors as they have different underlying investments and may use different strategies or have different objectives than portfolios managed by SL Advisors (e.g. The Alerian index is a group MLP securities in the oil and gas industries. Portfolios may not include the same investments that are included in the Alerian Index. The S & P Index does not directly relate to investment strategies managed by SL Advisers.)
This site may contain forward-looking statements relating to the objectives, opportunities, and the future performance of the U.S. market generally. Forward-looking statements may be identified by the use of such words as; “believe,” “expect,” “anticipate,” “should,” “planned,” “estimated,” “potential” and other similar terms. Examples of forward-looking statements include, but are not limited to, estimates with respect to financial condition, results of operations, and success or lack of success of any particular investment strategy. All are subject to various factors, including, but not limited to general and local economic conditions, changing levels of competition within certain industries and markets, changes in interest rates, changes in legislation or regulation, and other economic, competitive, governmental, regulatory and technological factors affecting a portfolio’s operations that could cause actual results to differ materially from projected results. Such statements are forward-looking in nature and involves a number of known and unknown risks, uncertainties and other factors, and accordingly, actual results may differ materially from those reflected or contemplated in such forward-looking statements. Prospective investors are cautioned not to place undue reliance on any forward-looking statements or examples. None of SL Advisors LLC or any of its affiliates or principals nor any other individual or entity assumes any obligation to update any forward-looking statements as a result of new information, subsequent events or any other circumstances. All statements made herein speak only as of the date that they were made. r
Certain hyperlinks or referenced websites on the Site, if any, are for your convenience and forward you to third parties’ websites, which generally are recognized by their top level domain name. Any descriptions of, references to, or links to other products, publications or services does not constitute an endorsement, authorization, sponsorship by or affiliation with SL Advisors LLC with respect to any linked site or its sponsor, unless expressly stated by SL Advisors LLC. Any such information, products or sites have not necessarily been reviewed by SL Advisors LLC and are provided or maintained by third parties over whom SL Advisors LLC exercise no control. SL Advisors LLC expressly disclaim any responsibility for the content, the accuracy of the information, and/or quality of products or services provided by or advertised on these third-party sites.
All investment strategies have the potential for profit or loss. Different types of investments involve varying degrees of risk, and there can be no assurance that any specific investment will be suitable or profitable for a client’s investment portfolio.
Past performance of the American Energy Independence Index is not indicative of future returns.




Leave a Reply
Want to join the discussion?Feel free to contribute!