Why Risk Parity Could Boost Energy Stocks
Risk Parity is a portfolio construction technique that seeks to allocate capital so as to maintain similar levels of risk from each asset. Some commentators are blaming it for the recent market turmoil, since superficially its practitioners are expected to reduce risk when it rises. That can often mean selling stocks. AQR is among the asset managers who employ this approach. In 2010 they published a paper explaining the theory, noting that traditional portfolios typically derive a larger proportion of their risk from equities than is implied by simply looking at percentage allocations.
A 60:40 stocks/bonds portfolio will incur more than 60% of its risk from stocks, because they move more than bonds. Risk Parity seeks to compensate for this, and the paper showed improved returns over a passive 60:40 approach. The paper goes on to describe a portfolio with less equity exposure than a traditional 60:40 portfolio and correspondingly less risk. Because it has a higher Sharpe Ratio (i.e. better risk/return) but lower return, leverage is then employed to raise the risk to the same as 60:40, at which point the return should be higher.
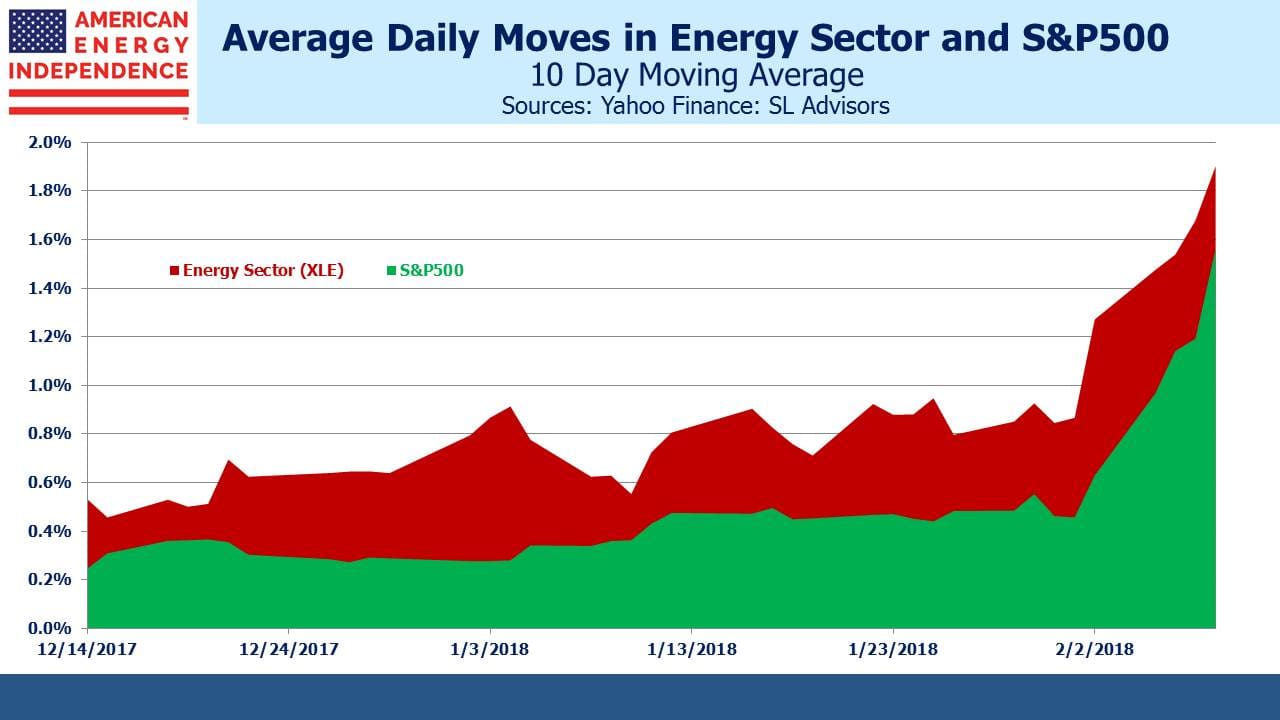
Since allocations under a Risk Parity regime target a given level of risk, changes in risk estimates will lead to a shift in allocations, and may also require changes to leverage. One popular measure of risk is volatility. For simplicity, we’ve defined it as the average percentage daily move over the prior ten days. Although Risk Parity is typically applied to asset classes, the concept can also be applied to sectors within an asset class. A strategy of achieving Risk Parity among asset classes can also be designed to achieve Risk Parity across sectors within an asset class.
In response to criticism that funds employing Risk Parity are behind the recent sharp moves, some managers of such funds have responded that such shifts are slow – their models are designed to recalibrate over longer periods than just a few days. It’s impossible to know the extent to which the critics are right — on Friday JPMorgan estimated that most of the “severe” unwind was over. However, we’ve noticed another shift, which is that risk in the energy sector is falling relative to the S&P500. This is partly due to correlations increasing, as they do during market dislocations. Sector differentiation becomes less important than overall market exposure, and sectors move up and down together. For example, the S&P Low Volatility Index is down 6.5% for the month, almost as much as the S&P500 itself (down 7.2%), even though Low Vol should be, well, less volatile.
Nonetheless, Risk Parity strategies that are deployed at the sector level could eventually increase energy exposure at the expense of other sectors whose relative volatility against the S&P500 has increased.
It can seem an arcane topic. But put simply, in a time of heightened volatility, the Energy sector is gyrating with the rest of the market whereas it was previously moving sometimes twice as much. The first chart compares XLE with SPY, where although average daily moves have increased in both cases, SPY moves have jumped by 150% while XLE moves have “only” doubled.
Many reliable trends have abruptly shifted, including persistent low volatility. The spectacular collapse of the Credit Suisse note (XIV) following the spike in volatility was extraordinary. Why would people hold a product that seems destined to eventually blow up?
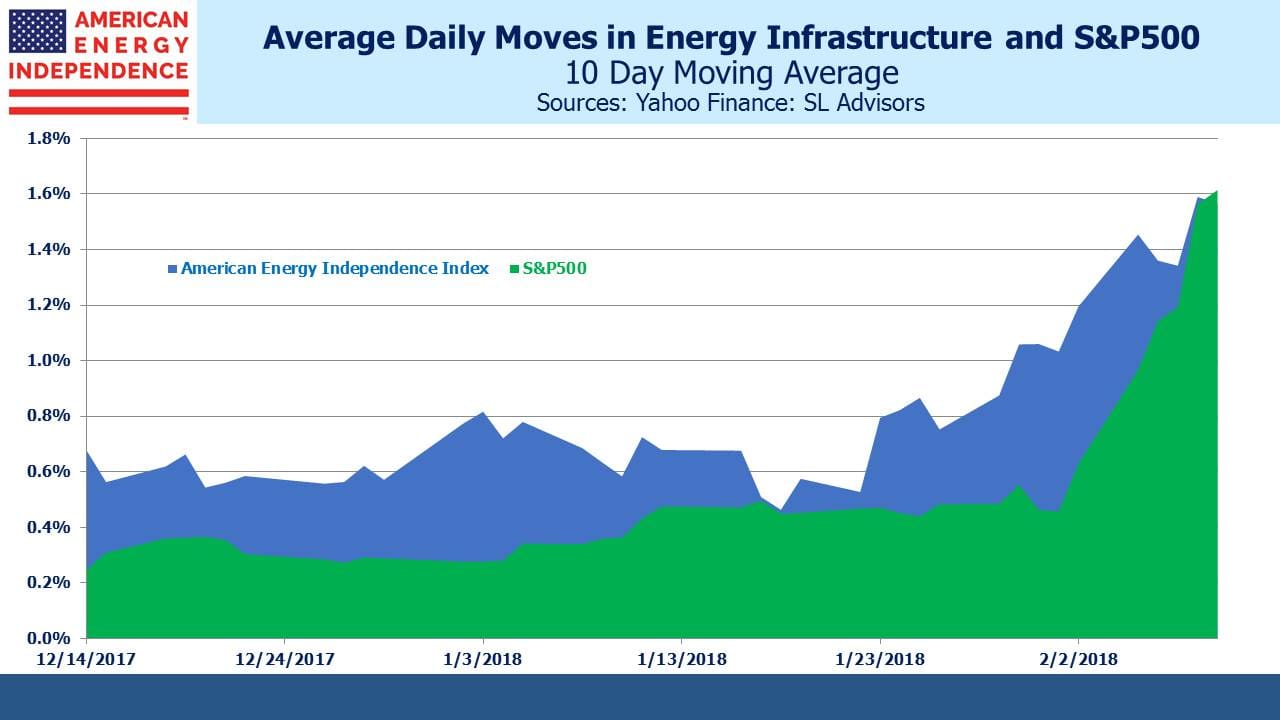
The difference in volatility is more dramatic when comparing Energy Infrastructure (defined here by the American Energy Independence Index) with the S&P500. Their average daily moves are roughly the same. Until recently, energy infrastructure (including MLPs) was moving twice as much as the broader market. Domestic, midstream assets that support U.S. energy independence have experienced a comparatively modest increase in volatility compared to the overall market. Daily moves in the S&P500 and energy infrastructure are converging. At a time of increased uncertainty, if investors begin to value the more reliable cashflows these companies generate, further buying of the sector will follow.
The American Energy Independence Index (AEITR) finished the week -4.2%, outperforming the S&P500 which was -5.2%.
Important Disclosures
The information provided is for informational purposes only and investors should determine for themselves whether a particular service, security or product is suitable for their investment needs. The information contained herein is not complete, may not be current, is subject to change, and is subject to, and qualified in its entirety by, the more complete disclosures, risk factors and other terms that are contained in the disclosure, prospectus, and offering. Certain information herein has been obtained from third party sources and, although believed to be reliable, has not been independently verified and its accuracy or completeness cannot be guaranteed. No representation is made with respect to the accuracy, completeness or timeliness of this information. Nothing provided on this site constitutes tax advice. Individuals should seek the advice of their own tax advisor for specific information regarding tax consequences of investments. Investments in securities entail risk and are not suitable for all investors. This site is not a recommendation nor an offer to sell (or solicitation of an offer to buy) securities in the United States or in any other jurisdiction.
References to indexes and benchmarks are hypothetical illustrations of aggregate returns and do not reflect the performance of any actual investment. Investors cannot invest in an index and do not reflect the deduction of the advisor’s fees or other trading expenses. There can be no assurance that current investments will be profitable. Actual realized returns will depend on, among other factors, the value of assets and market conditions at the time of disposition, any related transaction costs, and the timing of the purchase. Indexes and benchmarks may not directly correlate or only partially relate to portfolios managed by SL Advisors as they have different underlying investments and may use different strategies or have different objectives than portfolios managed by SL Advisors (e.g. The Alerian index is a group MLP securities in the oil and gas industries. Portfolios may not include the same investments that are included in the Alerian Index. The S & P Index does not directly relate to investment strategies managed by SL Advisers.)
This site may contain forward-looking statements relating to the objectives, opportunities, and the future performance of the U.S. market generally. Forward-looking statements may be identified by the use of such words as; “believe,” “expect,” “anticipate,” “should,” “planned,” “estimated,” “potential” and other similar terms. Examples of forward-looking statements include, but are not limited to, estimates with respect to financial condition, results of operations, and success or lack of success of any particular investment strategy. All are subject to various factors, including, but not limited to general and local economic conditions, changing levels of competition within certain industries and markets, changes in interest rates, changes in legislation or regulation, and other economic, competitive, governmental, regulatory and technological factors affecting a portfolio’s operations that could cause actual results to differ materially from projected results. Such statements are forward-looking in nature and involves a number of known and unknown risks, uncertainties and other factors, and accordingly, actual results may differ materially from those reflected or contemplated in such forward-looking statements. Prospective investors are cautioned not to place undue reliance on any forward-looking statements or examples. None of SL Advisors LLC or any of its affiliates or principals nor any other individual or entity assumes any obligation to update any forward-looking statements as a result of new information, subsequent events or any other circumstances. All statements made herein speak only as of the date that they were made. r
Certain hyperlinks or referenced websites on the Site, if any, are for your convenience and forward you to third parties’ websites, which generally are recognized by their top level domain name. Any descriptions of, references to, or links to other products, publications or services does not constitute an endorsement, authorization, sponsorship by or affiliation with SL Advisors LLC with respect to any linked site or its sponsor, unless expressly stated by SL Advisors LLC. Any such information, products or sites have not necessarily been reviewed by SL Advisors LLC and are provided or maintained by third parties over whom SL Advisors LLC exercise no control. SL Advisors LLC expressly disclaim any responsibility for the content, the accuracy of the information, and/or quality of products or services provided by or advertised on these third-party sites.
All investment strategies have the potential for profit or loss. Different types of investments involve varying degrees of risk, and there can be no assurance that any specific investment will be suitable or profitable for a client’s investment portfolio.
Past performance of the American Energy Independence Index is not indicative of future returns.


Leave a Reply
Want to join the discussion?Feel free to contribute!