Rallying Crude

It doesn’t look like a bull market, but July was crude’s best month in more than a year with the Brent benchmark closing up almost $11 per barrel at over $84. After peaking in spring of last year following Russia’s invasion of Ukraine, crude oil has been sliding irregularly lower. Russia has found ways to get its product to market, to the quiet relief of western Europe’s governments whose application of sanctions has been constrained by a desire to avoid causing a price spike. China’s long Covid lockdown further depressed demand.

OPEC wants stable, high prices and regularly tweaks output to that end. Traders now expect Saudi Arabia to extend their voluntary production cuts of one Million Barrels per day (MMB/D) into September. The US is also replenishing the Strategic Petroleum Reserve following the Administration’s blatantly political release of reserves in the run up to last year’s mid-term elections.

.avia-image-container.av-94d0n7-07accca7323b6cf1d9b9bc6436db0eea img.avia_image{ box-shadow:none; } .avia-image-container.av-94d0n7-07accca7323b6cf1d9b9bc6436db0eea .av-image-caption-overlay-center{ color:#ffffff; }

Recession fears are also receding, helped by last week’s US 2Q GDP report. Goldman Sachs recently increased their forecast for global oil demand but stuck to their one year forecast of $93 for Brent. For now, the Fed has confounded the skeptics who believed monetary tightening would cause a recession (see Jay Powell’s Victory Lap)

.avia-image-container.av-1zh5rwj-610cc5acb3eddc241f4a25927397dd32 img.avia_image{ box-shadow:none; } .avia-image-container.av-1zh5rwj-610cc5acb3eddc241f4a25927397dd32 .av-image-caption-overlay-center{ color:#ffffff; }

Peak oil is still out there somewhere, but for now demand keeps growing. The US Energy Information Administration (EIA) calculates that the second quarter saw record global liquids consumption of 100.96 MMB/D, marginally above the prior record of 3Q18 (100.91 MMB/D). For 2024 the EIA is forecasting 102.80 MMB/D, up from 101.15 MMB/D this year.

.avia-image-container.av-1higqmb-dcd80b4290fa7e633ab3c9f9766f971e img.avia_image{ box-shadow:none; } .avia-image-container.av-1higqmb-dcd80b4290fa7e633ab3c9f9766f971e .av-image-caption-overlay-center{ color:#ffffff; }

The hot weather we’ve recently experienced in the US has boosted energy demand. But above average temperatures haven’t been the norm throughout the northern hemisphere. In any case, your blogger finds 90+ degrees less distressing than most following a childhood in the UK where the climate is euphemistically referred to as “temperate”, thanks to the moderating effect of the gulf stream. Damp and cool might be more accurate, as the current forecast shows. Britain’s efforts at lowering CO2 emissions are especially selfless, because they could surely benefit from an extra couple of degrees.

Record natural gas consumption for power generation has helped keep Americans cool over the past few days, with an estimated 52.9 Billion Cubic Feet (BCF) burned last Friday. That compares with an average daily consumption forecast for this year by the EIA of 34.5 BCF, which is up 1.3 BCF/Day from 2022.

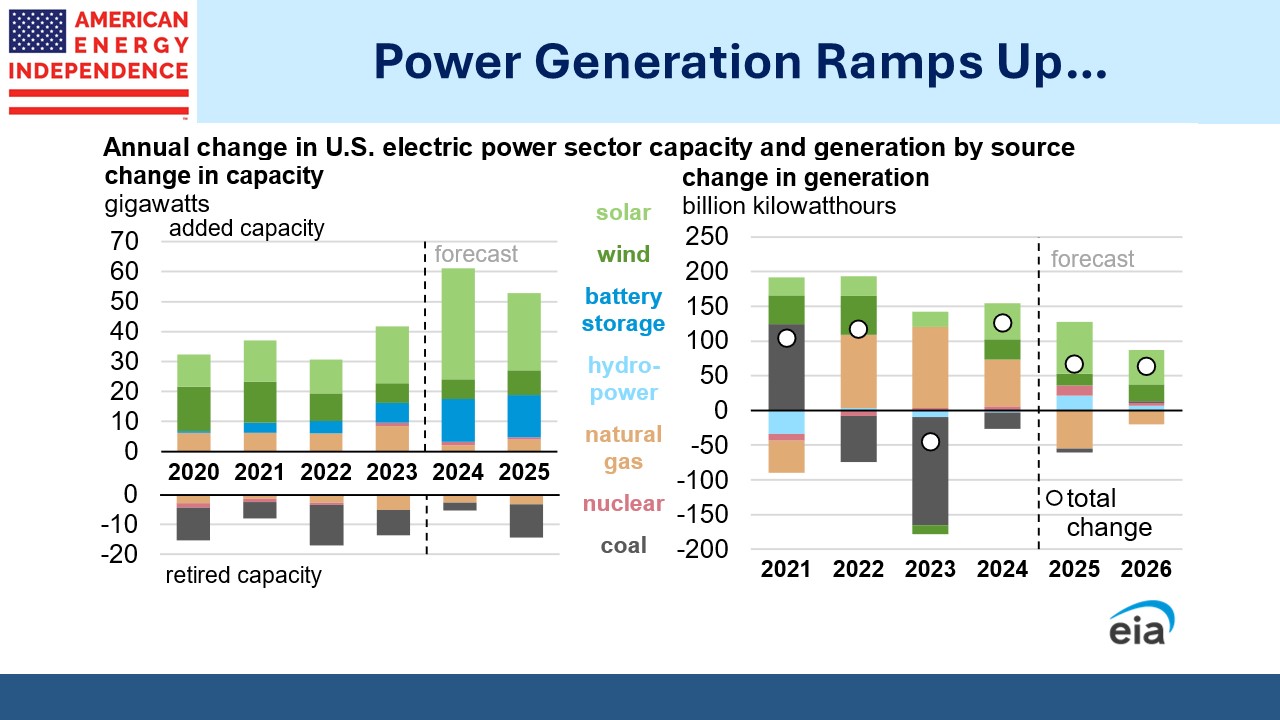
Union Pacific expects railroad shipments of coal to receive a warm weather boost, as coal-burning power plants ramp out consumption to meet increased demand for air conditioning. However, coal is rapidly losing its share of power generation at 15%, down from 28% five years ago. Natural gas remains America’s favorite source of power at 41% this year, up from 39% last year. Solar is at 4% and wind 11%, both flat year-on-year.

.avia-image-container.av-17bjahv-544ee943478821eeb3387e10e9f0cc9b img.avia_image{ box-shadow:none; } .avia-image-container.av-17bjahv-544ee943478821eeb3387e10e9f0cc9b .av-image-caption-overlay-center{ color:#ffffff; }

TC Energy (TRP) announced they’d be splitting the company into two last week on Thursday, 27th. Usually such announcements boost a company’s stock because it’s assumed each new entity will benefit from more focused management attention. Oddly, TRP sank on the news.

Three days earlier TRP had announced the sale of 40% of their Columbia pipeline system to Global Infrastructure Partners. The 10.5X EBITDA multiple was below what some analysts had valued the business at in their sum-of-the-parts analysis. This was followed by the spin-off announcement, and the relatively high projected 5.0X Debt:EBITDA leverage of the new stand-alone liquids business is high relative to peers.

After the price drop, TRP now yields over 8%. Canadian pipeline companies have a more robust history of maintaining dividends than their southern counterparts. A sustainable dividend at this level is likely to find value-oriented buyers.

.avia-image-container.av-lx03dv-f0adbe1b3c9f7267b334419486b5761f img.avia_image{ box-shadow:none; } .avia-image-container.av-lx03dv-f0adbe1b3c9f7267b334419486b5761f .av-image-caption-overlay-center{ color:#ffffff; }

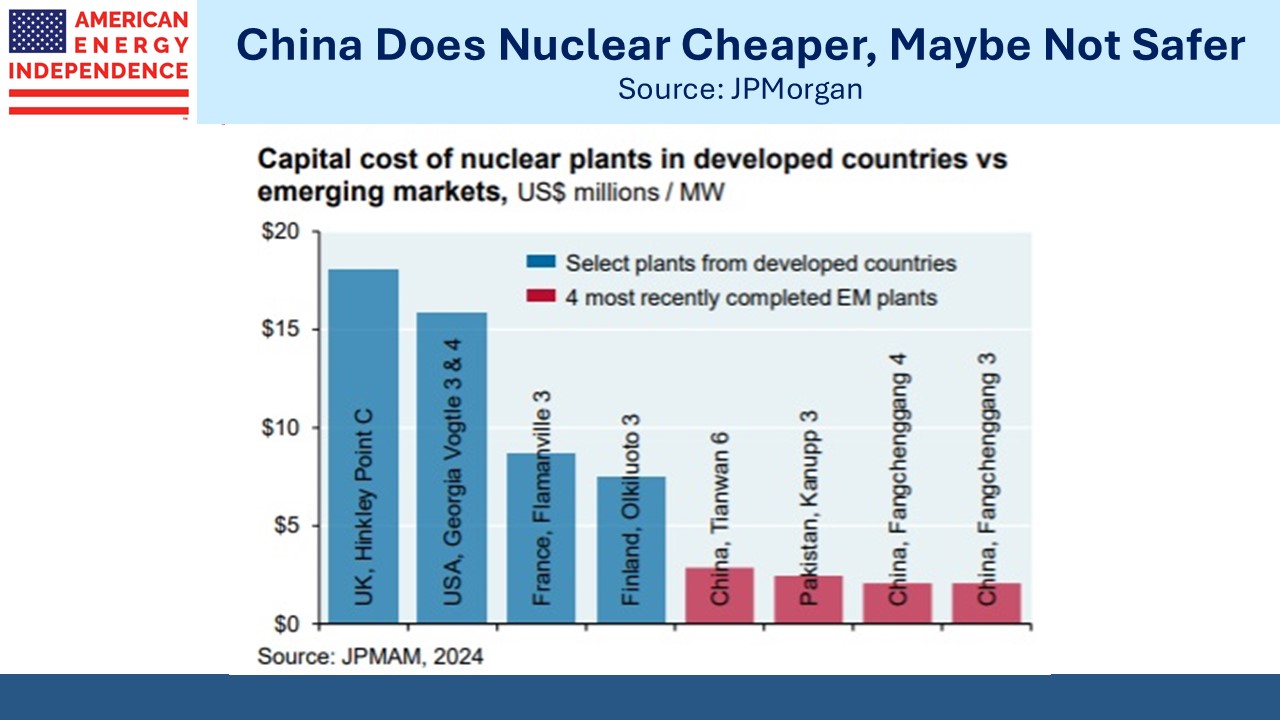
Finally, the Vogtle nuclear power plant in Georgia began commercial operations recently. It’s the first new nuclear power plant in the US since 2016 and only the second since 1996. The long hiatus since the early 1990s reflects public skepticism about nuclear safety along with the successful use of legal challenges by opponents to impede development. Nuclear power is expensive because our broken permitting process allows opponents to use the courts to insert unpredictable delays. This boosts the cost, thereby depressing the IRR. The same techniques have been used to delay needed pipeline infrastructure.

The Mountain Valley pipeline is an example – even though Congress recently fast-tracked its approval under the Fiscal Responsibility Act that headed off a debt ceiling crisis, a DC court still saw fit to impose a stay on resumed construction. It took an emergency ruling from the US Supreme Court (a “stay of the stay”) to allow construction to begin again. Long distance high power transmission lines and the related infrastructure in support of solar and wind will face similar headwinds. Reform of infrastructure permitting is an issue that both ends of the political divide should agree is well overdue.

We have three funds that seek to profit from this environment:

Energy Mutual Fund

Energy ETF

Inflation Fund


Jay Powell’s Victory Lap

Criticizing the Fed is a self-indulgence afforded the rest of us unburdened with the need to actually set monetary policy. The FOMC usually provides a target-rich environment. The last couple of years have offered a sumptuous feast of mis-steps. 

Start with synchronization of accommodative monetary policy with Biden’s uber-stimulus following his inauguration in early 2021. Quantitative Easing (QE) was promoted from a one-off solution to the 2008 great financial crisis to just another part of the Fed’s toolkit. Over the past fifteen years their balance sheet has taken a series of steps higher, from $1TN to $8TN, with only brief episodes of contraction. They don’t seem to know how to shrink it, so the partial monetization of our debt continues. 

Monetary policy has adopted its own vocabulary, repurposing words such as hawk and dove. Transitory has become a pejorative word since it more accurately described the seeming permanence of high inflation. One imagines a freshman Economics class at Harvard where a self-appointed member of the monetary policy cognoscenti derides a fellow student’s poor grades as transitory.  

Your blogger has taken regular shots at the Fed with irrational exuberance (see Time For Powell To Go). It’s just so easy. 

.avia-image-container.av-2z272f-fd3989ac66ce1c3b9efa54abb0659fcc img.avia_image{ box-shadow:none; } .avia-image-container.av-2z272f-fd3989ac66ce1c3b9efa54abb0659fcc .av-image-caption-overlay-center{ color:#ffffff; }

So Fed chair Jay Powell might have permitted himself a small victory lap in the green room last Wednesday out of sight of the cameras following his press conference. He’d just announced another hike in the Fed Funds target range, to 5.25-5.5%. As recently as May SOFR futures had been priced for a summer’s end rate of 4.7% with imminent easing. Since then, the June ‘24 futures yield has risen almost 2%, conceding to the Fed. Powell said it’s unlikely they’ll cut rates this year. 

Inflation has been falling – not yet to the Fed’s 2% target but heading that way. JPMorgan is forecasting CPI inflation of 2.4% by next spring. The FOMC is projecting their preferred inflation measure using the Personal Consumption Expenditures (PCE) deflator to average 2.5% next year. PCE tends to be 0.2-0.4% below CPI because its weights adjust dynamically (CPI weights are updated biennially). So the FOMC inflation forecast is more conservative than JPMorgan’s. They expect PCE inflation to reach 2.1% by 2025.  

For months economists have been warning of a recession. JPMorgan projects that 4Q23 and 1Q24 GDP will each be –0.5%, meeting the technical definition of a recession which is two consecutive quarters of GDP contraction. But the day after the Fed raised rates second quarter GDP came in at 2.4%, ahead of expectations as consumption remained strong. Powell has maintained for months that a recession could be avoided, and he reiterated that view at his Wednesday press conference.  

One way to think about the Fed’s dual mandate of seeking maximum employment consistent with stable prices is that they focus on whichever of these two metrics is most off target. Hence in 2020 with inflation stubbornly low they said they’d tolerate higher inflation than in the past in order to achieve higher employment. That reinterpretation of their goals was as transitory as the higher inflation that followed.  

Older readers will remember Ronald Reagan citing the “Misery Index” (Inflation + Unemployment Rate) under President Jimmy Carter as reason to vote him out. If FOMC policymakers ran for office rather than being political appointees, Powell would be running ads proclaiming the Utopian Index (think of it as the Misery Index when it’s low) was looking as good as ever on his watch.  

Full employment is probably still somewhere above 4%, since the time it’s been below 4% has coincided with inflationary wage growth. Both JPMorgan and the FOMC are projecting unemployment next year of around 4.5% and inflation of around 2.5%. If things turn out that way, it will represent a deft monetary policy navigation that seemed implausible just a few months ago.  

Even hyper-active Jim Cramer, ever sensitive to the market’s zeitgeist, asserted on Thursday morning that he had always been a supporter of Fed chair Powell. He proclaimed himself a “Jay fan” — and even a “Jay Hawk.” 

Therefore, we must be at Peak Powell. The Fed’s critics have been relentlessly disarmed by empirical data that suited the Fed’s narrative more than theirs. Recession fears are receding. Inflation has not resisted downward pressure too stubbornly. Partial debt monetization via QE has not led to a collapse of the dollar or hyperinflation. The stock market has remained buoyant, unbowed by the improving returns offered by fixed income. Events have hewed more closely to what Powell told us to expect than the naysayers.  

Jay Powell should gratefully accept whatever accolades come his way. Popularity for a Fed chair is ephemeral. The economy is a fickle mistress. He is, for now, on top.  

We have three funds that seek to profit from this environment:
Energy Mutual Fund

Energy ETF

Inflation Fund


Oneok-Magellan Outcome Too Close To Call

The market currently assigns barely 50/50 odds of the Oneok-Magellan (OKE-MMP) merger receiving shareholder approval from both companies. When the deal was announced in May approval was judged to be highly likely, but it soon receded as analysts offered only lukewarm approval. We offered our view (see Oneok Does A Deal Nobody Needs) within a few days. In mid-June Jim Murchie of Energy Income Partners (EIP) wrote an open letter criticizing the transaction as not good for MMP unitholders, especially long-term investors whose recapture on deferred taxes will exceed the $25 per MMP unit being offered in the transaction.

EIP released a second open letter on July 17 which reinforced their reasons for remaining opposed to the merger. They contrast MMP’s current fear that electric vehicle adoption will threaten their refined products pipeline volumes with recent previously expressed confidence in their outlook. They calculate that the deal premium is inadequate to compensate MMP unitholders for the tax payments they’ll have to make. EIP correctly argues that while MMP unitholders already had the deferred tax liability that will come due if the deal closes, they currently have some control over when to realize that liability. The OKE-MMP transaction will make those deferred taxes due now. Control over the timing of one’s tax bill has value, which this transaction fails to acknowledge.

.avia-image-container.av-10crigs-396801dfce0c828ecc8fa947e690e242 img.avia_image{ box-shadow:none; } .avia-image-container.av-10crigs-396801dfce0c828ecc8fa947e690e242 .av-image-caption-overlay-center{ color:#ffffff; }

The deal’s odds of success bottomed out in mid-June with EIP’s first letter. They subsequently recovered but have dipped again over the past week with the second letter. The market has already offered its opinion on the transaction, and it is value-destroying.

The 22% premium promised with the initial press release quickly evaporated as OKE stock sank, reducing its value as partial payment for MMP units. From the day preceding the deal announcement, MMP is today up 9% compared with its sector, defined as the American Energy Independence Index (AEITR).  OKE has lagged the AEITR by 4%. Because OKE’s market cap is around 2.3X MMP’s, an investor holding a market weight position in both companies is worse off than if she had simply held the AEITR. In aggregate, OKE and MMP investors together are $2.5BN worse off than if they had been invested in diversified midstream energy infrastructure. It’s therefore fair to say that even the modest likelihood of the deal’s approval has already destroyed $2.5BN in value. If the deal closes, investor losses will be even greater.

.avia-image-container.av-rewku4-525f5fb908871b9b841de96e6c552d5d img.avia_image{ box-shadow:none; } .avia-image-container.av-rewku4-525f5fb908871b9b841de96e6c552d5d .av-image-caption-overlay-center{ color:#ffffff; }

We remain unconvinced of the deal’s merits and solidly opposed, eagerly awaiting the opportunity to vote NO twice – once on our OKE holding and again on our MMP holding.

Sometimes the most profitable capital allocation decisions are to divest assets rather than acquire them. This is the case with Kinder Morgan (KMI) and their sale of the Transmountain Pipeline expansion project (TMX) to Canada’s federal government in 2018. KMI had found themselves caught in the middle of a political dispute between oil-producing Alberta who wanted the added capacity to transport its crude to the Pacific coast, and liberal British Columbia who opposed it. Canada’s PM Justin Trudeau led the Canadian government’s acquisition of TMX for C$4.5BN, arguing its completion was in the national interest.

Five years later TMX is less than a year from completion and the cost looks like C$30.9BN, around 4X what KMI estimated when they began the project in 2016. As recently as February 2020 the Canadian government, which was by then the owner, estimated C$12.6BN. Then Covid forced a suspension of activity. Ongoing legal challenges from environmentalists and flooding added delays. Other drivers of higher costs cited include: “general construction industry and materials cost inflation, supply chain challenges, labor shortages, preservation of indigenous archaeological discoveries along the pipeline’s route, and low contractor productivity.”

Because the Canadian government wants to recoup its investment, the ballooning cost of TMX will be reflected in higher tariffs for shippers using the pipeline. Precise charges depend on the amount of capacity a shipper has committed to use and the term of the agreement. But RBN Energy, who recently published a detailed analysis of TMX, estimates that some customers could wind up paying more than C$10 per barrel.

To illustrate how expensive this is, Enbridge’s Canadian Mainline pipeline, which runs from Edmonton to the US midwest where it connects to pipelines to the US gulf coast, offers similar pricing. So Canadian Mainline will be competitive with TMX for access to crude oil export terminals even though it covers almost 3X the distance.

The outcome vindicates KMI’s decision to sell TMX. At the time the company said they would shut down the project if they couldn’t sell it. Had KMI retained TMX and continued construction throughout its tumultuous last five years, the spiraling cost would have weighed significantly on its stock price. Asset sales don’t come with a post-disposition IRR, but this might be the best capital allocation decision KMI has made in a very long time.

We have three funds that seek to profit from this environment:
Energy Mutual Fund

Energy ETF

Inflation Fund


LNG Growth Faces Few Headwinds

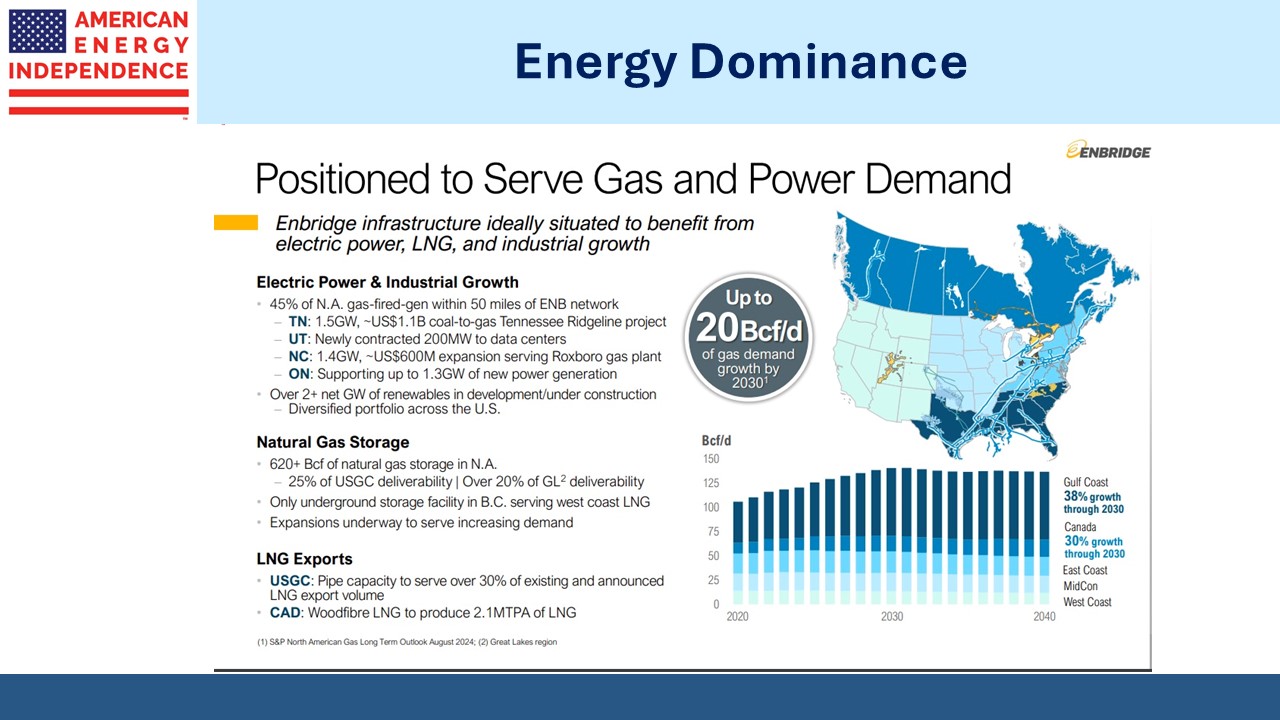
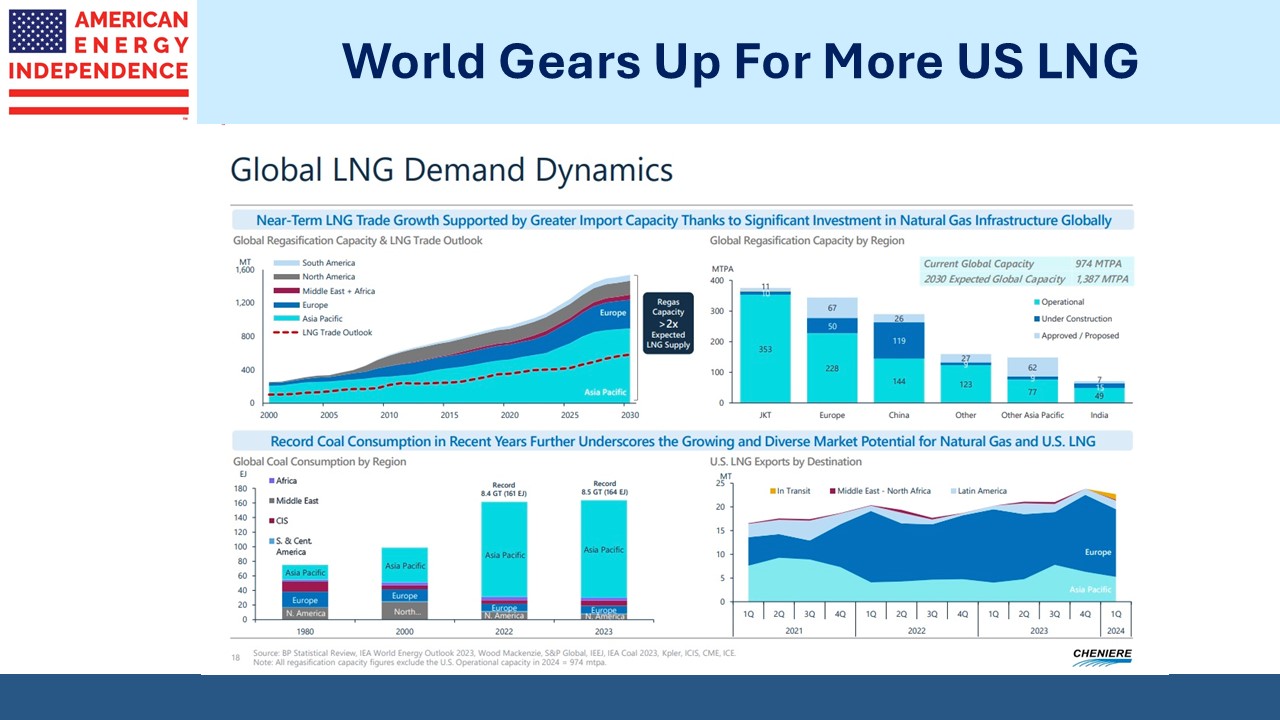
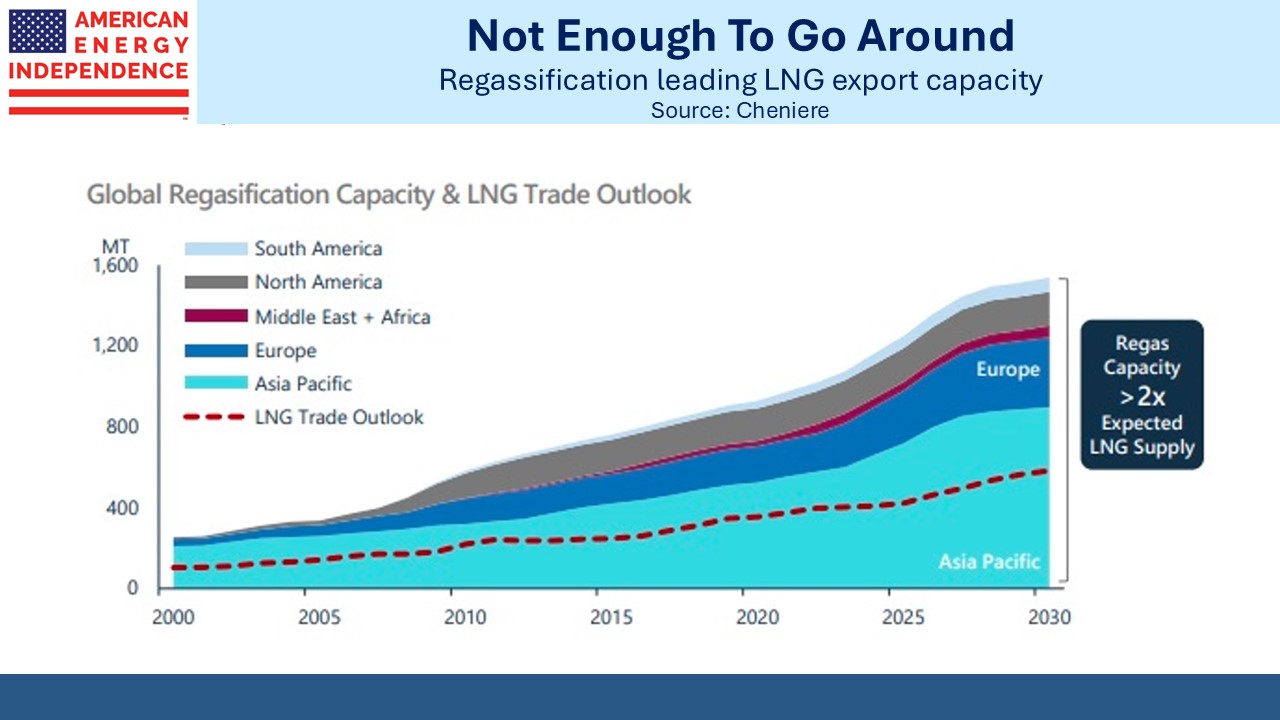
Exxon Mobil (XOM) is not typically associated with Liquefied Natural Gas (LNG) but they are planning to double the volumes they handle by 2030, to 40 million tonnes pa. This would be equivalent to around 5.3 Billion Cubic Feet per Day (BCF/D). The US currently exports around 12 BCF/D although that will grow as new LNG export capacity is developed. XOM is a JV partner in the Golden Pass LNG Terminal in Sabine Pass, LA along with Qatar Energy. They have ownership stakes in LNG infrastructure around the world including in Qatar, Papua New Guinea and Wales. They plan to partner with Qatar Energy to build liquefaction facilities in Texas and Qatar.

From natural gas production to liquefaction, marketing and regassification, XOM is planning to play a role throughout the value chain. Like us, they expect strong long term demand growth. Asia has historically been the leading destination for LNG trade, but Russia’s invasion has created new demand from Europe.

XOM sponsors a cool interactive map that shows where all the world’s LNG infrastructure is located and provides information about ownership, volumes etc.

.avia-image-container.av-1z8pf2n-c57518adc22c4d3d99f6f7e0706943a8 img.avia_image{ box-shadow:none; } .avia-image-container.av-1z8pf2n-c57518adc22c4d3d99f6f7e0706943a8 .av-image-caption-overlay-center{ color:#ffffff; }

The US is largely an LNG exporter. The red stars on the US map are operating liquefaction terminals. Yellow and orange are at various stages of planning or construction. The US does import LNG, most famously in Boston (see two adjacent green stars) to compensate for the impediments they’ve imposed on natural gas pipelines (see Why Liberal States Pay Up For Energy).

.avia-image-container.av-1luxgcv-13c8cf482a12c9bb9bec134ec65ad566 img.avia_image{ box-shadow:none; } .avia-image-container.av-1luxgcv-13c8cf482a12c9bb9bec134ec65ad566 .av-image-caption-overlay-center{ color:#ffffff; }

The map of China and Japan shows an extensive network of regassification facilities (green stars). The red stars and other colors in this chart are, confusingly, import terminals under construction not LNG export terminals as on the US map. If you examine the maps very closely you’ll see that five-pointed stars denote LNG export and a Star of David denotes import, regassification. But the overall picture is that Japan can import LNG at many points along its coast. China has well over a dozen import terminals under construction. China is likely to displace Japan this year as the world’s biggest LNG importer.

.avia-image-container.av-16cl58v-6073ba3e8d8428a53db785d649b1851d img.avia_image{ box-shadow:none; } .avia-image-container.av-16cl58v-6073ba3e8d8428a53db785d649b1851d .av-image-caption-overlay-center{ color:#ffffff; }

The map of Europe shows that most of the LNG import terminals are in southern Europe. Germany wasn’t able to rely on these to replace Russian imports because Europe hasn’t invested in pipelines to move natural gas north. France has long opposed building a pipeline across the Pyrenees. European energy policy was never concerned with energy security and always assumed natural gas demand would drop. Germany quickly set about building regassification facilities on its north coast and has several more planned. European gas demand has been falling, but that’s partly because manufacturing businesses are transferring production to countries that can provide energy that’s reliable and cheap. Dutch fertilizer company OCI is investing $1BN in a Texas ammonia plant that will access cheap local natural gas, and then earn Inflation Reduction Act tax credits by sequestering the CO2 by-product underground (see Sending More Carbon Back Underground).

.avia-image-container.av-p2f633-841dac8e60264d71c6c998adf33fb4dc img.avia_image{ box-shadow:none; } .avia-image-container.av-p2f633-841dac8e60264d71c6c998adf33fb4dc .av-image-caption-overlay-center{ color:#ffffff; }

America’s per capita GDP has steadily pulled away from Germany’s and other advanced countries, most notably over the past decade or so (see Celebrating The 4th of July). We can all find much to criticize about our politicians, but at least government gets in the way less here than in other countries.

Cheniere exports around half of America’s LNG. They’re considering adding a new pipeline in Louisiana to add supply flexibility to their export terminal. Natural gas is a cleaner substitute for coal, and China’s growing LNG imports offer the hope that they will at some point reduce their industrial use of coal. Ship owners are also investing substantial sums to use LNG. In most cases this is replacing bunker fuel which is highly pollutive and is being phased out via global environmental regulations.

New windpower continues to face spiraling costs. The UK has made good use of the blustery North Sea, but Sweden’s Vattenfall recent halted work on a project intended to power 1.5 million UK homes because the cost has risen 40%. “What we see today, it simply doesn’t make sense to continue this project,” said Vattenfall chief executive Anna Borg.

Vattenfall took an impairment charge of $537MM. Evidently the UK government declined to adjust the terms of the contract to allow work to continue. By contrast, NJ governor Phil Murphy when faced with a similar problem recently redirected Federal tax credits worth up to $1BN to Danish firm Orsted so they can continue to build wind turbines along the NJ coastline (see Environmentalists Opposed To Windpower).

When contemplating the prospects of LNG versus windmills, we always take the former.

We have three funds that seek to profit from this environment:
Energy Mutual Fund

Energy ETF

Inflation Fund


Life Is Better After Greta

Life after Climate Change: Better than you think by Bjorn Lomberg was recently published in the National Review. Lomberg has published several books arguing that climate change isn’t the existential disaster often portrayed in the media. His most recent is False Alarm: How Climate Change Panic Costs Us Trillions, Hurts the Poor, and Fails to Fix the Planet. He offers a thoughtful counter to that wretched young woman Greta who lectured us from the UN in 2019 (“How dare you?”). Her star has been falling ever since, with occasional news coverage only when her protests lead to an arrest.

The National Review article and two other pieces were brought to my attention by a long-time client and friend as examples of unconventional thinking that deserve more widespread dissemination. Lomberg harnesses facts to present a future unlikely to be catastrophic. He notes that global hurricanes last year were the second weakest batch since 1980 when satellites began capturing data. The UN Climate Panel expects strong hurricanes to increase by 10-20%. Annually, they cause damage worth 0.04% of GDP, a figure expected to continue falling. A richer world will have more property to damage but will also be better able to afford resiliency to protect lives and assets.

Heat deaths have been rising, but globally 8X as many people die from cold, which makes blood vessels constrict to maintain warmth for internal organs, driving up blood pressure. It’ll sound flippant, but I spend much more money and effort avoiding cold weather, by spending most of the winter in Florida. I like 90 degrees. If we faced global cooling I would be far more agitated. The prospect of glaciers returning to New Jersey would be a deterioration in quality of life hard to pin on the state’s Democrats.

Lomberg goes on to note that the % of land burned in forest fires has been falling from around 4.2% in the early 1900s. And that improving living standards will reduce malnutrition. Higher energy prices and reduced access to fossil fuels will directly impede this process. For good measure he adds criticisms of solar and wind that will be familiar to regular readers (intermittency; low energy density; heavy reliance on steel and concrete). Lomberg doesn’t dispute that rising CO2 levels will cause warming, but he advocates assessing the costs and benefits of different policies, something rarely heard from climate extremists.

The UN advocates for energy policies that will constrain planetary warming to 1.5 degrees Celsius above 1850. Today we’re only 0.4 degrees away from that theoretical threshold at which disaster becomes unavoidable. Modelling the climate is complicated and precise forecasts aren’t credible. We should address the risk but human lives are at stake from impetuous liberal energy policies too.

Mark Levin’s American Marxism includes text from AOC’s Green New Deal to remind how far left policies on climate would lead to Federal control of vast parts of the economy via an army of new bureaucrats spending $TNs. The Green New Deal’s preamble asserted disproportionate harm to “indigenous communities, communities of color…women”. For more detail of its shortcomings, see The Green New Deal’s Denial of Science and The Bovine Green Dream.

Bjorn Lomberg cites a study showing that cheap US natural gas had allowed poorer households to be better heated, saving an estimated 11,000 lives each year.

A monthly newsletter by Stephen Leeb (The Complete Investor) was the third piece shared by my friend. Leeb makes the case for higher long term crude oil prices, arguing that global demand will inevitably keep rising because of emerging economies led by China, and that current prices imply unrealistic assumptions about future supply growth.

.avia-image-container.av-1bdirza-9f93f90b009414a2c174c22cf7c21d9c img.avia_image{ box-shadow:none; } .avia-image-container.av-1bdirza-9f93f90b009414a2c174c22cf7c21d9c .av-image-caption-overlay-center{ color:#ffffff; }

Research from Goldman Sachs shows that the increased costs of developing large new oil reserves has reduced capex and average reserve life while also driving up break-evens. The industry’s investment has been in a down cycle for almost a decade. US shale led to lower prices and convinced companies to curb spending. The ESG movement made big public companies sensitive about supplying what amounts to 80% of the world’s energy. The consequent increase in free cash flow has been good for shareholders. Hug a climate protester.

But Russia’s invasion of Ukraine made the EU consider energy security for the first time in living memory. Renewables have delivered hype but not yet made a meaningful dent in the global energy mix. Today even European companies like Shell are increasing their investments in reliable energy, following their American peers in the hope of recouping recent stock underperformance.

.avia-image-container.av-l1i9fq-c41690599c2336e1628cc2750a946cfa img.avia_image{ box-shadow:none; } .avia-image-container.av-l1i9fq-c41690599c2336e1628cc2750a946cfa .av-image-caption-overlay-center{ color:#ffffff; }

The views expressed in the writings shared by my friend have always represented pragmatic realism. As they become more mainstream we’ll all benefit from more balanced climate policies that consider cost-benefit tradeoffs. The tiresome Greta is becoming an anachronism, reflecting all that is bad about the extreme climate movement.

We have three funds that seek to profit from this environment:
Energy Mutual Fund

Energy ETF

Inflation Fund


Environmentalists Opposed To Windpower

Climate extremists have a well deserved reputation for a simplistic approach to solving the complex problem of curbing CO2 emissions without impoverishing us all. However, poorly informed objectives doesn’t mean they have a co-ordinated approach. The growth in solar and wind power is setting environmental extremists against one another. 

Take New Jersey, a state whose politics have lurched expensively left in recent years. Governor Phil Murphy and the Democrat legislature are pursuing an ambitious plan to develop offshore windpower. Danish firm Orsted plans enough wind turbines to power a million NJ homes. The project was expected to cost $1.6BN four years ago, but last week the company won approval from NJ to keep tax credits from the Inflation Reduction Act that were originally intended to benefit electricity customers.  

The bailout will surprise few. But NJ Democrats probably weren’t expecting to face growing opposition to hundreds of offshore wind turbines from environmentalists. Nonetheless, ProtectOurCoastNJ is showing rare intellectual deftness in opposing “the industrialization of the oceans” while also arguing in favor of efforts to reduce global greenhouse gases. They offer a coherent view that is uncommon among their peers.  

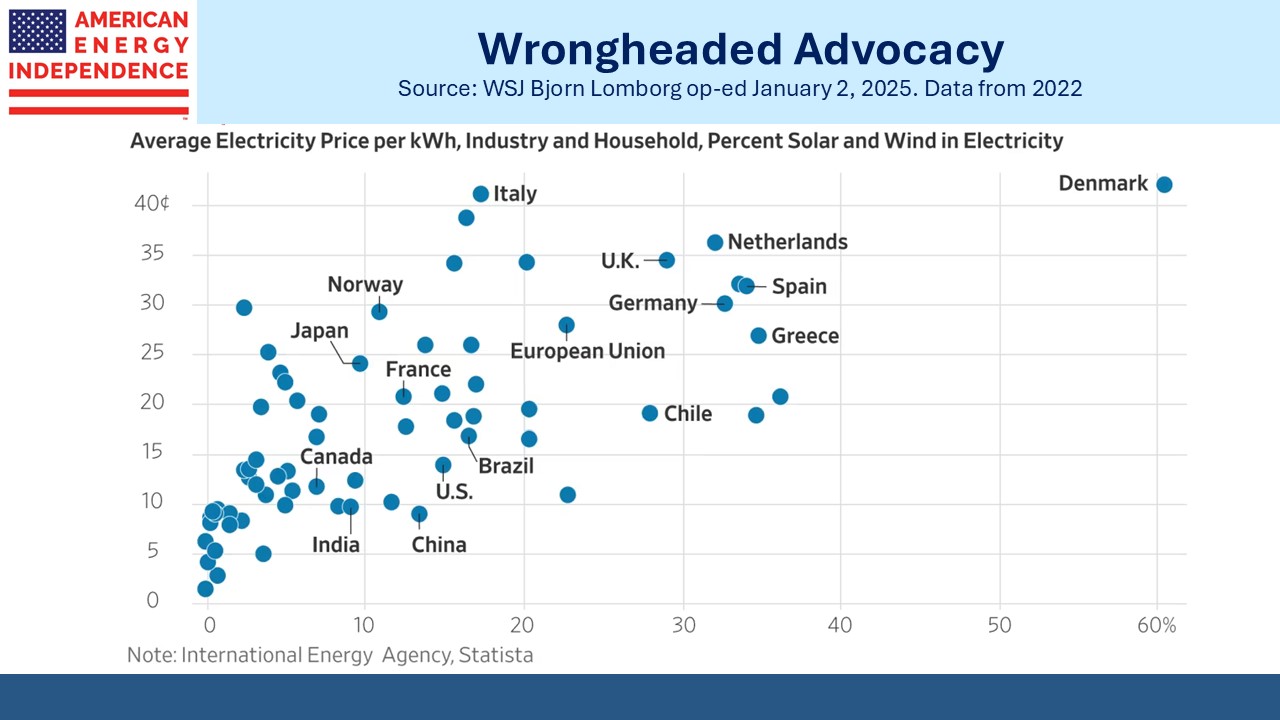
There are many arguments against windpower. It’s not renewable because the turbines have a useful life of around twenty years. They’re made of steel and concrete, whose manufacture relies on fossil fuels. The worn out blades typically end up in special landfills. Wind is intermittent, although offshore wind produces power more reliably than onshore. Increased penetration of weather-dependent electricity on a grid raises the need for reliable back-up, often from natural gas power plants. Therefore, renewables raise prices, a wholly understandable result that advocates should embrace as worth the cost. Instead, they claim the opposite, ignoring the examples of Germany which ranks among the world’s priciest electricity. And California, which vies for this title and goes one better with unreliability to boot.  

ProtectOurCoastNJ opposes offshore windpower because of the threat to wildlife, including whales. They cite the noise from construction, arguing that, “Vibrations from driving 36’ diameter steel piles 150’ into the sea floor will radiate for miles.” They argue that the nutrient-rich cold pool of water which sits near the surface will be disrupted by the turbine blades. The electro-magnetic field from the high-voltage cables will disorient fish. They worry about nautical navigation around the turbines, leaking oil and other hazardous chemicals, the increased cost of electricity and the view. The wind turbines will be clearly visible from the beaches of the Jersey shore. 

Britain relies heavily on offshore windpower. There are turbines in the English Channel. I’ve seen them when visiting friends who live on the southeast coast. They are visible, but I must confess that they look as far off as a passing cargo ship and are about as objectionable.  

.avia-image-container.av-rv7usc-223eeb3fcf8f9035bbd52844b6d66158 img.avia_image{ box-shadow:none; } .avia-image-container.av-rv7usc-223eeb3fcf8f9035bbd52844b6d66158 .av-image-caption-overlay-center{ color:#ffffff; }

However, the simulated photos of what the NJ offshore turbines will look like does portray them as more visible than the UK version.  

ProtectOurCoastNJ goes on to list many more sensible power sources to reduce emissions. These include switching from coal to natural gas, greater use of nuclear power and carbon capture. They sound as if they are subscribers to this blog.  

The point is that environmentalists are far from a homogenous group. There will always be a group opposing just about any construction. Unusually, ProtectOurCoastNJ has a pragmatic outlook and offers sensible alternatives for the windpower they oppose. Mountain Valley Pipeline isn’t the only energy infrastructure project to struggle with opposition from activists.  

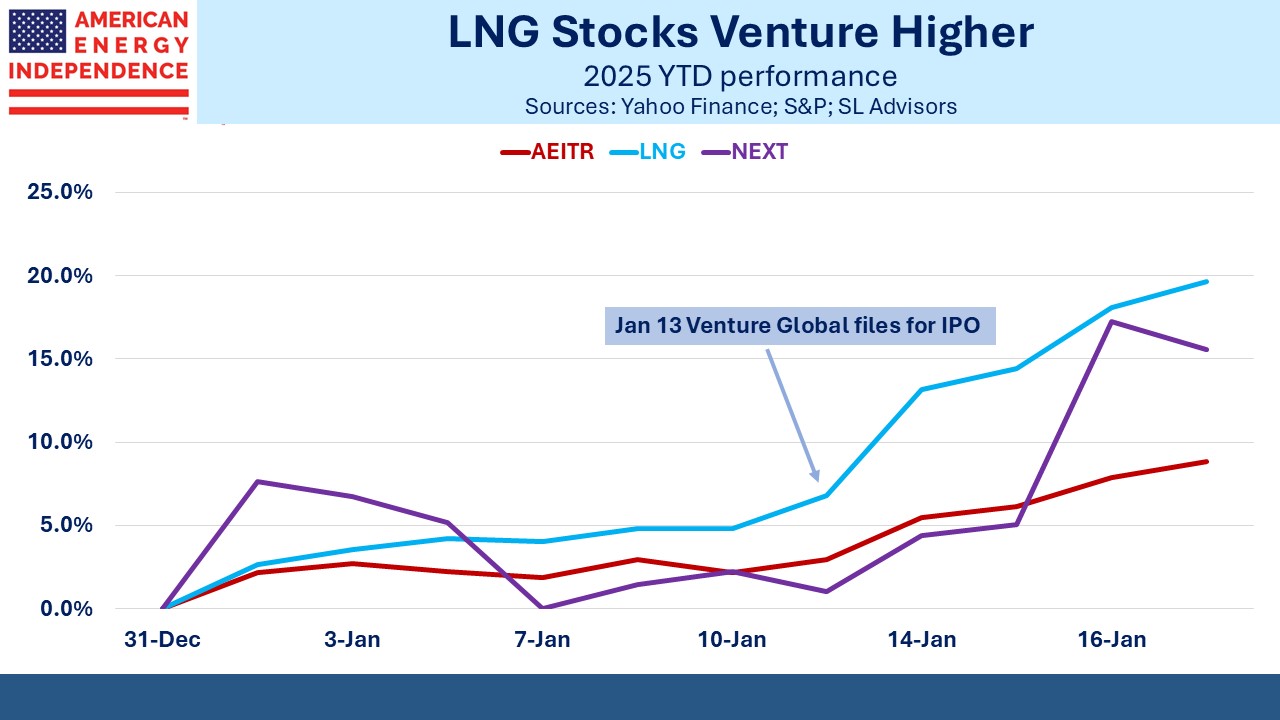
In other news, NextDecade (NEXT) announced their long-awaited Final Investment Decision (FID) to go ahead with their Rio Grande LNG export project, and the stock fell sharply. This was because NEXT’s share of the cashflows of Stage 1 turned out to be lower than their prior guidance – 20.8%, whereas investors were expecting around a third.  

This was disappointing, and the consequent sell-off in our opinion leaves the stock priced just for Stage 1 (Trains 1-3) with no added value for Stage 2 (Trains 4-5). NEXT is guiding for much better economics on Stage 2 assuming it ultimately goes ahead. Although Stage 2 isn’t reflected in the price, we think on a per share basis it could be worth 2-3X Stage 1. They also have Next Carbon Solutions which is focused on helping industrial companies capture and store CO2. Some people at NEXT think there’s as much value in this as the LNG business, although the stock price ascribes no value to it. 

NEXT is a multi-year story. We still like the stock.  

We have three funds that seek to profit from this environment:
Energy Mutual Fund

Energy ETF

Inflation Fund


Sending More Carbon Back Underground

Last year’s Inflation Reduction Act (IRA) raised the tax credit for CO2 that’s permanently buried underground. Some CO2 is used in Enhanced Oil Recovery (EOR) to help push crude out of mature, low pressure wells. It can then be pumped back into the well for permanent storage. This is Carbon Capture, Use and Sequestration (CCUS). The IRA tax credit for CCUS via EOR is $60 per metric tonne. There are still some sources of naturally occurring CO2 that are tapped for EOR, a counterintuitive process that IRA tax credits will likely cause to be phased out.

Burying CO2 without using it to produce fossil fuels is more in keeping with the spirit of climate change, and so Carbon Capture and Sequestration (CCS) draws larger credits than CCUS. The biggest credit goes to CCS that extracts CO2 out of the ambient air, called Direct Air Capture (DAC). CO2 exists at about 412 parts per million and is fairly evenly distributed. DAC is expensive, but the IRA’s $180 per tonne credit is enough to justify private sector investment. Extraction facilities can be placed wherever is convenient – such as above a geological formation that used to hold hydrocarbons.

.avia-image-container.av-1mmbe5s-067e07057f81ab73565bc50656cea69e img.avia_image{ box-shadow:none; } .avia-image-container.av-1mmbe5s-067e07057f81ab73565bc50656cea69e .av-image-caption-overlay-center{ color:#ffffff; }

There’s a beautiful symmetry here, in that carbon atoms are first extracted as hydrocarbon molecules. For example, natural gas (methane) is CH4. Their combustion causes the carbon atom to break from its hydrogen atoms and recombine with oxygen, forming the CO2 atoms whose increasing presence is a main driver of concern about global warming. Some of the best places to permanently store CO2 molecules are where CH4 molecules and other hydrocarbons were originally found deep underground.

The map is unfortunately a little grainy, but nonetheless makes clear that CCUS projects are either linked to old oil/gas wells by CO2 pipelines or sit directly above them.

.avia-image-container.av-zjvzlc-3e928dfd0932efac4fec9ea2e7c07e80 img.avia_image{ box-shadow:none; } .avia-image-container.av-zjvzlc-3e928dfd0932efac4fec9ea2e7c07e80 .av-image-caption-overlay-center{ color:#ffffff; }

Energy infrastructure investors should care about this for two reasons. One is that carbon capture offers a new revenue source, since the pipelines and other hardware required are owned and will be built by existing midstream businesses. Enlink is especially well positioned, since they have a significant presence in Louisiana moving natural gas to the state’s petrochemical industry. Providing transport for the CO2 byproduct back to the geological formations that sourced the hydrocarbons is a good fit.

The second reason is that increased use of carbon capture enhances the benefits of traditional, reliable energy versus solar and wind. In all of human history we’ve never transitioned to a form of energy that  is less reliable and takes up far more space than what we’re already using. Solar panels and windmills are a regressive step in many ways.

Cheap natural gas and IRA tax credits are a potent combination that is drawing industries to the US. OCI, a Dutch fertilizer company, is building a $1BN ammonia plant in Texas that will capture 95% of the emissions generated by its process. Ammonia is widely used to produce fertilizer, one of Vaclav Smil’s four pillars of civilization (along with steel, cement and plastic).

The “blue” ammonia OCI will produce costs $119 per metric tonne more than conventionally produced ammonia. But they estimate that the IRA tax credits will be worth $145 per tonne. It’s a perfect example of why European businesses are being drawn to America.

.avia-image-container.av-ng4txs-b0e04ef04986d7f9f022511ee37c5f24 img.avia_image{ box-shadow:none; } .avia-image-container.av-ng4txs-b0e04ef04986d7f9f022511ee37c5f24 .av-image-caption-overlay-center{ color:#ffffff; }

German politicians have drawn comfort from the drop in industrial energy use following Russia’s invasion of Ukraine. Some credited conservation measures by energy-intensive manufacturers, but the data shows that a drop in output is the real explanation. America’s energy policies unlocked cheap oil and gas. European companies such as OCI are investing here because of that. German energy policies led to enormous investment in windpower and neglected natural gas because they thought Russia would maintain supply until it was no longer needed. They have the world’s most expensive electricity as a result, with any reduction in CO2 emissions swamped by China’s consumption of half the world’s coal. German energy policies are a catastrophe.

Berkshire Hathaway continues to lean into the wind by increasing its traditional energy investments. Most recently Buffett invested $3.3BN for 50% of the Cove Point LNG plant, adding to the 25% already owned via Berkshire Hathaway Energy. He obviously sees a bright future for exports of US natural gas.

Lastly, the Mountain Valley Pipeline (MVP) saga took another turn with the US Court of Appeals for the Fourth Circuit’s decision to halt construction in response to a lawsuit filed by the Wilderness Society. The suit concerns a 3.5 mile construction corridor through the Jefferson National Forest. Even an act of Congress specifically approving MVP has been insufficient to break through the legal obstacles. Infrastructure permitting in the US is a mess.

We have three funds that seek to profit from this environment:
Energy Mutual Fund

Energy ETF

Inflation Fund


Still Uncovinced By Oneok Magellan Combo

It’s almost two months since Oneok (OKE) announced their proposed acquisition of Magellan Midstream Parners (MMP). Consummation of the transaction has never looked more promising than on the day of the press release.

By mid-May, the market was ascribing less than 30% odds of shareholder approval, based on the gap between MMP and the combination of OKE stock and cash that is on offer. Energy Income Partners (EIP), a significant holder of MMP, issued a public letter outlining the reasons for their opposition. We had made similar arguments in prior blog posts (see Oneok Does A Deal Nobody Needs).

EIP’s letter so far marks the nadir of the market’s support for the deal. Neither company responded publicly to EIP’s criticisms although both have been active behind the scenes. At a couple of recent industry events they were making the case to interested investors, and the market-implied probability of the deal closing improved.

.avia-image-container.av-1ft2y2m-7fb8ec8f767933771198893f3874b0f3 img.avia_image{ box-shadow:none; } .avia-image-container.av-1ft2y2m-7fb8ec8f767933771198893f3874b0f3 .av-image-caption-overlay-center{ color:#ffffff; }

The tax bill facing MMP unitholders is the most offensive element of the transaction. The longer you’ve held MMP, the lower your cost basis and the greater your recapture of taxes deferred on distributions. MMP business model is designed to encourage investors who plan to stick around. In their May 4 press release disclosing 1Q earnings, MMP said they remain committed to, “…maximizing long-term investor value.”

Except this isn’t true.

The merger with OKE rewards the short-term investor whose recent purchase doesn’t create a tax obligation. This includes the MMP management team who are embarrassingly paltry investors in their own company. By MMP’s own calculations, the investors who have held their units the longest are facing the biggest tax bill. Like John Kerry (“I did vote for (it) before I voted against it”) MMP wants investors with a long-term outlook until they don’t. Their pursuit of a combination with OKE prioritizes value creation for short term investors because they’re the ones without the inconvenient tax deferral.

.avia-image-container.av-18cbvlq-f2a2d65b0b4ed97ec408db15005fa006 img.avia_image{ box-shadow:none; } .avia-image-container.av-18cbvlq-f2a2d65b0b4ed97ec408db15005fa006 .av-image-caption-overlay-center{ color:#ffffff; }

Sell-side analysts are not unbiased, objective observers. There’s not much in underwriting fees to be gained from upsetting potential capital markets clients. Therefore, the lukewarm comments from several firms can be interpreted as a negative view ameliorated by their business models. It’s a form of code. The deal odds slipped below 50% a month ago and still haven’t broken above in spite of the management charm offensive. The market’s unenthusiastic response means that if the deal does get approved there will be many former MMP investors ready to dump their newly received OKE stock, since they’ll have no taxable gains. OKE/MMP remains, just, more likely than not to be voted down. We’re happy to be raising awareness.

.avia-image-container.av-jbagou-3d3d01d0eb89227e0b94acec887e65d4 img.avia_image{ box-shadow:none; } .avia-image-container.av-jbagou-3d3d01d0eb89227e0b94acec887e65d4 .av-image-caption-overlay-center{ color:#ffffff; }

In other news, the US Energy Information Administration (EIA) reported that global trade in Liquefied Natural Gas (LNG) reached a new record last year of 51.7 Billion Cubic Feet per Day (BCF/D). Recent increases have been driven by liquefaction capacity additions in the US. Europe’s loss of Russian pipeline imports has also helped, since these have been partly replaced by imported LNG.

NextDecade (NEXT) is a company we’ve followed for some time. They recently confirmed they have bank financing in place to begin construction of their Rio Grande LNG export facility. Bechtel, who has the contract, just awarded an order to Baker Hughes to supply three main refrigerant compressors as part of the project. NextDecade hasn’t yet announced a Formal Investment Decision (FID) to proceed but have indicated this is imminent. We continue to think NEXT is attractively priced at current levels. Announcement of FID should be reflected in the current price although may still provide a modest boost. In any event we think the stock offers good upside potential.

Finally, within the details of Friday’s employment report was the news that black workers have accounted for 90% of the recent rise in unemployment. Monetary policy is hardly the tool with which to combat such a development. Past history shows that minority unemployment rises faster during a slowdown. However, Fed chair Jay Powell has in the past stated a desire for maximum employment that is “broad-based and inclusive” (see Criticism Of The Fed Goes Mainstream). Democrat lawmakers have another reason to criticize the conduct of monetary policy.

Market expectations have shifted in recent weeks towards the blue dots from the FOMC’s Projections. Just two months ago Fed funds futures were priced for a policy rate of 2.75% by the end of next year. Since then, hawkish comments from the FOMC and moderately firmer data have led traders to revise this to 4.25%. Usually the market is better than the Fed at forecasting monetary policy. This time around, they’ve caught some traders flat footed.

We have three funds that seek to profit from this environment:
Energy Mutual Fund

Energy ETF

Inflation Fund


Celebrating The 4th of July

Independence Day is a wonderful holiday. It involves being outside in warm weather with the family to eat and watch fireworks. What’s not to like? Perhaps more than at any other time of the year, Americans rightly feel pride at our great country. As a transplanted Brit for now 41 years, my riposte to the inevitable jokes about a long-ago war is to point out that if it had gone the other way I wouldn’t have moved. 

Ronald Reagan was my first president, and his sunny optimism has seemed right ever since. I have a small bust of him on my desk. He would chuckle to know that it was picked up at the Truman Little White House in Key West gift shop, a Republican memento bought at a museum honoring a Democrat president.  

At the 1992 Republican National Convention, former President Reagan said “America’s best days are yet to come.” Two years later in his poignant letter disclosing Alzheimer’s he ended with the same sentiment. Warren Buffett shares Reagan’s consistently positive outlook, but negativity is all too easily found in the media. As we argued recently, it doesn’t fit the facts (see So Many Pessimists).  

.avia-image-container.av-s4kcxo-4433b25020a7366a7dac0d8b018372f2 img.avia_image{ box-shadow:none; } .avia-image-container.av-s4kcxo-4433b25020a7366a7dac0d8b018372f2 .av-image-caption-overlay-center{ color:#ffffff; }

In April, The Economist declared that America’s economic outperformance is a marvel to behold. There’s no bad time for this view but rereading it while contemplating an afternoon of bbq then pyrotechnics will make a thoroughly agreeable day even better.  

The charts date back to Reagan’s time in office and his 1992 speech. There were plenty of reasons then to dismiss such simplistic optimism. In 1989 Paul Kennedy published The Rise and Fall of the Great Powers: Economic Change and Military Conflict from 1500 to 2000. It remains an insightful history of how economic might usually drives military power (the EU is a notable exception). Eventually empires sink under the weight of maintaining global hegemony. But Kennedy’s prediction that Japan would eventually supplant America at the top of the economic pyramid was spectacularly wrong.  

.avia-image-container.av-1gx9pdo-e7ad0a14031ec35f5bbc3773cca94a5a img.avia_image{ box-shadow:none; } .avia-image-container.av-1gx9pdo-e7ad0a14031ec35f5bbc3773cca94a5a .av-image-caption-overlay-center{ color:#ffffff; }

China is our strategic competitor. But their economy is still only three quarters the size of ours with four times the population. And ominously, that is now declining. I like our chances better than theirs. And as far as where I’d rather live – well, let’s just say it’ll be a cold day in hell before China is fending off hordes of western immigrants seeking a Chinese lifestyle.  

.avia-image-container.av-4vl6po-4c586a7e499f32778d5c1de5232c907b img.avia_image{ box-shadow:none; } .avia-image-container.av-4vl6po-4c586a7e499f32778d5c1de5232c907b .av-image-caption-overlay-center{ color:#ffffff; }

In 1982 when I moved to the US, I left the UK’s GDP per capita of $10K for America’s $14K. Today’s figures are $46K and $80K. Decades of lower productivity capped with the self-destructive if understandable Brexit vote have taken their toll. British living standards have slipped behind Germany’s. Relative to the US, UK households are as far behind today as Italy was in 1980. Few would have made that bet. Vindication of a decision to emigrate 41 years ago relies on more idiosyncratic metrics. But, as in trading, it’s important to go with the major trend.  

The data also reflects American exceptionalism because nobody else has been able to keep up. Our problems include fiscal profligacy, a poorly functioning electoral process heading for a rematch of two polarizing old men that nobody wants, and wokeness out of control. We’re managing to overcome all those headwinds. Whatever problems we have are self-inflicted, and not insurmountable.  

.avia-image-container.av-1ua01o-543377a31fbd47b0446eb99b9eafb520 img.avia_image{ box-shadow:none; } .avia-image-container.av-1ua01o-543377a31fbd47b0446eb99b9eafb520 .av-image-caption-overlay-center{ color:#ffffff; }

We love our flags in America. In England the Cross of St George has replaced the British Union Jack at sporting events. The united kingdom is less so nowadays. Brexit exposed that the Scots would prefer to be run out of Brussels than London. They even root for England’s opponent in the World Cup. If a vote on Scottish independence was held in England they’d be sent packing. 

The British flag was on full display during Charles III’s coronation, and his mother’s funeral last year. It’s flown on special occasions. But normal British reserve constrains such overt patriotism.  

America is different. The waterway behind our shore house in Point Pleasant, NJ shows a flag at every home. These don’t just fly on Independence Day, but on every day. Ours is on the left. Proud of my English heritage, I originally added the Cross of St George appropriately positioned below our Stars and Stripes. Regrettably it was made from cheaper material that a few months of coastal breeze turned ragged. It had to be retired. Our American flag is indefatigable. Like America.  

Happy Birthday America.  

We have three funds that seek to profit from this environment:
Energy Mutual Fund

Energy ETF

Inflation Fund


America’s Favorite Energy

When it comes to energy, the media has a decided liberal bias. With a few exceptions, journalists covering this sector breathlessly highlight the phenomenal growth of renewables and criticize those evil fossil fuel companies who supply 82% of the world’s primary energy. The solar/wind juggernaut is barreling along and if you don’t jump on you’ll be on the wrong side of history.

Bloomberg’s Naureen Malik, who’s not an obvious proselytizer for intermittent energy, recently noted that natural gas power plants represent a disproportionate share of outages during bad weather. Natural gas is America’s favorite fuel, providing 40% of US electricity generation last year and projected to rise to 41% this year. That’s three times the share of solar and wind.

.avia-image-container.av-2f7f58s-a5c8dac4fbda8b3132b3648c52aec918 img.avia_image{ box-shadow:none; } .avia-image-container.av-2f7f58s-a5c8dac4fbda8b3132b3648c52aec918 .av-image-caption-overlay-center{ color:#ffffff; }

If natural gas power plants sometimes fail during extreme weather, it reflects choices made about investing in hardening them. In some cases, spending on solar and wind has taken priority. It doesn’t reflect any inherent flaw in natural gas, which is why it’s America’s favorite fuel.

Last winter natural gas provided a record amount of power. What’s disproportionate is the media coverage of renewables relative to their impact. Solar panels aren’t just vulnerable to cloudy days, but also to hailstorms, as the photo from Nebraska shows.

.avia-image-container.av-mh8tu4-f4d71e452d8570e25c2c0392f26b1bee img.avia_image{ box-shadow:none; } .avia-image-container.av-mh8tu4-f4d71e452d8570e25c2c0392f26b1bee .av-image-caption-overlay-center{ color:#ffffff; }

The chart showing share of electricity generation by source hardly suggests that utilities are drawn to the resilience of solar and wind. Bloomberg’s Malik might have presented a more balanced perspective by including such charts.

.avia-image-container.av-1s2wq24-57540d2ca45342d8f147cebc4ed9502b img.avia_image{ box-shadow:none; } .avia-image-container.av-1s2wq24-57540d2ca45342d8f147cebc4ed9502b .av-image-caption-overlay-center{ color:#ffffff; }

The EIA provides substantial data on current energy consumption as well as projected use. Their Annual Energy Outlook includes several scenarios as well as their Reference (or Base) Case. The most bullish natural gas scenario they model is the High Oil and Gas Resource and Technology Case. It’s labeled the Upside Case in the chart.

.avia-image-container.av-14s590s-abd8fb84631c29c5bb05100f7e2de3d7 img.avia_image{ box-shadow:none; } .avia-image-container.av-14s590s-abd8fb84631c29c5bb05100f7e2de3d7 .av-image-caption-overlay-center{ color:#ffffff; }

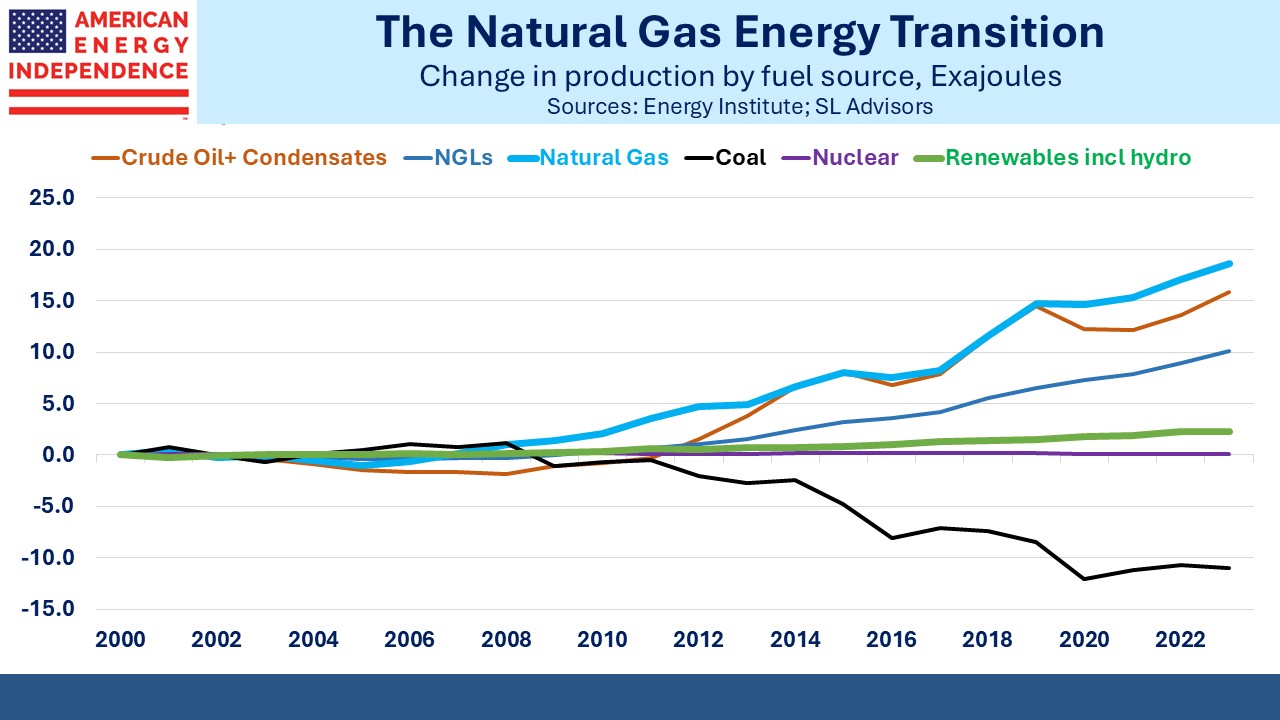
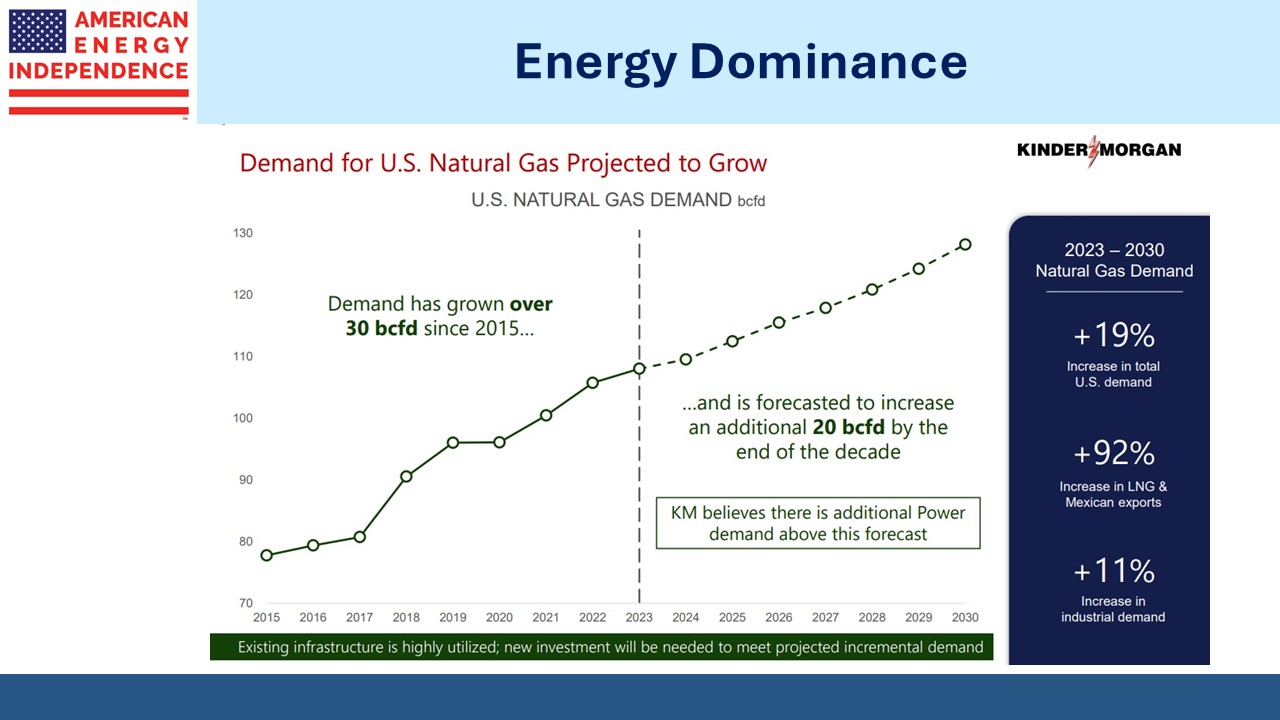
The steady growth in US natural gas consumption over the past five years hasn’t drawn much coverage, but since 2017 its use in power generation has grown at a 6% Compound Annual Growth Rate (CAGR), around the same as renewables. Because natural gas is our biggest source of electricity generation, the 418 billion kWh five year increase is almost double that from renewables (222 billion kWh). Coal use has declined at an 8% CAGR. This story doesn’t get told because it doesn’t align with the left-wing bias of most journalists. Too many energy news stories are little more than an op-ed.

The big story in US energy is the increasing use of natural gas, expanding at the most optimistic rate envisaged by the EIA five years ago. It’s also been our biggest source of reduced CO2 emissions, because coal use has simultaneously declined. The shale revolution generated mixed investment results, but it brought cheap energy that has boosted business here, can be exported to our friends and allies and provides energy security.

For several years the dark shadow of the energy transition dissuaded investors from committing capital to reliable energy. There’s a welcome turn in sentiment. Shell is trying to look more like US energy companies who resisted woke protesters to focus on maximizing returns. Blackrock’s Larry Fink has vowed not to use the term “ESG” since it’s become so maligned. Sweden recently adopted energy policies that dropped “only renewables” in favor of “clean”. This sensible shift allows for the inclusion of nuclear, and fuels like natural gas if the emissions are captured.

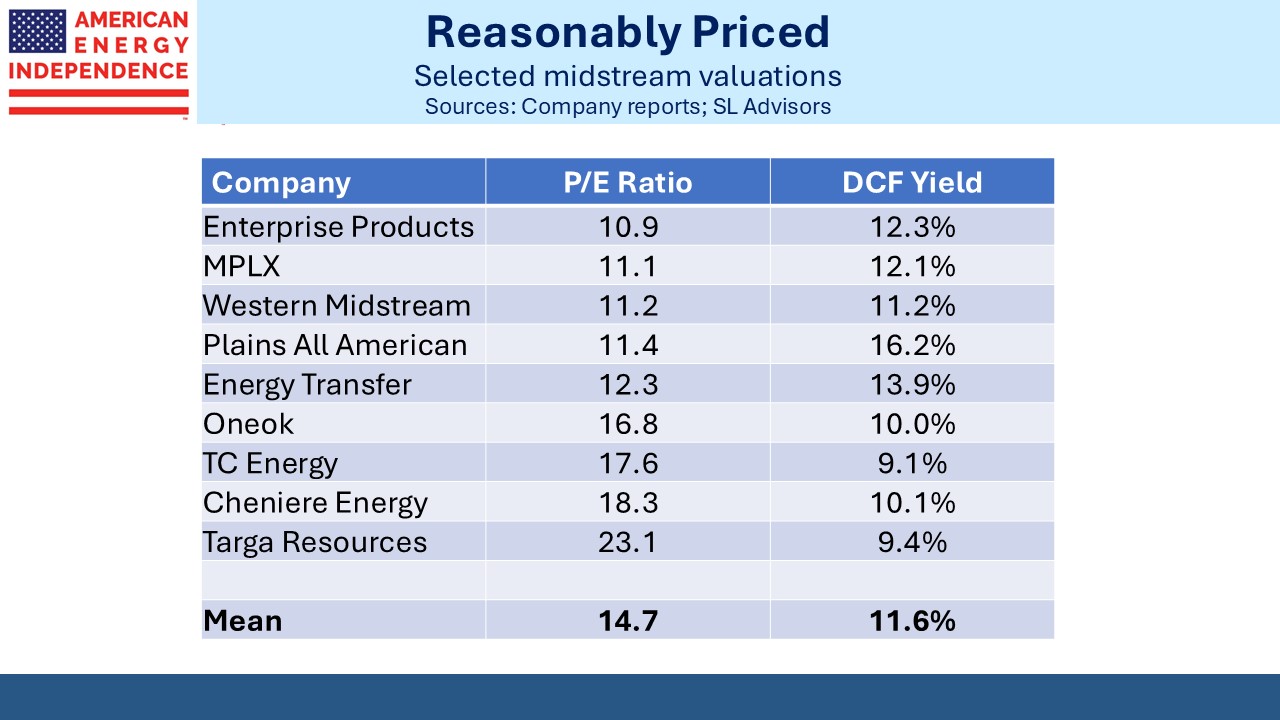
Midstream energy infrastructure has lagged the market this year, because it’s not a sector synonymous with AI. But relative performance in June was good with the American Energy Independence Index making up for some lost ground. The narrative around renewables and the energy transition is more subtle than the headlines, a realization that is spreading.

If you follow the energy sector you have to pick your journalists and outlets carefully.

.avia-image-container.av-ooq73g-9e84e517a13dcda9d4ecbf8fe42e50d4 img.avia_image{ box-shadow:none; } .avia-image-container.av-ooq73g-9e84e517a13dcda9d4ecbf8fe42e50d4 .av-image-caption-overlay-center{ color:#ffffff; }

The futures market continues to chart a rate path less hawkish than the FOMC’s blue dots. But the gap is narrowing, in an unusual case of the market correcting towards the Fed. The carnage inflicted on bank securities’ portfolios was shown in Bank of America’s disclosure that they have $100BN in unrealized losses on their securities holdings. They’ve benefited as recipients of deposits fleeing smaller regional banks, but it is depressing their net interest margin because they’re stuck with a lot of low-yielding bonds acquired by competing with the Fed during QE. It shouldn’t have been hard to limit bond exposure. Central banks rendered the entire investment grade sector useless to the return-oriented investor. Yields are still too low. Bank of America flubbed risk management. JPMorgan did much better.

We have three funds that seek to profit from this environment:
Energy Mutual Fund

Energy ETF

Inflation Fund