Pipeline Investors Welcome Less Spending

Most energy investors wish the Shale Revolution had never happened. Energy independence was realized through sharply higher oil and gas output. But the promise of similarly bountiful investment returns was not. U.S. E&P executives have overspent and overproduced. Unfortunately, the midstream infrastructure sector too often followed along. Drilling and building infrastructure is in the DNA of many industry executives.

Spending on growth projects is how companies with capital discipline increase their profits. Because so many energy companies, both upstream and midstream, have been poor at capital allocation, investors now regard growth projects with suspicion. When it comes to growth capex, less is more.

In the years preceding the Shale Revolution, midstream companies (then predominantly MLPs), weren’t investing heavily in new projects. There wasn’t the need. America was obtaining its oil and gas from roughly the same places in the same amounts year after year. Pipelines were about running a toll-model: charging fees for use of infrastructure, raising prices annually, spending on maintenance capex and finding productivity improvements to boost profits.

That’s the pipeline business that attracted older, wealthy, K-1 tolerant income seeking investors. They’ve mostly left, because the industry abandoned the stable distributions they’d s ought in favor of growth. The MLP model has lost favor to the traditional corporation, with its ability to access a far wider set of investors.

The 2014-16 energy downturn, which now seems like a fond memory compared with this year’s rout, saw a fall in growth capex as pipeline companies responded to the collapse in crude prices. But it wasn’t long before spending on new projects recovered along with energy prices, and the industry returned to its new ways. By 2018 the industry was spending more than at the sector’s peak in 2014. Investors were increasingly boycotting energy names as a protest at continued new projects.

By 2019, pipeline execs who had long complained that the market undervalued their stocks, were at last taking some value-enhancing actions while still lamenting the absence of investor affection. Growth capex was coming down, and the downward path was already expected to continue this year before Coronavirus scrambled everyone’s plans.

.avia-image-container.av-tr0zx0-804807cb1f1c16181481d11ac054880e img.avia_image{ box-shadow:none; } .avia-image-container.av-tr0zx0-804807cb1f1c16181481d11ac054880e .av-image-caption-overlay-center{ color:#ffffff; }

Since March, when U.S. economic activity halted in response to the pandemic, the energy business has rapidly altered its plans. Shale production is now expected to exit 2021 at 2.5 Million Barrels per Day (MMB/D) lower than pre-Coronavirus forecasts. Given the sharp decline rates common with shale, caused by the high initial pressure at which its hydrocarbons are released, new wells are constantly required to maintain production. Goldman Sachs estimates that last year 70% of new well capacity was offset by base declines, with only 30% feeding growth in output. As drilling activity plummets, depletion will quickly lower U.S. production.

Future energy demand from the transportation sector is highly uncertain. Working remotely, with the daily commute now a memory, has been welcomed by many – with the possible exception of families with small children at home. Many companies are rethinking their use of expensive downtown office space. Cramming all your workers together also exposes a business to a sudden loss of an entire department to illness if an infection spreads. Dispersing your workers may become smart risk management. Client visits and business travel of all kinds may reset permanently lower. Mass transit use remains very low as other forms of travel show signs of recovery. If the perception of crowded subway trains as carrying high risk of infection persists, gasoline use may surge as commuters resort to driving. The energy requirements of moving people are changing.

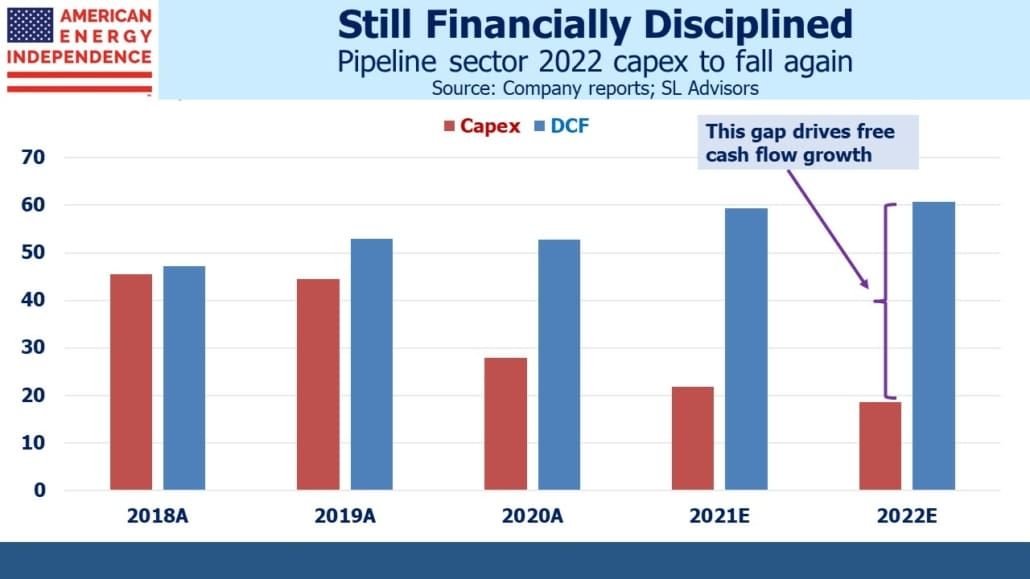
The top five midstream companies have all responded to all this by reducing 2020-22 spending by almost $3BN a year. If This 16% reduction applies across the industry, growth spending will be close to the $32BN low of 2016. By next year it’ll be $5BN below that.

Some companies have been disciplined about requiring investments to generate a risk-adjusted return above their cost of capital. The Canadians are prominent in this group. But many have not, which is why falling growth capex is likely to be welcomed by investors. As midstream companies are faced with fewer uses for the cash they generate, investor-friendly uses such as dividend hikes and debt reduction will benefit.

It’s probably no coincidence that the recovery in pipeline stocks has coincided with more modest growth spending. By lowering the need for spending on new projects, the pandemic just might provide investors with long overdue strong returns.


Having a Better Pandemic in Charleston, SC

On Thursday my wife and I boarded a plane from Newark, NJ to Charlotte, NC. Although Governor Murphy is slowly relaxing the lockdown restrictions that have been imposed on New Jerseyans, it is an incremental process. Each minor restoration of a freedom lost is quietly celebrated. Restaurants will soon be allowed to open for outdoor dining. Hair salons will reopen with limited capacity,  but no news yet on dentists. The sequence is slow and opaque.

We’re in the minority, believing living in a free country includes selecting your risks. Frequent hand washing, masks in public places and social distancing are completely reasonable and courteous. Those at high risk of serious illness are generally in well-defined groups. If you’re worried, stay home. Destroying so many small business owners’ life’s work deserves more consideration than it’s getting.

We await each new missive from the governor without much idea of their framework or schedule. Little is said of the destruction to New Jersey’s already precarious fiscal outlook, but we know eventually the Coronavirus bill will come due. Expect much complaining as ruinously high property and income tax rates are tweaked even higher.

NJ has suffered around 12,000 deaths, 80% of whom were over 65. It doesn’t need saying but I shall anyway, that each death is tragic and my heart goes out to every family. Related but not comparable is that 1.2 million NJ residents have filed for unemployment.

The fatalities didn’t cause the job losses. We shut the economy down to prevent more deaths. Suppose without lockdown, it would have been twice as bad. The lockdown meant 12,000 people survived who otherwise wouldn’t have. Let’s suppose this lucky group is also 80% over 65.

In this scenario, the ratio of jobs lost to coronavirus fatalities avoided is 100:1. Versus working age fatalities it’s 500:1. These ratios have no optimal value, and some may find the concept crass. But they do seem high.

Since we long ago flattened the curve and a vaccine is a 2021 event at best, life needs to rapidly adapt to whatever new normal is.

Newark airport was eerily quiet. Everyone is required to wear a mask. The TSA estimates passenger volumes at 15% of normal, which looked about right. There was virtually no line at security, even for the non Pre-check crowd. Most airport stores were closed. Restaurants had plastic wrapped their seating to further dissuade visitors, even though no meals are on offer. It was rather sad.

On hearing we’d be flying, most friends commented on the risk of infection. Modern aircraft have HEPA air filters which are apparently fine enough to catch the virus. Fear is constraining all kinds of travel, but most have nowhere to go. Pandemic restrictions in some form are everywhere.

But the choice to endure lockdown in New Jersey from early March would have few takers. For several weeks even walking in a forest or park was forbidden. We vowed then to visit somewhere else, almost anywhere, once my wife’s obligations as an online pre-school teacher were complete. North Carolina, a rental car and a plan to drive south to Charleston, SC and then beyond, beckoned.

When we exited the plane at Charlotte, two passengers walked 40 feet and sat down at the first bar they’d seen in three months.

Coronavirus has constrained life in South Carolina too. Museums are closed, but restaurants are open for indoor seating with socially distanced tables. As we were walking through historic Charleston, we excitedly pointed through a window at four people sitting at a restaurant table indoors. The diners looked back, regarding us with some amusement.

South Carolina has less than a fifth as many cases as NJ, and 8% of the fatalities, adjusted for population. Of course, NJ has fared worse than anywhere except neighboring epicenter New York City. So just traveling away from NJ was likely to be an improvement.

Visitors to Charleston are way down. Our original hotel reservation was canceled because the owners suddenly decided to carry out renovations.

.avia-image-container.av-j4bka4-2aea49c4939bebd9aeda1182a46fd557 img.avia_image{ box-shadow:none; } .avia-image-container.av-j4bka4-2aea49c4939bebd9aeda1182a46fd557 .av-image-caption-overlay-center{ color:#ffffff; }

Nonetheless, life in Charleston is more agreeable and probably our new normal. We ate our first meal out in three months. Tables were generously distanced and the waiter wore a mask. Turns out he and his girlfriend fled Queens, NY two months ago. We understand.


Is Being Bullish Socially Acceptable?

There’s rarely a shortage of bearish articles. The recent batch incorporates a tone of pleading, or at least reasoning, with investors to acknowledge our circumstances when choosing investments. One of my favorites is a New Yorker essay from mid-May, which asked Have The Record Number Of Investors In The Stock Market Lost Their Minds? The writer meets a retiree over socially distanced golf who is spending his free time trading stocks. No wonder the market’s been rising.

The underlying theme of all these articles is that, since we can all see the economic destruction ourselves, through shuttered businesses and a record leap in unemployment, how can the stock market be so stupid. Some concede that markets only react to surprises, not what’s expected. But being bearish nowadays seems the only socially acceptable view. It’s rather like wearing a mask if you’re near other people – being considerate towards all the victims of the pandemic and their families requires masking up and dumping your investments.

.avia-image-container.av-jk7u4b-373a5a7ac07fca36bf0ecacbe81b35c7 img.avia_image{ box-shadow:none; } .avia-image-container.av-jk7u4b-373a5a7ac07fca36bf0ecacbe81b35c7 .av-image-caption-overlay-center{ color:#ffffff; }

Journalists are expected to explain events as well as report them. So in early May, following six weeks of an inconsiderate market rally and an increase of U.S. deaths from below 1,000 to over 80,000, the New York Times published Repeat After Me: The Markets Are Not The Economy. This followed on April’s failure to inspire reasoned judgment, led by articles such as Everything Is Awful. So Why Is the Stock Market Booming?

The Wall Street Journal feels little compunction to put their humanity on display, so their offerings are less judgmental and more businesslike, such as The Stock Market Is Ignoring The Economy.

Forbes followed their practice of presenting all possible views, which ensures at least some will be right. In early March, The Stock Market Is Still Overvalued, Here’s Why preceded the actual low by a couple of weeks, but was still published some 300 S&P500 points below where we are now. This was only helpful for the most agile investor. But a couple of months later Forbes offered more optimism, with, 5 Explanations For The Disconnect Between The Stock Market And The Economy. By coincidence, the S&P500 was roughly back to where it had been two months earlier, so these two articles book-end the V-shaped drop and recovery. In case this sounds overly critical of Forbes, I should note that your blogger occasionally writes for them as well, a fact some may feel says much about their standards.

But my favorite article is from the New York Times magazine: What Is the Stock Market Even for Anymore? What stronger indictment can be leveled at investors if they stubbornly refuse to sell everything, than to find them irrelevant? The writer starts out by correctly predicting the market’s fall, but then his prescience drives increasingly confident, more dire predictions that are badly wrong. It leads him to search for experts that are more bullish.

A crash surely won’t help our situation, but at least will affirm its gravity. A resurgent market supports the view that this too shall pass, that the world over-reacted. If the virus was that bad, surely stocks would be lower.

So the market grinds higher, confounding a great many. Prices still look attractive to us (see Stocks Look Past The Recession and Growing Debt). But pipelines look like a screaming buy, with yields well over 9% and the momentum of leading the rally since March, with the American Energy Independence Index having almost doubled. What seems certain to us is that, if the S&P500 continues to climb its wall of worry, it will still be outpaced by midstream energy infrastructure, with its recently reaffirmed and excessively high dividend yields.

We publish the American Energy Independence Index and are invested in the ETF that tracks it.


Why Are MLP Payouts So Confusing?

It’s surprisingly difficult to figure out what dividends are doing for midstream energy infrastructure. Just about every company has a free pass on cutting its payout nowadays. Prudent cash management isn’t going to draw much criticism with the size of the economic shock we’re enduring. Given the beating energy stocks suffered during 1Q20, a few dividend cuts would have been forgiven.

In spite of this, the biggest midstream energy infrastructure companies have maintained their payouts. In 1Q earnings calls, the overall message was that while it was hard to make confident long term forecasts, management teams felt comfortable with the resiliency of their businesses. The result is that the top ten midstream energy infrastructure companies by market cap have raised their payouts by an average of 4.7% over the past year.

.avia-image-container.av-v203i0-f2a5e513a0f6d756383008a0dc5d547d img.avia_image{ box-shadow:none; } .avia-image-container.av-v203i0-f2a5e513a0f6d756383008a0dc5d547d .av-image-caption-overlay-center{ color:#ffffff; }

None of them reduced dividends at their most recent announcement dates. Cheniere Energy, Inc. (LNG) doesn’t pay a dividend. Kinder Morgan (KMI) raised theirs by 5% compared to the prior quarter.

As we noted recently, free cash flow growth remains a positive story for these companies (see Pipeline Cash Flows Will Still Double This Year).

Alerian has echoed the positive news about distributions. They noted that, “The majority of midstream constituents grew or maintained dividends over 1Q19.” This was supported by a chart showing 68.5% of Alerian MLP Infrastructure Index (AMZI) components by market cap did just that. It sounds like a great story.

Unfortunately, characterizing distributions in this way presents a misleading picture. A majority maintaining or growing suggests that aggregate payouts for the group are similarly stable. They are not.

.avia-image-container.av-4ox02g-6cb40be0ea79a6e086f79447191d7a3f img.avia_image{ box-shadow:none; } .avia-image-container.av-4ox02g-6cb40be0ea79a6e086f79447191d7a3f .av-image-caption-overlay-center{ color:#ffffff; }

Distribution cuts at MLPs have been far more prevalent than at corporations – because the AMZI index consists of MLPs, it is more exposed to crude oil pipelines and to gathering and processing than the American Energy Independence Index (AEITR), which reflects the North American midstream sector as a whole. AMZI doesn’t reflect the industry. MLPs also tend to have lower credit ratings. As a consequence, MLP distributions are turning out to be less resilient than those paid by pipeline corporations.

Most companies tend to raise distributions/dividends gradually, by a few percent at time. By contrast, cuts are often 50-100%. So even though the majority of AMZI by market cap maintained or raised their distributions, the payout on the Alerian MLP ETF, AMLP, has just been cut again.

.avia-image-container.av-odajmg-3f85b021ad120ea19e52cc7faca0925b img.avia_image{ box-shadow:none; } .avia-image-container.av-odajmg-3f85b021ad120ea19e52cc7faca0925b .av-image-caption-overlay-center{ color:#ffffff; }

The AMZI is down to only 20 constituent companies now, and because 11 of them slashed their distributions, this was enough to force AMLP to cut its payout. This contrasts with the story for AMLP’s index, AMZI, which is being spun to sound superficially good.

It turns out that size matters. The three biggest MLPs, which are in the top ten midstream companies by market cap, all maintained or grew their payouts. The biggest companies in this sector tend to be more stable and have higher credit ratings.

AMLP investors care more about another cut than the spin being put on its index.

SL Advisors publishes the American Energy Independence Index

We are invested in KMI and LNG


Energy Investors See Us Moving Again

The energy sector has been leading the market’s rebound from the lows of March. Demand for crude oil plummeted, and the Saudi decision to simultaneously increase supply caused prices to briefly go negative. No investment sector in energy was safe, including midstream infrastructure.

U.S. oil production has already dropped by 1.6 Million Barrels per Day (MMB/D), from 13.1 MMB/D in mid-March to 11.5 MMB/D now. First quarter earnings calls updated investors on the collapse in demand. Magellan Midstream reported gasoline demand was down 24% in April (see More Solid Pipeline Results). Jet fuel was down by 75%.

However, there’s more to the U.S. energy business than crude oil. Natural gas demand has remained solid, helped by continued substitution away from coal. And propane exports have risen – as India’s refineries are producing less gasoline, they’ve also cut propane production which is often part of the same process. So we are exporting more propane to India, where it’s widely used for cooking.

The continued rise in the American Energy Independence Index (AEITR), which includes all the biggest pipeline companies in North America, reflects increasing optimism that economic activity is returning. The charts below show interesting data from Apple that estimate how much people are traveling based on their requests for directions from Apple Maps.

.avia-image-container.av-1kre519-9622a9994fe5874d66a8dd35b9072d51 img.avia_image{ box-shadow:none; } .avia-image-container.av-1kre519-9622a9994fe5874d66a8dd35b9072d51 .av-image-caption-overlay-center{ color:#ffffff; }

.avia-image-container.av-17cd5y5-469a86779ff80f634c04b7aef216e763 img.avia_image{ box-shadow:none; } .avia-image-container.av-17cd5y5-469a86779ff80f634c04b7aef216e763 .av-image-caption-overlay-center{ color:#ffffff; }

.avia-image-container.av-tigcql-b9a54389389fb66da8c87edc518ac643 img.avia_image{ box-shadow:none; } .avia-image-container.av-tigcql-b9a54389389fb66da8c87edc518ac643 .av-image-caption-overlay-center{ color:#ffffff; }

People are walking and driving more, although Atlanta is closer to normal than New York. What’s also interesting is that mass transit use isn’t recovering as quickly. Almost 21 thousand people have died in New York City, about a fifth of the U.S. total. There are many reasons for this concentration, but extensive use of mass transit is likely one of them. The public has clearly reached that conclusion. Although many expect working from home to reduce energy consumption for commuting, if large numbers of people avoid mass transit it’ll boost gasoline consumption, to the extent that it results in more road trips.

All 50 states are relaxing constraints. I for one have been amazed – shocked, in fact – at how easily state governors can restrict our freedom for an extended period of time with seemingly little legislative oversight. The gradual recovery in travel is a welcome sign that we’re emerging onto the other side of the pandemic.

.avia-image-container.av-24x7om5-93fbcf2552f621c60563701eb240888f img.avia_image{ box-shadow:none; } .avia-image-container.av-24x7om5-93fbcf2552f621c60563701eb240888f .av-image-caption-overlay-center{ color:#ffffff; }

Airline activity is starting to pick up as well – in recent days the TSA reports air passenger traffic reached 15% of normal, doubling from early May. Signs are that America is gradually emerging from its lockdown. The consequent increase in energy use is drawing investors to the sector.

We are invested in Magellan Midstream, and all the components of the AEITR.


Falling Emissions Are Good For Energy

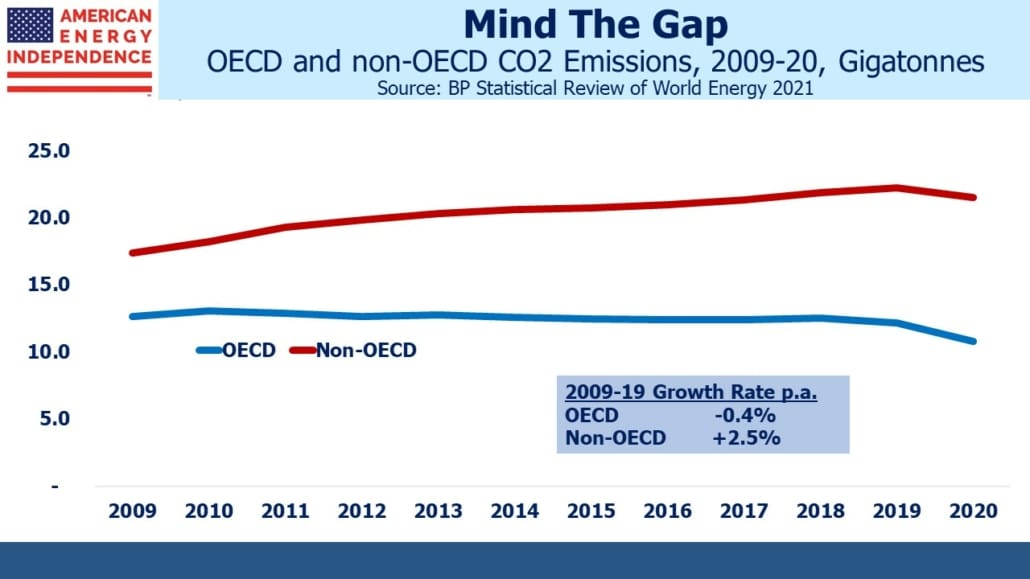
The International Energy Agency (IEA) expects CO2 emissions to fall 8% this year. This is six times the reduction that followed the 2008 financial crisis, reflecting the far greater drop in economic activity. Transportation has plummeted — peak congestion on roads in March was estimated down 50-60% in major cities around the world including Los Angeles, Sao Paolo and Mumbai. The IEA estimates that aviation fuel demand was down 27% in March. This likely understates the actual fall. TSA figures show passenger traffic through security checkpoints down over 95% in March and April.

Even the most die-hard climate extremist can hardly cheer this news, given the circumstances. But the size of the drop will take emissions back almost a decade. If the world had only twelve years left before climate change catastrophe, as Alexandra Ocasio-Cortez (AOC) asserted last year, we can now make it to 2040.

.avia-image-container.av-1980094-6c5f4aa4dc166f2ed09588c5c8b81fca img.avia_image{ box-shadow:none; } .avia-image-container.av-1980094-6c5f4aa4dc166f2ed09588c5c8b81fca .av-image-caption-overlay-center{ color:#ffffff; }

Energy demand from the transportation sector may never fully recover. Working from home has been less disruptive than imagined. On earnings calls with pipeline companies, whenever the topic came up CEOs noted that working remotely was fine. Facebook is just one company whose workforce will largely be remote for the rest of the year. Less commuting, less business travel and vacations closer to home could become permanent. Declining use of public transport for fear of infection may partially offset this, but overall the pandemic’s impact on energy demand will most likely be a long-lasting reduction.

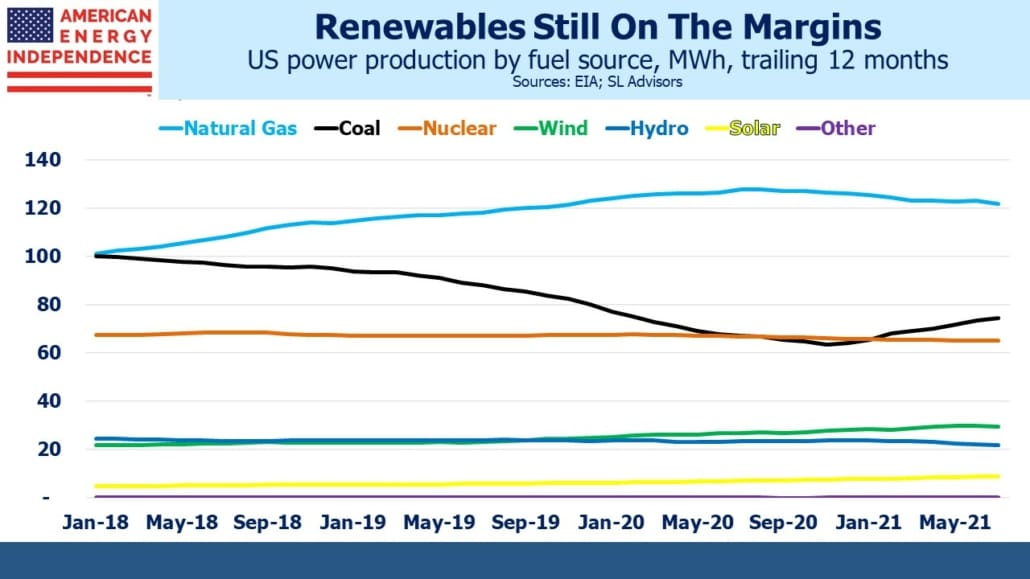
Coal demand has also been hit hard. China burns half the world’s coal, and it produces around 70% of their electricity. Nothing meaningful can happen on climate change without China (listen to our podcast: China Keeps Warming the Planet).  The lockdown lowered Chinese power demand, shrinking coal consumption. In the U.S., coal-fired power demand in 1Q was down by a third compared with a year ago (a mild winter, cheap natural gas and greater use of renewables helped).

.avia-image-container.av-1zt79k-bfdac99a213e78d08a71e188e1d6b76f img.avia_image{ box-shadow:none; } .avia-image-container.av-1zt79k-bfdac99a213e78d08a71e188e1d6b76f .av-image-caption-overlay-center{ color:#ffffff; }

Climate extremists will continue to press their case, but they’re unlikely to gain new adherents in the next few years. Falling emissions and the urgency of repairing the huge economic damage we’re enduring will drive public policy. As we count the human cost of the lockdown in terms of neglected health, business failures and emotional trauma, returning to the economy we had will be a priority.

We need to be better prepared for the next pandemic. The World Health Organization (WHO) called climate change the biggest global health threat of the 21st century. They warn of 250,000 additional deaths annually from climate sensitive diseases starting in 2030 (like AOC, they believe we have around a decade left). Coronavirus deaths will be multiples of this figure when the numbers are finally added up.

The WHO’s website on climate change adds that, “The direct damage costs to health is estimated to be between USD 2-4 billion per year by 2030.” This number is derisively insignificant compared to the trillions we’re spending in America in financial support alone. Similar fiscal support along with economic losses are occurring globally.

The WHO pursued politically correct groupthink (listen to our podcast: Climate Change Was Never Our Biggest Threat). They were trying to be woke. It’s time they woke up.

This reordering of priorities is bullish for the energy sector. Jim Cramer often points out that young money managers won’t invest in fossil fuels because of climate change. Many will retain that bias, but that’s now yesterday’s trade. At the margin, rebuilding our economy and the current sharp drop in emissions will trump global warming. High school dropout Greta can resume her education — remotely. The world’s focus has shifted.


Pipeline Cash Flows Will Still Double This Year

One of the few pleasant surprises of recent weeks is that business for the major pipelines remains solid. Now that 1Q earnings season is complete, we have revised guidance from all the companies in the broad-based American Energy Independence Index.

Caution was evident throughout on earnings calls, as one company after another described the impact of collapsing transportation demand and the high degree of uncertainty around forecasts. Some of the figures were stunning — Magellan Midstream reported a 20% drop in demand for refined products (mostly gasoline) in April, and a 76% drop in jet fuel, although they did note an improvement in the latter part of the month.

As we entered 2020, the expectation for rapidly growing Free Cash Flow (FCF) underpinned a positive outlook for the sector (see The Coming Pipeline Cash Gusher from April last year). We provided a current look two months ago (see Updating the Coming Pipeline Cash Gusher), but with minimal new guidance.

.avia-image-container.av-1t00akt-2cde559ff79183a5137ec48a264237b8 img.avia_image{ box-shadow:none; } .avia-image-container.av-1t00akt-2cde559ff79183a5137ec48a264237b8 .av-image-caption-overlay-center{ color:#ffffff; }

With new guidance provided on earnings calls, EBITDA and Distributable Cash Flow (DCF) have generally been revised down by 10-15%, a much smaller drop than many feared in March when the sector plunged. So our 2020 DCF forecast is now $51BN, versus $60BN a year ago. There is exposure to volumes and prices, but long term “take or pay” contracts provide solid support at times like this.

Spending on growth projects is being cut at roughly the same pace. Every dollar not spent boosts FCF. Investors regard this as welcome acknowledgment of reality – energy management teams have often been too ready to reinvest back in their business, similar to their upstream customers.

.avia-image-container.av-149ke8d-d436564c40033fa8d5f40bbae3051d6d img.avia_image{ box-shadow:none; } .avia-image-container.av-149ke8d-d436564c40033fa8d5f40bbae3051d6d .av-image-caption-overlay-center{ color:#ffffff; }

The top ten midstream energy infrastructure companies have shaved over $5BN from this year’s growth plans. Since there’s rough alignment between the drop in DCF and reduced growth capex, FCF still looks likely to double this year versus last. There can’t be many sectors that can be expected to generate such a result.

In turn, this is supporting dividends which are, for the most part, still being paid (see Pipeline Payouts Holding Up).

The story isn’t as positive for MLPs, which have been much more active in slashing payouts. The MLP-dedicated Alerian MLP ETF (AMLP) lowered its dividend again recently, reflecting what its components are doing. Compared with the midstream energy infrastructure sector, MLPs have more liquids/less natural gas exposure, more risky gathering and processing, and are more leveraged (see More Solid Pipeline Results). Only two of the ten biggest pipeline companies are MLPs, and size tends to bring diversification of flows as well as stability.

.avia-image-container.av-u46oa5-0ff44518283ef870686f23b4c743a4c2 img.avia_image{ box-shadow:none; } .avia-image-container.av-u46oa5-0ff44518283ef870686f23b4c743a4c2 .av-image-caption-overlay-center{ color:#ffffff; }

Even after incorporating the impact of Coronavirus, FCF is still expected to double year-on-year. If it happens, it’ll represent a stunning turnaround for a much maligned sector.

It’s still too uncertain to extend that forecast out to 2021. Few companies would offer any type of confident guidance. In our first piece on the topic in April 2019, we were originally looking for FCF to double again next year. That would push the sector’s FCF yield above 11%.

This is why the rebound from the lows of late March has so much momentum.


How Risky is Dining Out?

For a graphic picture of how the restaurant business has shut down, it’s hard to beat the OpenTable chart below. For several weeks, U.S. dinner reservations on their system have run at 100% below normal (i.e. there were none).

What portion of this sector survives depends on the pace at which we re-open, combined with the public’s perception of risk.

.avia-image-container.av-1ryk4ln-40d94185feea56d78ed38e459196e759 img.avia_image{ box-shadow:none; } .avia-image-container.av-1ryk4ln-40d94185feea56d78ed38e459196e759 .av-image-caption-overlay-center{ color:#ffffff; }

When it comes to risk assessment, human behavior is not always driven by numbers. Flying is an example – although aviation deaths are extremely rare, terrifying media coverage overwhelms the data, which is that around 150,000 commercial flights are completed safely every day worldwide (pre-Coronavirus).

Some find the imagery overpowers the logic, and as a result they drive because they feel safer, even though 38,000 Americans die annually on the roads.

That type of risk aversion does relatively little harm to society – the individual who chooses to drive 1,000 miles bears most of the additional risk from that decision.

.avia-image-container.av-1b8p163-94e3aa2f3489931a416ec294ba6c4c0e img.avia_image{ box-shadow:none; } .avia-image-container.av-1b8p163-94e3aa2f3489931a416ec294ba6c4c0e .av-image-caption-overlay-center{ color:#ffffff; }

Fear of nuclear energy has caused much more harm, by impeding our use of a zero-carbon source of electricity, thereby increasing use of coal. HBO’s Chernobyl series last year could have done great harm to the future of America’s nuclear power business if its prospects weren’t already so bleak. In the popular imagination, the image of a peacetime mushroom cloud creates visceral opposition. Per terrawatt hour of electricity produced, nuclear kills 1/1,000th as many people as coal. But the coal deaths from pollution are steady and unrelenting, while events leading to deaths from nuclear are spectacular.

There are still no recorded deaths from the 2011 nuclear accident at Fukushima, Japan, although 2,259 deaths are blamed on the subsequent evacuation. Three Mile Island also caused no deaths.

.avia-image-container.av-udplxn-cb4bb16b7d6df8e2f91f0f26be5ebe31 img.avia_image{ box-shadow:none; } .avia-image-container.av-udplxn-cb4bb16b7d6df8e2f91f0f26be5ebe31 .av-image-caption-overlay-center{ color:#ffffff; }

Public policy decisions on Coronavirus seek to find a balance between minimizing loss of life from the virus itself, and the less measurable collateral damage (economic and health) from shutting down much of life as we knew it. Although there are instances of lockdown protests, opinion polls show widespread support.

Dinner reservations provide a view of how one industry is being impacted. Some regions are slowly reopening, and anecdotal evidence so far suggests that, even with the mandated reduced capacity to maintain social distancing, there are plenty of open tables.

Although policymakers will determine when businesses can re-open, the public’s assessment of risk may lag. Society’s vulnerable members are generally well defined as the older and those with other serious health issues (see footnote on chart below). Statistics on road deaths and aversion to nuclear power show both extremes of risk tolerance. We’ll soon find out where Coronavirus risk sits on this spectrum.

Chart note: Due to the time lag in filing death certificates, the CDC currently counts around 37K COVID-19 deaths, roughly half the generally accepted figure.


The Market Recovers With Energy

Energy has rebound strongly from the market’s low on March 23rd. The S&P Energy ETF (XLE) is up 64%, matching the broad-based American Energy Independence Index (AEITR) and handily beating the S&P500 which is up 31%%. Although the YTD figures still show the energy sector down over 35%, quarterly earnings reports continue to provide plenty of positive news (see More Solid Pipeline Results, Pipeline Payouts Holding Up and listen to our recent podcast, Pipeline CEOs Provide Optimism).The story with MLPs continues to be less positive. 24 have now reduced or eliminated distributions in recent weeks, according to MLPData.com. The Alerian MLP ETF, AMLP, reduced its distribution again last week, such that it’s now 50% lower than five years ago.

This reflects the general trend of MLPs in recent years.Investors in MLP closed end funds (CEF) have had an even worse deal. Many CEF fund managers exhibited reckless arrogance in maintaining maximum leverage during the collapse in March (see The Virus Infecting MLPs). The strong rebound in energy hasn’t helped much – for example, the Tortoise Energy Infrastructure fund (TYG) is still down 75% for the year. Like other MLP CEFs, they were forced to dump positions at the lows in late March, locking in permanent losses and increasing the unrealized losses of those investors who prudently avoided leverage.
Tortoise recently followed this up by announcing they were suspending distributions on three of their MLP CEFs. MLP investors are by now de-sensitized to such abuse. MLP CEFs have destroyed enough capital that they’re no longer a meaningful factor in the sector.

.avia-image-container.av-sndivv-bffc77a842dd5150253c8ab15d9007f0 img.avia_image{ box-shadow:none; } .avia-image-container.av-sndivv-bffc77a842dd5150253c8ab15d9007f0 .av-image-caption-overlay-center{ color:#ffffff; }

MLP earnings calls have included some long overdue criticism of management teams. The sycophantic analyst who precedes his question with “great quarter guys” is receding as investors count the cost of poor management. JPMorgan’s Jeremy Tonet questioned Enlink’s generous stock-based compensation, which he pointed out was an eye popping $9MM in the quarter, and quite dilutive. It’s a transfer of over 1% of the company’s market cap each quarter. Tonet followed up as seeming bewildered as to what were the key metrics for that compensation, since it’s been relatively constant for several quarters while the business has deteriorated.

Plains All American, a large crude oil pipeline operator, received some pointed feedback from Ganesh Jois of Goldman Sachs: “Firstly, on your CapEx outlook for 2021 and beyond; in a flat to declining U.S. production environment, I’m wondering what it is exactly that you might be thinking of spending on? And the second question I have is, we’ve now seen 3 distribution cuts from you all. At what point is a unitholder going to be prioritized when it comes to capital allocation, as opposed to bondholders and generally asset build-out?”

In other words, why are they still spending any money on new crude pipelines. They just took a $2.5BN impairment charge, the cost of overpaying for acquisitions in years past. They’re still planning to spend $1.1BN this year. As serial mis-allocators of capital, you’d think they’d take a break from it for a few quarters.

The contrast with bigger corporations like Enbridge and Pembina is stark. These companies keep paying their dividends and have a conservative culture that rewards investors over the long term.

The lesson is increasingly clear; pipeline corporations generally have better corporate governance and are run more conservatively. Most MLPs are to be avoided. The big ones (Enterprise Products; Energy Transfer and Magellan Midstream) are worth holding, but many smaller MLPs that too often look as if they’re run for the benefit of management should be avoided.

MLP-dedicated funds, such as the now diminutive MLP CEFs mentioned above as well as AMLP, are stuffed full of the MLPs which have few other natural buyers. The outperformance of pipeline corporations versus MLPs is well established, and likely to continue.

We are invested in the names mentioned above.


The U.S. Borrowing Pandemic

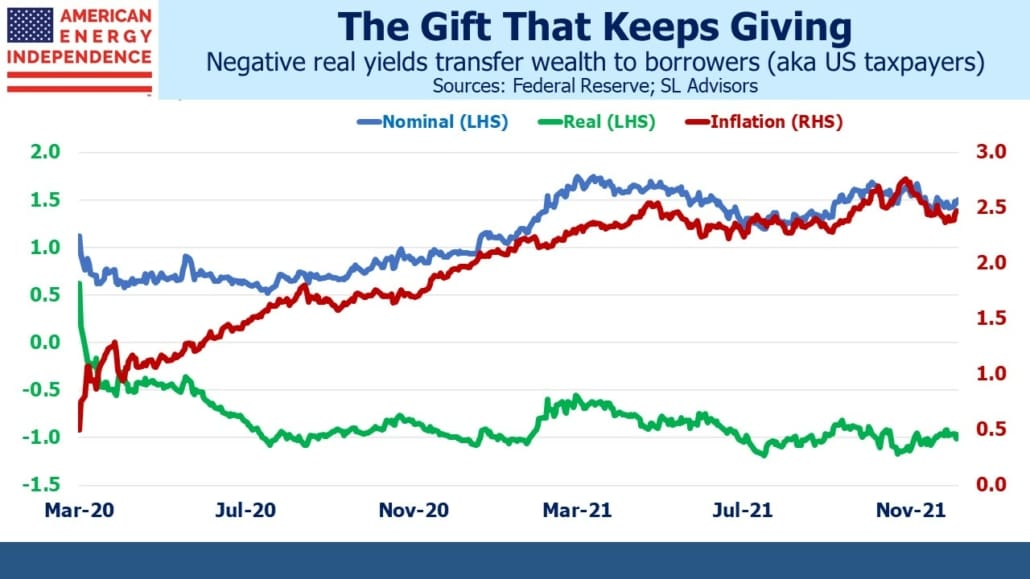
Ever since the 2008 financial crisis ushered in permanently low interest rates, perhaps the biggest question in finance has been why long term rates remain so low (see Real Returns On Bonds Are Gone). On Monday, the U.S. Treasury announced plans to issue $2.99 trillion in marketable debt this quarter, and $4.5 trillion this fiscal year. The second quarter sum alone is more than double what we borrowed last year.

Given the sharp drop in yields, there’s evidently no shortage of buyers. Corporations have been eager to borrow money too. Apple had $94BN in cash and marketable securities as of the end of March – and yet they borrowed $8.5BN in the bond market on Monday. Liquidity is king. At Saturday’s virtual annual meeting, Warren Buffet mused that the $137BN in cash held by Berkshire, “…isn’t all that huge when you think about worst-case possibilities.”

The most fundamental responsibility of a corporate treasurer is to ensure adequate liquidity for any plausible scenario.

.avia-image-container.av-1aupcf6-39eaa0175b748e92104eab8016f3dd04 img.avia_image{ box-shadow:none; } .avia-image-container.av-1aupcf6-39eaa0175b748e92104eab8016f3dd04 .av-image-caption-overlay-center{ color:#ffffff; }

Oneok (OKE) offers an interesting example, because they tapped the bond market for $1.65BN in early March, and just returned for $1.5BN this week. Like most pipeline companies, cuts to spending on new projects exceed their estimated drop in EBITDA. This cash is going to be held, and hopefully not needed. It’ll sit in treasury bills, partially answering the question of who’s going to buy all this new debt the U.S. is issuing.

The negative spread between OKE’s 6.31% blended cost and the 0.10% yield on treasury bills will cost $93MM annually. The $8.5BN Apple raised will also sit in treasury bills alongside the $94BN they already have. These are both small components of the cost of uncertainty.

The Federal government’s fiscal and monetary response has been appropriately massive. They’ve been so effective that Berkshire Hathaway was unable to negotiate any expensive, emergency investments.

The cost is rapidly mounting. Excessive caution was justified in the early days of the pandemic. Hospitals in New York faced the real threat of being overwhelmed, so shutting the economy down to “flatten the curve” was expedient. This has transitioned to a strategy of suppression, with a less clear exit but an increasingly visible and staggeringly big cost.

.avia-image-container.av-tbb5du-f2d3a00088ebbd4c49a87933090e6d98 img.avia_image{ box-shadow:none; } .avia-image-container.av-tbb5du-f2d3a00088ebbd4c49a87933090e6d98 .av-image-caption-overlay-center{ color:#ffffff; }

Fatality rates based on known cases reflect the 2% of the population that’s been tested, and people are often infectious without showing symptoms. Data increasingly shows Coronavirus to be highly contagious but with a fatality rate in the ballpark of the flu for those that are young and otherwise healthy.  For those between 18-49 years of age, the flu has a mortality rate around 0.02%. Coronavirus anti-body tests are revealing substantial portions of the population to have been already infected. New York City estimates a 19.9% citywide rate. Combined with the city’s fatality rate of 161.17 per 100,000 population, this suggests the fatality rate may be close to 0.81%, skewed towards the elderly.

The vulnerable are well known; 96% of New York City patients hospitalized for Coronavirus had additional health issues, often obesity, diabetes or a heart condition. Dr. Scott Gottlieb, a former FDA commissioner regularly on CNBC, said mitigation hasn’t worked, “as well as we expected.” The virus isn’t going away anytime soon.

Suppression can only go so far. We’re going to have to adapt to the virus. The data suggests people under 44 have extremely low risk, but lockdown strategies rarely differentiate based on risk factors. Targeted stay at home orders for older people and those with health vulnerabilities would allow a return to more normal economic activity, arresting the spiraling debt with little increased health risk. We accept 38,000 road fatalities annually, which could be reduced with lower speed limits. Society already makes these tradeoffs.

Few of us are epidemiologists, and deferring to the experts was correct at the outset. But given the huge economic impact and $TNs in Federal spending, we’d all better do our best to become better informed. It’s correctly becoming a political issue.

We are invested in OKE