Covid Exposes Innumeracy

Labor Day weekend heralds the traditional end of summer in America. School starts shortly thereafter. For the past several months, school districts across the country have been wrestling with modified in-person versus fully online classes.

It’s the most consequential set of decisions of the pandemic. 50 million students attend school from kindergarten through 12th grade. In March, schools abruptly switched to online learning. Few will be surprised that it failed students and piled stress on teachers as well as working parents.  Children are collateral damage, “…many students are struggling and falling far behind where they should be” reported the head of the Los Angeles Unified School District (see The Results Are In for Remote Learning: It Didn’t Work).

The effectiveness of lockdowns is increasingly being questioned – New York City’s was imposed by Mayor de Blasio on March 20th, and infections continued rising for another three weeks. Deaths peaked after four weeks. By early May, two thirds of hospital admissions were from people who had been sheltering at home, in compliance with the lockdown.

Moreover, cases continued to fall and have stayed low after some restrictions were eased, suggesting that the spread had reached its break point without government intervention. We may slow infections temporarily, but ultimately the virus moves through the community.

Lockdowns have turned out to be a “blunt and economically costly tool” according to a recent article. Sweden’s modest restrictions were widely criticized, but its fatality rate is lower than the UK, which imposed tougher controls. Sweden’s Nordic neighbors have done better, but that’s partly due to Sweden’s more expansive definition of a Covid death.

The UK is seeing a 40% jump in non-Covid deaths, suggesting people are delaying seeking medical care. The government has pleaded with citizens to “protect” the National Health Service, by not getting sick. We haven’t yet started to count the cost of mitigation.

It turns out there are such enormous gaps between public perception and reality that statistics ought to be a core requirement for a high school diploma.

.avia-image-container.av-q2ocj7-a7180146a1d6d06b372d88570c88b25e img.avia_image{ box-shadow:none; } .avia-image-container.av-q2ocj7-a7180146a1d6d06b372d88570c88b25e .av-image-caption-overlay-center{ color:#ffffff; }

Two surveys illustrate: one from Kekst CNC polled 1,000 adults in each of five different countries. The average rate of infection estimated by U.S. respondents was 20% — 66 million people, or 20X the number of CDC-confirmed cases at the time. Serology tests that look for the presence of Covid anti-bodies show that the actual infection rate is many times higher than the number of positive tests, so this result might imply the respondents have a more sophisticated understanding.

Their estimate of deaths shows otherwise, with an average response of 9% of the population. If 30 million Americans had died, rather than 180,000, that would suggest an Infection Fatality Rate (IFR) of 45%. Estimates put it at under 0.5% for all ages and perhaps 0.1% for those under 65.

.avia-image-container.av-10n01rn-df41f1391db0fddcec85868acf5adb05 img.avia_image{ box-shadow:none; } .avia-image-container.av-10n01rn-df41f1391db0fddcec85868acf5adb05 .av-image-caption-overlay-center{ color:#ffffff; }

The Covid IFR is tragically high for the older population, those with co-morbidities, and worse if you’re old and have health problems. But here, another survey shows that people underestimate the proportion of deaths inflicted on older age groups. A Franklin Templeton-Gallup survey found that respondents estimated 58% of deaths were among people 55 and older, whereas it’s 92%. It also found that, “The misperception is greater for those who identify as Democrats, and for those who rely more on social media for information.”

Covid has been the top news story almost all year, feeding or fed by these misperceptions depending on your view. There’s no better example of the primacy of fear over facts than Andrew Cuomo’s upcoming book, American Crisis, which promises an inside view of his handling of the pandemic.

Cuomo’s oversight of the nation’s second worst fatality rate (topped only by New Jersey) is less recognized than his sober daily press conferences.

Dispatching infectious but stable patients back to nursing homes to free up hospital beds that were never needed was leadership that led to thousands of avoidable deaths. A skilled communicator of bad news can dodge accountability.

A poor understanding of the figures is about to infect the nation’s schools. Virtual classes are inferior for everyone, but the impact is most severe for younger children. There are over 35 million students in K-8th grade. Their education will likely be compromised. 27 children aged 5-14 have died from Covid. These are all heartbreaking – as are the 2,793 children who have died from non-Covid causes over the same period.

Clearly teachers are more at risk, depending on age and health. A scared teacher won’t teach well, and there are legitimate cases for older teachers and those with compromised health to opt out. But with entire school districts planning for online instruction because of insufficient staff, our collective failure to understand the numbers has millions of young victims.

If you regularly visit The Covid Tracking Report, the Worldometer Coronavirus pages and Covid-19 Data from the CDC, you’ll find most mainstream news media of little use.

Instead, try Twitter where we’ve found some fact-based reporting, including by Alex Berenson, Florian Krammer, Kyle Lamb and a few others hidden behind pseudonyms such as the Ethical Skeptic and el gato malo.

We also found this quarterly letter from David Capital Partners insightful.

The reason stocks continue to march higher is because investors are collectively processing the data and overlooking the popular mood. The gulf between Wall Street and Main Street was never wider.


California Dreamin’ of Reliable Power

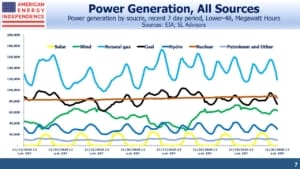
Californians have recently been enduring rotating blackouts – short term loss of power due to excessive demand. When the lights go out and the a/c units no longer hum, it’s always political. Oddly, both sides can agree that climate change is to blame. Liberals attribute the extended high temperatures in southern California to the gradual manmade warming that is afflicting the planet. Conservatives see a reliance on unreliable renewables as the cause – underlying the power supply shortfall was the loss of 100MW of output from a wind farm.

.avia-image-container.av-lf0ojw-24fbb566e88ec97375efd70519469aef img.avia_image{ box-shadow:none; } .avia-image-container.av-lf0ojw-24fbb566e88ec97375efd70519469aef .av-image-caption-overlay-center{ color:#ffffff; }

Perhaps global warming is making it less windy. Environmental extremists will argue that fighting climate change is ever more urgent, while pragmatists will note that using more intermittent renewables is leaving consumers vulnerable to shortages.

What’s happening in California is important to all Americans, because it’s a preview of what an energy policy run by environmental extremists could look like if inflicted across the entire country.

For the past decade, California has been steadily pushing renewables’ share of power generation. For much of that time natural gas was easily the biggest source of electricity, since coal use stopped completely in 2015.

.avia-image-container.av-12qbdrg-f589d109be6eafa2436b03b1120e1dd7 img.avia_image{ box-shadow:none; } .avia-image-container.av-12qbdrg-f589d109be6eafa2436b03b1120e1dd7 .av-image-caption-overlay-center{ color:#ffffff; }

But environmental extremists have been single-minded in their desire to run everything with solar panels and windmills. Although the state has not banned natural gas, it does allow cities and counties within the state to do so. Diablo Canyon, California’s last remaining nuclear power plant, will close its two reactors in 2024-25.

In 2018, California passed a law mandating 50% of its electricity to be from renewable sources by 2025, 60% by 2030 and 100% by 2045. There are no plans to build new nuclear capacity, so it looks like sun and wind will be the major source of power.

.avia-image-container.av-q7odzg-8535ccf075a16b97bba151a6d65d26fe img.avia_image{ box-shadow:none; } .avia-image-container.av-q7odzg-8535ccf075a16b97bba151a6d65d26fe .av-image-caption-overlay-center{ color:#ffffff; }

America has been reducing its CO2 emissions, but oddly California has been lagging the rest of the country, with a slight worsening since 2011. This fact must sit uncomfortably with those thoughtful advocates of California as a leader in renewables. The problem, as anyone trying to drive around Los Angeles knows, is that transportation still relies heavily on fossil fuels. A couple of years ago when I was visiting clients with a salesperson for a couple of days, traffic estimates were critical to our meeting schedule. In fact, every meeting seemed to open with a brief chat about the 405. Automobiles and traffic jams generate a lot of California’s emissions.

.avia-image-container.av-wvyxqk-184860cb706312c3830d76a6cf8c0b80 img.avia_image{ box-shadow:none; } .avia-image-container.av-wvyxqk-184860cb706312c3830d76a6cf8c0b80 .av-image-caption-overlay-center{ color:#ffffff; }

California’s renewables effort has focused on electricity, but that’s less than 14% of total energy consumption. This is why the popular image of green California isn’t reflected in reduced emissions.

The average retail price of electricity in California is 16.58 cents, versus 10.53 cents for the country as a whole. Unreliable power that costs 57% more than the average, along with a slower rate of emissions reduction, are not the hallmarks of a successful policy to combat climate change. This is where the drivers of Joe Biden’s energy policy are hoping to take us. The Biden-Sanders Unity Task Force has recommended, “…eliminating carbon pollution from power plants by 2035”. This is a decade ahead of California – because it’s going so well there.

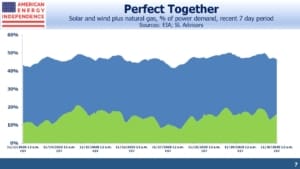
California’s power blackouts are in part because the wind has inconveniently not been blowing when needed. This is why natural gas is such a good compliment to intermittent renewables – it’s always available. Many other U.S. states have embraced this, including Nextera (NEE), loved by environmentalists and investing in natural gas pipelines.

Energy density is another challenge that will lead to NIMBY problems.

An article in the Financial Times (see Green power needs to be dense power) compared the 950 acres required for a UK solar farm to produce 350 megawatts of power with the 80 acres to house a nuclear project with 3,200MW of output. Not only is this 9X the power output on under 9% of the land, but the solar plant is only expected to operate at 11% capacity, versus 90% for the nuclear. The power output per acre is 1,000 times lower for this solar installation compared with nuclear, a significant problem in densely populated Britain.

Any solar installation in the UK is a green extremist triumph in willful denial of the climate – but at least they’re still building nuclear plants, because they do want to keep the lights on.

California’s blackouts show what happens when climate extremists run energy policy. The silver lining for investors is that such policies lead to, and desire, high energy prices – both as a constraint on demand and also because it makes renewables less uncompetitive. Returns on energy investments tend to follow energy prices. Green policies that constrain supply need not be bad for the sector.

We are invested in all the components of the American Energy Independence Index via the ETF that seeks to track its performance.


Different Ways To Use Solar Power

As the world embraces more solar power, it turns out there are two competing visions – the traditional utility model of building solar farms for transmission to customers, and the distributed model where businesses and homes generate their own power using rooftop solar panels. One solution is likely to win, and today two highflying companies offer a sharply different way forward.

Nextera Energy (NEE), through its subsidiary Florida Power and Light (FPL), has 28 major solar plants generating almost 2 Gigawatts (GWs) of power, and plans to add 30 million solar panels (another 9 GW) over the next decade. 1 GW is conventionally believed capable of powering around 725,000 homes assuming constant load without peaks. Solar power is intermittent, but NEE is investing in battery storage too for when it’s not sunny in the sunshine state (such as at night and during hurricane season).

The FPL Manatee Energy Storage Center will have 409 megawatts of capacity (the equivalent of approximately 100 million iPhone batteries) when it begins operation late next year. NEE describes themselves as, “one of the world’s largest generators of clean, renewable wind energy, with the largest market share of North American wind capacity.” Solar was mentioned 27 times on NEE’s recent earnings call.

Tesla (TSLA) has a different vision that might well compete with NEE’s. TSLA’s $275BN market cap suggests that their electric vehicles will wipe out the traditional automakers. However, venture capitalist Chamath Palihapitiya believes that the bull story is built on TSLA’s energy business, which he notes is already profitable. TSLA offers residential customers solar panels with which to generate electricity, a battery (Powerwall) to store it, and software to manage the process. Palihapitiya believes part of TSLA’s upside lies in its ability to make every sunny home energy-independent.

It’s a compelling argument. While NEE is a leader in generating power from renewables, TSLA may lead to creative destruction of the wholesale-retail utility model that has existed almost as long as the commercial use of electricity. Solar is more likely than wind to adopt such a model – rooftop windmills seem implausible – and the sunny weather that solar farms rely on is also available to their residential customers. Utilities, with their high fixed costs and regulated pricing, are vulnerable to an erosion of their customer base, similar to the cord-cutting that has hurt cable TV providers.

My partner Henry Hoffman, author of this insightful NEE/TSLA comparison, recently invested in a home generator. Although Tropical Storm Isiasis makes this purchase look timely, his motivation was New York’s poorly conceived obsession with renewables. He chose the 22kW Generac natural gas generator.

Henry expects rolling brownouts will become more common as the NY metropolitan area struggles to meet power demand, a problem exacerbated by the pending shutdown of the 1GW Indian Point unit 3 nuclear facility next year.

.avia-image-container.av-qb4p8g-751394f8221f7ff92d65f2b9edd9d4fe img.avia_image{ box-shadow:none; } .avia-image-container.av-qb4p8g-751394f8221f7ff92d65f2b9edd9d4fe .av-image-caption-overlay-center{ color:#ffffff; }

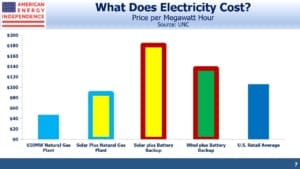
The solar devotee still needs TSLA’s Powerwall, which costs $7,167 per powerwall plus installation, to save that sunlight for the evening. Six powerwalls, costing $43K, would provide one day’s backup for a typical suburban home, on top of $22K for solar panels to charge the batteries. The solar purist would be carbon-free for $65K, plus the cost of installation.

Many homes in our neighborhood recently lost power, and the hum of generators seems more widespread than in the past. Solar panels,  plus a natural gas generator, offer the pragmatist green credentials, no intermittency, and more reliability than today’s fragile distribution infrastructure with its aboveground power lines strung from utility poles. A generator costs less than a fleet of powerwalls too.

.avia-image-container.av-qbnzog-fcb19907716b7a4c7dcd03b16ccd7c15 img.avia_image{ box-shadow:none; } .avia-image-container.av-qbnzog-fcb19907716b7a4c7dcd03b16ccd7c15 .av-image-caption-overlay-center{ color:#ffffff; }

The way in which we’ll use the sun to generate power is not yet settled, and natural gas will continue to be the most important source. Enterprise Products Partners (EPD) delivers natural gas liquids (such as ethane) as a vital feedstock to the petrochemical industry. Regardless of the path energy markets take, plastics demand will keep rising, for which EPD is well positioned.

We are invested in EPD and all the components of the American Energy Independence Index via the ETF that seeks to track its performance.


Pipeline Earnings Should Confirm Growing Cash Flows

Earnings season for pipeline stocks begins on Wednesday 22nd, with Kinder Morgan (KMI) reporting after the market close. We expect the quarterly updates from the sector’s biggest companies will confirm the progress towards improved profitability (see Pipeline Cash Flows Will Still Double This Year). We’ll also hear from management teams how they regard the prospects for new projects.

Last year, a stand-off over Kinder Morgan Canada’s proposed Trans-Mountain Expansion halted construction. Opposition from environmental extremists in British Columbia thwarted oil-rich Alberta’s goal of increasing its access to export markets. The Canadian government bought the pipeline, saving KMI from a costly, intractable problem between two Canadian provinces. Enbridge commented in a call that they wouldn’t attempt to build a new oil pipeline in Canada, unless it was wholly within energy-friendly Alberta (see Canada Looks North to Export its Oil).

.avia-image-container.av-skkspu-6ccd8a1c41271bedfad8076d35efc1cd img.avia_image{ box-shadow:none; } .avia-image-container.av-skkspu-6ccd8a1c41271bedfad8076d35efc1cd .av-image-caption-overlay-center{ color:#ffffff; }

Following the cancelation of the Atlantic Coast Pipeline (see Pipeline Opponents Help Free Cash Flow), the continued legal uncertainty over already completed Dakota Access Pipeline (listen to  Judicial Over-Reach on the Dakota Access Pipeline) and the perennially delayed Keystone XL, big projects look similarly stymied in the U.S. Given the trends in election opinion polls and economic uncertainty over Covid, we expect few new initiatives for the balance of the year and possibly some further cancelations.

Although management teams will be frustrated, long-time investors in pipelines are realizing that poorly informed yet effective environmental extremists are an unlikely ally in leaving the sector with few options for its excess cash beyond returning it to investors through dividend hikes and buybacks. We expect this theme to play out over a couple of years. We suspect Berkshire’s interest in acquiring Dominion’s natural gas pipeline network is to redeploy the cash it generates to other Berkshire subsidiaries where capex is not controversial.

.avia-image-container.av-11tqyua-89f71dd30463bf84d0099d4bedf407df img.avia_image{ box-shadow:none; } .avia-image-container.av-11tqyua-89f71dd30463bf84d0099d4bedf407df .av-image-caption-overlay-center{ color:#ffffff; }

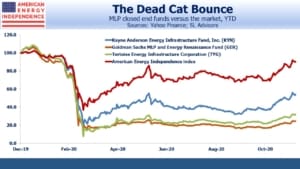
Investors continue to withdraw money from MLP-dedicated open-end funds. JPMorgan recently reported that during the first half of this year such outflows totaled $764MM, with June marking the fifth straight months of redemptions.

.avia-image-container.av-p84t1e-1f700f2d0b3c4266820fe3ea045cd2d5 img.avia_image{ box-shadow:none; } .avia-image-container.av-p84t1e-1f700f2d0b3c4266820fe3ea045cd2d5 .av-image-caption-overlay-center{ color:#ffffff; }

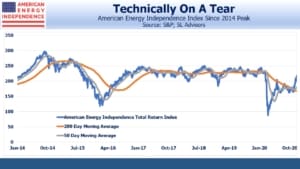
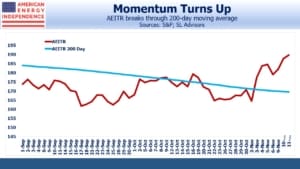
This is clear from relative performance, which shows the Alerian MLP Infrastructure Index (AMZIX) down 33% so far this year, lagging by 10% the more broadly representative American Energy Independence Index (AEITR). Corporations, which dominate the AEITR, have more numerous buyers than MLPs, which is why AMZIX is slumping. A broader set of investors and better governance are widely regarded as favoring corporations. Investor behavior is confirming this trend, which we expect to continue.

Stocks and bonds have appeared to reflect wildly different economic forecasts for years, which is why stocks always look cheap. The contrast between fixed income and equity investments is most dramatic in pipelines (see Pipeline Bond Investors Are More Bullish Than Equity Buyers). To cite one example, Enterprise Products Partners (EPD) has several 30-year maturity bond issues outstanding with yields from 3-3.2%. The company is a third owned by insiders, never cut its distribution and pays a 9.8% dividend. Skeptics of its equity might benefit from chatting with a few EPD bond holders.

We are invested in EPD and KMI, and all the holdings of the American Energy Independence Index via the ETF that tracks it.


Pipeline Opponents Help Free Cash Flow

Several major pipeline developments last week might well represent a key turning point in how the industry operates.

Berkshire Hathaway (BRK) acquired Dominion Energy’s natural gas pipeline and storage assets for an enterprise value of $9.7BN, which included BRK using $4BN of its cash pile. Although some estimated the price on the low side, Buffett clearly sees a long positive future for natural gas pipelines. This was a welcome endorsement.

At the same time, Dominion and Duke Energy canceled their planned Atlantic Coast gas pipeline project (ACP). This has been the subject of numerous court challenges from environmental extremists. The project appeared to be proceeding, with capacity 90% subscribed, and legal challenges successfully rebuffed. However, the possibility of further court proceedings with additional ongoing delays and cost uncertainty led Dominion and Duke to abandon the effort.

In other news, the U.S. Supreme Court over-ruled a lower court, which had blocked a permit program that several pipeline projects were relying on for construction. But at the same time, it rejected a request from the Trump Administration to allow construction of the Keystone XL crude oil pipeline that had been blocked by a Federal judge in Montana.

But the most stunning legal development was the ruling by U.S. District Judge James E. Boasberg that the Dakota Access Pipeline (“DAPL”) must immediately cease operations and remove all the crude in it within 30 days. DAPL’s construction under Lake Oahe, ND, near the Standing Rock Sioux Reservation, drew fierce protests from local Native Americans and others opposed to its construction. The Obama Administration was opposed to it. Following Trump’s election, the Army Corp of Engineers gave their approval and DAPL was completed. It has capacity of up to 570,000 barrels per day, moving crude from the Bakken in North Dakota to Patoka, IL.

The judge’s ruling finds fault with the approval issued by the Army Corps of Engineers, which was given on the basis of an Environmental Assessment (EA). The Court found that, given the controversial nature of the project, a more rigorous Environmental Impact Statement (EIS) was required under the National Environmental Policy Act (NEPA).

In summary, the judge believes the government incorrectly allowed the pipeline to be built.

Whether or not this is the case, ordering the pipeline to shut down defies common sense. The implication is that, even if the government issues a private company a permit, substantial economic risk remains if your opponents can find a compliant judge. DAPL could lose $1.2BN next year if it’s forced to close. Bakken crude production will face higher transportation costs as producers resort to rail, where spills are more likely. It may not even by physically possible to empty the pipeline within the 30 day deadline. The process includes pumping huge volumes of nitrogen into the pipeline to push a bullet-shaped “pig” through it.

There are numerous knock-on effects. Production may now be cut back in the face of higher transport costs, causing layoffs. Landowners who sold the pipeline the right to cross their land won’t get paid. North Dakota royalties on production will fall. One analyst suggested that Judge Boasberg was frustrated that the Army Corp of Engineers had concluded their EA was adequate even after the court told them to review their process. Under this interpretation, the judge is trying to punish the Army Corp of Engineers, although oversight of the Administration is more properly the role of Congress.

The ruling is being appealed, and DAPL may yet continue to operate if a higher court over-rules Judge Boasberg’s order to shut down the pipeline. For the judicial system to work, a more reasonable assessment is needed. But considerable uncertainty about DAPL’s future will remain, and if there’s a change in government in November, the Army Corps of Engineers may decide not to even issue an EIS, which they estimate will take 13 months. DAPL cost $7.5BN, substantially over budget because of numerous delays. It may never restart.

.avia-image-container.av-q4vn99-3215e909a1744ee01912b55c635e76b2 img.avia_image{ box-shadow:none; } .avia-image-container.av-q4vn99-3215e909a1744ee01912b55c635e76b2 .av-image-caption-overlay-center{ color:#ffffff; }

Energy Transfer (ET), who built DAPL and retains a 36.4% ownership stake, has earned a reputation for not backing down when opposed by environmental activists. But the implication of the ruling is that permit issuance by the Federal government can’t be relied upon when deploying capital. Whatever the merits of this particular case, a court shouldn’t be able to impose economic losses on a company that has obtained the necessary permit, just because the permit may have been issued incorrectly. Otherwise the permit recipient needs to review its own regulator for correct procedure. This is not how great nations are built.

The cancelation of ACP, the uncertainty over DAPL and the perpetual struggle to build Keystone XL will cast a shadow over every new pipeline project. Unpredictable legal delays have prevented the construction of nuclear power facilities in recent years – although most costs can be estimated, court challenges can burn up time and money in ways that are hard to anticipate. The private sector has concluded nuclear power is just not worth the trouble, impeding our use of this source of emission-free energy. The pipeline industry is going the same way.

Anti fossil-fuel activists have achieved a great victory. But they’ve also achieved what pipeline investors have failed to – a decreased appetite for new construction. The Shale Revolution has been a huge bust for equity investors in the U.S. energy sector, including midstream infrastructure. The old pipeline business that used to be dominated by MLPs did little new building, invested in maintenance of their existing assets and paid attractive distributions that grew through price hikes and productivity improvements.

Pipeline executives drank the same kool-aid as their upstream customers. Too often, growth projects failed to cover their cost of capital and acquisitions were based on unrealistic assumptions. The pursuit of growth has been, in aggregate, bad for investors. Canadian companies have been more disciplined, but the abject past decade’s performance of the Alerian MLP Index reflects poor capital allocation by management teams constantly building and buying.

Falling growth capex this year is the driver of increasing free cash flow (see Pipeline Cash Flows Will Still Double This Year). Last week’s court rulings are likely to further trim growth projects, which will be lamented by management teams but cheered by investors.

It’s also likely to increase the pricing power of existing infrastructure, especially where additional capacity is needed but unavailable due to growing legal uncertainty. If future customers ultimately can’t access natural gas because needed pipeline capacity wasn’t built, that will be someone else’s problem. Maybe a more predictable legal process will evolve, but for now it is clearly opaque and sometimes capricious.

Don’t let the disappointment that will be heard on 2Q earnings calls confuse you. Many of these companies developed a culture of always building. In the future, growth projects will be more modest additions to existing infrastructure where permit jeopardy isn’t a factor. Buffett is unlikely to pursue controversial new pipeline construction for the business he just acquired, and he sees much to like about its prospects. Climate activists are doing long-term pipeline investors a favor. Few would expect us to admit that! Barriers to entry are becoming insurmountable.


Energy Demand After Covid-19

Client meetings for many businesses have had to conform to local Covid-19 restrictions. Most of us have found that working remotely is fine, although I suspect it’ll become increasingly problematic in the months ahead. As Zoom calls suddenly became part of daily life, we were all chatting with people with whom we had recently shared an office. Relationships already existed. But we’ll see how it goes when newcomers have to build a rapport over Zoom. Training is also harder. Remote learning is widely believed to have been a bust (see The Results Are In for Remote Learning: It Didn’t Work). Research is finding that students achieved only 70% of the reading gains compared with a typical year, and less than 50% of the Math. This is why it’s critical that schools reopen in-person in September.

.avia-image-container.av-1ivzvl7-2df7b4cbc1e4f537f78d1a6e6f32597b img.avia_image{ box-shadow:none; } .avia-image-container.av-1ivzvl7-2df7b4cbc1e4f537f78d1a6e6f32597b .av-image-caption-overlay-center{ color:#ffffff; }

Meeting with clients has to take place outside – the photos are from a recent breakfast with two long-time clients and friends, Ron and Jeff Karp from Summit Private Investments. In March all the large investment firms we deal with quickly suspended visits by outsiders. Every contact now carries some risk, and it’ll be interesting to see how much old attitudes are restored once the general population is vaccinated or otherwise immune. It’s likely that the risk of infection disabling an entire department or firm will be a permanent consideration, just as business continuity plans took on added importance following the 2001 attack on the World Trade Center. In finance, we can expect regulators to start looking at how firms protect their employees, as well as their plans if another pandemic occurs.

Nobody misses their daily commute into New York City from the suburbs. Numerous conversations reveal that the 2-3 hours of time previously dedicated to daily travel is highly valued. People will return to the office, but it seems that schedules have permanently changed. Mass transit in the New York area and presumably others is likely to experience a permanent drop in demand, which will pressure finances.

JPMorgan expects to operate with offices only half full, even once restrictions have been lifted. “Hot desks”, available to different users each day will be a used at least temporarily. I understand from a friend that satellite offices are being considered in the suburbs, where enough formerly commuting employees live. Edison, NJ and Stamford, CT are two locations apparently under consideration. Although big corporations will want a more dispersed labor force, they’ll also want their people working in a secure IT environment subject to corporate oversight.

Another friend from Goldman Sachs told me seasoned employees in his department will work from home two days a week, and that such schedules will be fixed — i.e. if Tuesday and Wednesday are your at-home days, you’ll generally be required to stick to that. Interestingly, new hires will be expected in the office five days a week, recognizing that working remotely relies in part on existing professional relationships that have been built through in-person interaction.

I’ve also heard that ground floor office space is becoming more sought after, because workers don’t need to use the elevator. The WSJ noted the other day that some employers, “…can’t figure out how to send people up a 50-story skyscraper.” This is because, “… limiting riders on some elevators would create dangerous crowding in lobbies.”

.avia-image-container.av-195of8r-2bb98d194e4bee9546c0899d37d83362 img.avia_image{ box-shadow:none; } .avia-image-container.av-195of8r-2bb98d194e4bee9546c0899d37d83362 .av-image-caption-overlay-center{ color:#ffffff; }

What does all this mean for energy consumption? U.S. gasoline demand has recovered to around 85% of last year’s levels, a surprisingly strong rebound given the recession. The re-imposition of types of lockdown in some southern states hasn’t yet shown up in the figures. But over the longer term, even when masks and social distancing are mostly a memory, some reduction in demand is still likely.

.avia-image-container.av-tf26tn-002c84d032e76f28e9ef6bdbf51d60ec img.avia_image{ box-shadow:none; } .avia-image-container.av-tf26tn-002c84d032e76f28e9ef6bdbf51d60ec .av-image-caption-overlay-center{ color:#ffffff; }

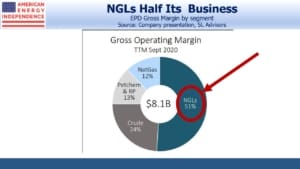
What receives less attention is the continued robust demand for natural gas. The latest weekly figures show total demand slightly ahead of this time last year, at 80.7 Billion Cubic Feet per Day. Across the midstream energy infrastructure industry, we calculate 58% is involved in natural gas with petroleum products only 26%. Although altered work habits are likely to dampen transportation demand, this is a smaller part of midstream than many realize. Earnings reports over the next few weeks will provide an important update on overall energy demand.


Revolutionary History Made Personal

History is about people, and personal connections always add interest. On hearing we’d be visiting Charleston, SC a good friend, Austin Sayre, suggested we stop by his family’s ancestral home. The Colonel John Stuart House is in Charleston’s historic district, where many of the homes have a plaque describing their former owner’s significance. Colonel Stuart is one of Austin’s ancestors.

The plaque and Wikipedia together describe Colonel John Stuart, a Scottish rebel who later represented the British government in dealing with Native Americans. Born in 1718 in Inverness, he arrived in Charleston in 1748. During the Revolution, his loyalty to the British crown meant he had to flee Charleston, and his house was confiscated. Stuart died in Pensacola, FL in 1779. The British Commander-in-Chief in North America, General Sir Henry Clinton, lamented, “The loss of so faithful and useful a servant to His Majesty.”

Charleston is a beautiful old city. Dozens of fine homes in the historic district have been restored, and it’s absorbing to stroll among them while reading about the lives of former residents. The water front is picturesque, and is best experienced on foot wandering down the narrow streets. The city also provided our first meal out in three months (see Having a Better Pandemic in Charleston, SC).

There’s more to the story. John Stuart didn’t just sail for the new world in search of opportunity. He was fleeing for his life. In 1745 Charles Edward Stuart (“Bonnie Prince Charlie”) led the Jacobite rebellion, which sought to overthrow King George II in favor of Bonnie Prince Charlie’s father, who was waiting in France. John Stuart, clearly of the same clan and therefore related, joined the uprising. It was put down at the Battle of Culloden in 1746, where the English won a decisive victory.

.avia-image-container.av-ihtdqc-01f11088f23cc258496ea780890b0744 img.avia_image{ box-shadow:none; } .avia-image-container.av-ihtdqc-01f11088f23cc258496ea780890b0744 .av-image-caption-overlay-center{ color:#ffffff; }

What remained of the Scottish army returned to their homes in the Scottish highlands. But King George II sought revenge against the treasonous officers who had led the uprising. John Stuart was wanted, and likely faced execution if caught. He and his brother Francis left Britain, on a ship that brought them to Charleston. There, John Stuart eventually built the house we had visited, and his descendants ultimately included Austin Sayre.

Incidentally, the TV series Outlander portrays the events around Culloden, including the battle, in a number of gripping episodes.

I contemplated this historical vignette and my connection with it. Part of it didn’t add up. John Stuart had gone to war against the British Crown in 1746, following which he had fled the country. Just 14 years after Culloden, we find Captain John Stuart in the local militia fighting the Cherokee Indians.  He was captured, but later released in exchange for a ransom.  In 1762, Stuart’s familiarity with Native Americans led the British to appoint him Crown Superintendent for Indian Affairs in the South.

During the Revolution, John Stuart’s loyalty to the Crown forced him to flee again, this time from Charleston. Why did this former rebel later pledge fealty to the king?

I asked Austin, who shared the story passed down to him through his family. King George II died in 1760. He was succeeded by his grandson, George III, whose father, Frederick, Prince of Wales, had died in 1751 of a lung injury. Sometime after George III’s accession, John Stuart and his brother Francis sought a royal pardon from the new king. George III was looking for friends in the colonies, and was perhaps also influenced by John Stuart’s service in the 1759-61 Anglo-Cherokee war.  Both brothers were pardoned. This is why the Scottish rebel spent his later years as a loyal subject. What a fascinating twist!

Francis subsequently returned to Britain, but John remained in Charleston until the Revolution. He built his house between 1767 and 1772, by which time he was Colonel John Stuart.

It’s an obscure piece of history. The story was made real for us through visiting the home once owned by our friend’s ancestor, and supplemented with additional information. Charleston felt closer to Britain than does everyday life in New Jersey, because its early history is so vividly British. Our shared histories are why, for this Brit, America has so easily been home for 38 years and will be for the rest of my life.

I am descended overwhelmingly from English stock – my ancestors might even have been on the opposing side at Culloden, although Austin Sayre is too much of a gentleman to retain a grudge. Colonel John Stuart no doubt lamented the 1776 Declaration of Independence, but Austin and I agree that Britain’s loss was the world’s gain. We are a great country navigating a tough patch. We’ll make it to the other side. We always do.


Dividends on Pipeline Stocks Remain High

Markets finished the strongest quarter sine 1987 yesterday, led by the energy sector. The American Energy Independence Index, which comprises North America’s biggest pipeline stocks, is still down 29% for the year. Some investors are weary of years of underperformance against the broader market, combined with high volatility.

The volatility is largely a function of the investor base. In March, Closed End Funds (CEFs) that were forced to cut leverage at the lows added to the indiscriminate selling (see The Virus Infecting MLPs). Fund managers such as Kayne Anderson and Tortoise were to blame for not having the good sense to reduce risk earlier. The good news is that the consequent destruction of capital has rendered these CEFs less able to repeat, because they’re now a lot smaller.

Back in March, investors had many concerns about dividend sustainability. The top ten companies, which represent over half the sector’s $490BN market cap, all maintained payouts (Cheniere doesn’t pay a dividend). A recurring question we get from investors is, what’s the catalyst that will get stock prices higher? Putting aside higher crude oil, which usually coincides with improving sentiment, we believe the continued high dividend yields will draw in more buyers.

In Pipeline Cash Flows Will Still Double This Year, we explained how falling spending on new projects is driving cash flows higher. Covid-19 has produced few positives, but one of them is an acknowledgment by the energy industry that investing in new production and its supporting infrastructure needs to be cut. It may not be what executives want, but investors can find plenty to like about reduced spending.

In the next few weeks companies will report earnings and updated guidance. We don’t expect any of the biggest pipeline companies to cut dividends. Oneok (OKE) is probably the most at risk, but since they recently completed a secondary offering of common equity it would seem odd timing for them to cut.

.avia-image-container.av-30lsof-424b3364797c6533df391d86bdf5607a img.avia_image{ box-shadow:none; } .avia-image-container.av-30lsof-424b3364797c6533df391d86bdf5607a .av-image-caption-overlay-center{ color:#ffffff; }

These top ten companies have an average market cap of $27BN and an average yield of 9.4%, including Cheniere. Every three months pipeline stocks pay in dividends more than two years’ worth of interest on ten year treasury notes. Energy has been too volatile, but the improving free cash flow picture that is supporting dividends contrasts positively with others. We don’t know of another sector that is going to double its free cash flow this year.

Conversations with investors continue to reveal widespread caution about the overall market. The news on Covid-19 is rarely positive, and many find it difficult to maintain a constructive outlook against this backdrop. But Factset is still forecasting 2021 S&P500 earnings to be flat to 2019, fully recouping the Covid-19 drop in just one year. This, combined with low bond yields, continues to drive long term investors into stocks (see The Stock Market’s Heartless Optimism and Stocks Look Past The Recession and Growing Debt).

The dividend yield on the top ten pipeline stocks is a staggering five times that of the S&P500. As investors become increasingly comfortable that these are sustainable, yields will be driven down by new buying. Earnings reports in the coming weeks will provide an important opportunity for companies to provide confirmation.


Taking The Politics Out Of Covid-19

Covid-19 is probably the biggest political issue in America today. Liberals see a worsening situation in need of a slower return to normalcy requiring additional fiscal stimulus. Rising infections in Arizona, Texas and Florida provide plenty of quantitative support for this view. Conservatives reject this argument, presenting their own set of data. The restrictions on movement imposed by most states have offended those who perceive an unneeded loss of freedom – some even put face masks in this category, although masking up when in close contact with others seems a fairly trivial courtesy.

The sensational headlines continue to inspire fear, such as Newsweek’s “Texas’ Largest Hospital Reaches 100 Percent ICU Capacity”. The article goes on to add that 72% of that capacity is being taken up by non-Covid-19 patients, which nullifies the headline. This is why “liberal media” has become a term of disparagement.

.avia-image-container.av-2o2ascp-ad72ff2ade906c1c0c9f060392cbec5a img.avia_image{ box-shadow:none; } .avia-image-container.av-2o2ascp-ad72ff2ade906c1c0c9f060392cbec5a .av-image-caption-overlay-center{ color:#ffffff; }

There is data to support the view that the pandemic continues to moderate, and is far less fatal than originally feared.  A well-run hospital is always at 90-100% ICU capacity.  Hospitals can free up ICU beds  by canceling elective surgeries, and redesignate certain beds as ICUs, allowing them to operate at multiples of normal capacity.

Making an optimistic case shouldn’t imply that the proponent isn’t worried about getting sick. A conversation with a friend who was hospitalized for four days convinced me this virus is better off avoided.

.avia-image-container.av-289noh5-b6fb8a3ff2de2254db850a5667b1980b img.avia_image{ box-shadow:none; } .avia-image-container.av-289noh5-b6fb8a3ff2de2254db850a5667b1980b .av-image-caption-overlay-center{ color:#ffffff; }

Conservatives note that positive test results are going up, but that it’s due to increased testing. We’re finding more infections because we’re counting more. Liberals counter that the percentage of tests that are positive has edged up over 6%, which means it’s not all down to increased testing. However, this is still far below its peak of 21.8% in April. The criteria for testing have evolved, and riskier groups such as nursing home or prison populations will test higher. Because young people represent a bigger proportion of positive test results, some argue that they’re not following social distancing guidelines. While there are lots of photos to support that, hospitalization data continues to moderate, which suggests that people who are testing positive aren’t as sick. This is true even in Texas, where positive tests results are rising. Nationwide, hospitalizations and the fatality rate continue to fall. Doctor visits for flu-like symptoms are down.

The strongest argument that Covid-19 is unlikely to kill millions comes from estimates of the overall infection rate. U.S. fatalities are 120,000 (defined as people who died where Covid-19 was a contributing factor, although it’s now well known that other contributing factors such as obesity are usually present). Older people are far more vulnerable. CDC data shows that just 19% of fatalities are people under 65 years old.

.avia-image-container.av-1h2i6zt-f7e2ca7caf1933e64f3805fa1fc3e6b4 img.avia_image{ box-shadow:none; } .avia-image-container.av-1h2i6zt-f7e2ca7caf1933e64f3805fa1fc3e6b4 .av-image-caption-overlay-center{ color:#ffffff; }

.avia-image-container.av-1anz5k9-eb4149d27b933d39139d53ce6afa0978 img.avia_image{ box-shadow:none; } .avia-image-container.av-1anz5k9-eb4149d27b933d39139d53ce6afa0978 .av-image-caption-overlay-center{ color:#ffffff; }

We referenced a research paper on Wednesday (The infection fatality rate of COVID-19 inferred from seroprevalence data) that estimated an Infection Fatality Rate (IFR) for those younger than 70 years old of 0.04% (see Still Spreading, But Less Deadly). CDC data doesn’t precisely align, because they define age cohorts as 55-64 etc., rather than 60-70. But a reasonable estimate is that 30,000 people under 70 have died.

.avia-image-container.av-kbs7jd-a476abda9907649645d3abb347b4e3a4 img.avia_image{ box-shadow:none; } .avia-image-container.av-kbs7jd-a476abda9907649645d3abb347b4e3a4 .av-image-caption-overlay-center{ color:#ffffff; }

The 0.04% IFR implies that for every 10,000 people under 70 who are infected, four have died. This suggests that 75 million Americans have been infected (30,000 divided by 0.04%). It seems an impossibly high number – and yet, CDC Director Robert Redfield said on Thursday that, “5-8% of the American public has experienced infection, whether they recognized it or not.” This implies somewhere between 16 and 26 million Americans have been infected. With 2.2 million confirmed cases, that means for every positive Covid-19 test, another 7-11 people are infected but not bothered enough to visit a doctor. Redfield’s estimate is for the entire U.S. population, while the 0.04% IFR is for <70. But the two estimates are broadly consistent.

As with much of the data, it can confirm contrasting views. How the Virus Won reflects a Liberal view. Alternatively, for most of this year excess deaths have been below normal, partly because road fatalities are down (usually around 38K annually).  It’s possible that we’ve avoided more deaths from all other causes than Covid-19 has caused, although nobody knows who those fortunate souls are. One Covid-19 death is one too many, but policymakers are responsible for making judgments for society as a whole based on the best data available.


Still Spreading, But Less Deadly

Covid-19 cases are rising, especially in the south. Three weeks ago, my wife and I headed to South Carolina and beyond, where restrictions were limited and nobody we met knew anyone who had gotten sick (see Having a Better Pandemic in Charleston, SC). Masks were scarce, inside dining was permitted and it seemed like the old days. It was a glorious break from New Jersey with its opaque lockdown process and intermittent minor relaxations. However, rising infections in the south are causing some to suggest that people have been too relaxed in their efforts to avoid infection.

Covid-19 has become a political issue, so voting affiliation tends to color people’s attitudes. The New York Times recently posted two graphs that can be harnessed by each end of the political spectrum. The Liberal narrative focuses on the early under-counting of deaths because of insufficient testing (noted below the charts) and the uptick in infections. Covid-19 has killed even more people than we thought, and is spreading.

.avia-image-container.av-1p9gc1m-75bf370472e54ef63165933e8072266e img.avia_image{ box-shadow:none; } .avia-image-container.av-1p9gc1m-75bf370472e54ef63165933e8072266e .av-image-caption-overlay-center{ color:#ffffff; }

The Conservative perspective looks at the earlier understated number of deaths, which are now being more accurately counted because of more widespread testing, and sees an even faster decline in fatalities. Moreover, the increase in infections doesn’t seem to be arresting the decline. This suggests that we’re simply finding more infected people, because we’re testing more, and not that it’s getting worse. Treatments are improving too, leading to better outcomes.

Since it’s become a political issue, both sides can use the data to argue their case.

The median age of those testing positive is trending younger. In some counties in Texas, the majority of the positive tests are now people below thirty. Dr. David Persse, public health authority for the Houston Health Department, said, “It is my current theory that elder persons have become more vigilant in taking precautions,”

This sounds plausible, since older people are far more vulnerable to suffering serious illness or death from the virus. And the rising rate of infections among young people could reflect their confidence that, even if they contract the virus, their symptoms will most likely be mild or even non-existent (asymptomatic). We’re all growing weary of social distancing with its myriad restrictions on life as we knew it. Younger people seem to be increasingly willing to risk infection, since any negative consequences are likely to be mild.

.avia-image-container.av-rw85x6-59e1935423cee6d1e347383e944d26d3 img.avia_image{ box-shadow:none; } .avia-image-container.av-rw85x6-59e1935423cee6d1e347383e944d26d3 .av-image-caption-overlay-center{ color:#ffffff; }

This highlights the problem with requiring low-risk people to follow behavioral rules that protect others that are more vulnerable. It doesn’t seem much to ask in theory, but drinks at a bar with friends can easily seem a long overdue and justified proposition.

San Antonio mayor Ron Nirenberg also believes social distancing is being harmfully ignored, “While they may survive an illness, younger people are going to be stuck with a pretty hefty medical bill at the end of it.” That doesn’t sound like a compelling incentive – hence states like Texas are forced to reconsider how they impose social distancing.

But there’s a problem with this interpretation that age groups are adopting risk-based behavior. For Dr. Persse to be right about older people more successfully protecting themselves, you’d expect to see young people represent a bigger proportion of deaths and older people less. But this data is fairly stable. It looks to us that we are simply identifying more infected people because we’re testing more. Some may argue that deaths are a lagging indicator, but CDC data shows the same stable pattern for hospitalizations too. Although more young people are being counted as infected, the proportion of young people getting seriously ill or dying is not rising.

.avia-image-container.av-15i7wsa-63032d142a52d957971fb8b02d440446 img.avia_image{ box-shadow:none; } .avia-image-container.av-15i7wsa-63032d142a52d957971fb8b02d440446 .av-image-caption-overlay-center{ color:#ffffff; }

Early estimates of the Infection Fatality Rate (IFR) from Covid-19 were in the 3-4% range, based on data from China that assumed no asymptomatic spread. The New York Times article opens with 2.3 million+ cases and 120,345 deaths, implying an IFR as high as 5.2%. Projecting these IFRs across wide swathes of the U.S. population imply many millions of deaths, so it’s easy to see why governments took aggressive steps to protect people. But now we know that asymptomatic spread is high, which has greatly increased the infection rate. The fatality rate has correspondingly fallen as a result.

A recent paper from Stanford University (The infection fatality rate of COVID-19 inferred from seroprevalence data) has not yet been peer-reviewed, following recent practice to publish first with that caveat, in the interests of sharing analysis quickly. Serology tests estimate the infection rate across a population by looking for antibodies in blood tests. The Stanford paper uses data from 23 such studies, and arrives at an IFR of 0.04% for people under 70. This is why young Texans are drinking in bars and failing to follow social distancing. They probably take more risk getting home from the bar than when they’re inside.