Some Surprising Facts About Energy

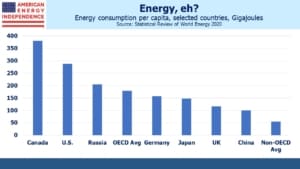
BP’s Statistical Review of World Energy offers many interesting and sometimes surprising insights about global energy. Start with our neighbors to the north. In a poll last year, two thirds of Canadians believed climate change is as serious an issue as Covid. Canada has a carbon tax, and lowering emissions has long been official government policy. However, adjusted for population Canada is an energy hog, consuming 380 Gigajoules (GJ) per person, compared with the U.S. at 288 GJ. Canada has the highest use of any OECD (i.e. rich) country, and two times the OCED average.

.avia-image-container.av-2lsbfdl-442c6769c55e519a187d1cc7f2ea2282 img.avia_image{ box-shadow:none; } .avia-image-container.av-2lsbfdl-442c6769c55e519a187d1cc7f2ea2282 .av-image-caption-overlay-center{ color:#ffffff; }

Moreover, 10.1% of Canada’s primary energy comes from renewables (including hydro), while the equivalent U.S. figure is 12.2%.

Germany’s per capita energy consumption is 157 GJ, less than half Canada’s. While Germany’s commitment to renewables has caused many problems (see Renewables: More Capacity, Less Utilization), using less energy lowers emissions.

Canada is better than the U.S. in coal consumption though (5.3% of primary energy production vs 11.3%), which explains why their per capita emissions are just below ours. Most Canadians would probably assume their country is a global leader on climate change, but this isn’t supported by the numbers.

.avia-image-container.av-26kgcih-6eb8949dd344b3d8fc5efa90ff8f87c5 img.avia_image{ box-shadow:none; } .avia-image-container.av-26kgcih-6eb8949dd344b3d8fc5efa90ff8f87c5 .av-image-caption-overlay-center{ color:#ffffff; }

Phasing out coal-burning power plants is a simple and direct way for most countries to reduce emissions. Replacing coal with natural gas has been a big source of America’s reduced emissions in recent years. U.S. coal consumption has been declining at over 5% p.a. for the past decade, faster than the OECD average of 3% (Canada has reduced coal consumption at a 6% CAGR). However, non-OECD countries have increased coal consumption at a 2% CAGR over this time, which is why global coal consumption unfortunately continues to increase.

Herein lies the conundrum for the simplistic world view of climate extremists. Developed countries are using less of the dirtiest fuel, while emerging countries are using more. The rich world wants to save the planet, while the emerging one wants rich world living standards. These conflicting goals are clearly visible in the numbers on global energy consumption.

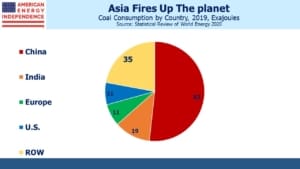
Coal is cheap, easily handled and ubiquitous. Because coal is found in so many parts of the world, coal trade is a much smaller portion of global consumption than for other fuels such as crude oil. OECD countries could decide to stop exporting coal, but they won’t. Australia exports 86% of its production.  China’s domestic production (79.8 Exajoules) approximately equals its consumption (81.7 Exajoules).

Australia possesses 14% of the world’s coal reserves. China has 13%. Should Australia leave most of theirs in the ground, slashing exports and pushing up prices on the dirtiest fossil fuel, thereby promoting switching to cleaner alternatives such as natural gas? Should China, consumer of half the world’s coal, leave theirs in the ground? The U.S. possesses 23% of the world’s coal, and will burn more of it to generate power this year and next than in 2020, according to the Energy Information Administration (see Emissions To Rise Under Democrats). Coal’s continued prevalence around the world mocks all the media hype over solar panels and windmills.

The U.S. is the world’s biggest producer of natural gas, with around a 23% share. The big opportunity is for Joe Biden to send John Kerry, Climate Czar, around the world promoting this as a far better choice than coal.

.avia-image-container.av-1jhb80p-97ea537e9f528966f85664fe731f3abe img.avia_image{ box-shadow:none; } .avia-image-container.av-1jhb80p-97ea537e9f528966f85664fe731f3abe .av-image-caption-overlay-center{ color:#ffffff; }

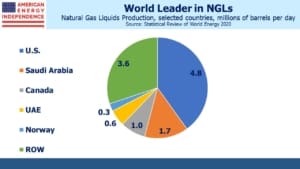
Less appreciated is our dominance in natural gas liquids (mostly ethane and propane) where we produce 40% of global output. Volumes grew at 9% p.a. over the past decade. Much of this is used by the petrochemical industry as feedstock for plastics. Propane exports are now above 1.2 million barrels per day, up over 10X in the past decade.

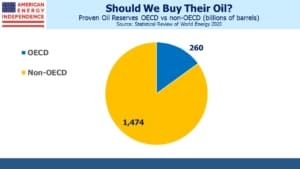
Climate change exposes many misalignments of interests. Developed countries are pursuing lower emissions, while developing countries like China and India favor economic growth to raise living standards, which is why their emissions are rising and offsetting reductions elsewhere. But reserves of crude oil lie predominantly in non-OECD countries too.

.avia-image-container.av-15wmmop-fa476fdd162867d398a39d421fd35ae8 img.avia_image{ box-shadow:none; } .avia-image-container.av-15wmmop-fa476fdd162867d398a39d421fd35ae8 .av-image-caption-overlay-center{ color:#ffffff; }

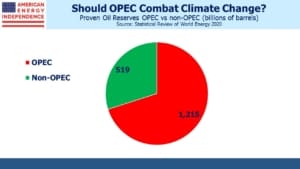
We’re told that we have a moral obligation to take the lead in reducing emissions, because poorer countries are less able to afford flood control and other mitigants. But 85% of the world’s proved oil reserves are in non-OECD countries. How much of this will be left in the ground? OPEC has 70% of the world’s crude reserves. Providing this oil to the rest of the world will create wealth that can be invested to protect against the effects of global warming. That may even be in some countries’ best interests.

If the U.S. trims crude consumption (which isn’t on the horizon) and imports less from Nigeria, a willing seller, are we really helping them? More broadly, the world’s poorest continent, Africa, produces 8% of the world’s oil. Environmental extremists haven’t yet reconciled a desire to reduce global demand for their output with those countries’ efforts to raise living standards by selling oil.

.avia-image-container.av-px2w6x-eaf7acaa619d544be3838fbaf86af29e img.avia_image{ box-shadow:none; } .avia-image-container.av-px2w6x-eaf7acaa619d544be3838fbaf86af29e .av-image-caption-overlay-center{ color:#ffffff; }

Misalignments of interest are everywhere. The rich world wants lower emissions, while emerging countries want rich world living standards, which require more energy. Rich countries seek to use less oil, which is predominantly owned and sold by poorer countries. OECD countries burn 20% of the world’s coal, leaving non-OECD, supposedly more vulnerable to climate change because they’re poorer, burning the other 80%. It should be no surprise the biggest contributors to reduced emissions have been economic: coal-to-gas switching because of cost, and the Covid recession.

Interestingly, Bloomberg’ NEF, which writes about the energy transition, expects electric vehicles to represent only 8% of the global auto fleet by 2030, with internal combustion engine sales still growing at 0.8% p.a. over the next decade. Rising incomes in developing countries will drive auto sales growth.

As long as environmental extremists reject nuclear power, you can be assured their concern for the world’s future isn’t genuine. Nuclear is clean, cheap, and the record shows proportionately safer than any other form of energy. If the extremists really believed the world has ten years left before irreversible catastrophe, they’d be embracing every solution including this one.

Japan’s consumption of nuclear power dropped to zero in 2014 following the 2011 Fukushima disaster. But they have pragmatically been restarting nuclear plants since then. Following power shortages this winter, Japan’s energy minister said nuclear was crucial to the country’s emission goals.

Solar panels, windmills and batteries will demand more of certain key minerals, of which U.S. reserves are negligible. We have no cobalt (over half is in Congo); 4% of the world’s lithium (Chile has over half) and 1% of the planet’s rare earth metal reserves (China has 35%). Having reached energy independence, policymakers will need to consider the geopolitical consequences of becoming dependent once more on other countries for key energy inputs.

.avia-image-container.av-3901ax-9146a3ea7a7cf5a0355fa60508302d44 img.avia_image{ box-shadow:none; } .avia-image-container.av-3901ax-9146a3ea7a7cf5a0355fa60508302d44 .av-image-caption-overlay-center{ color:#ffffff; }

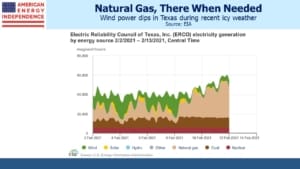
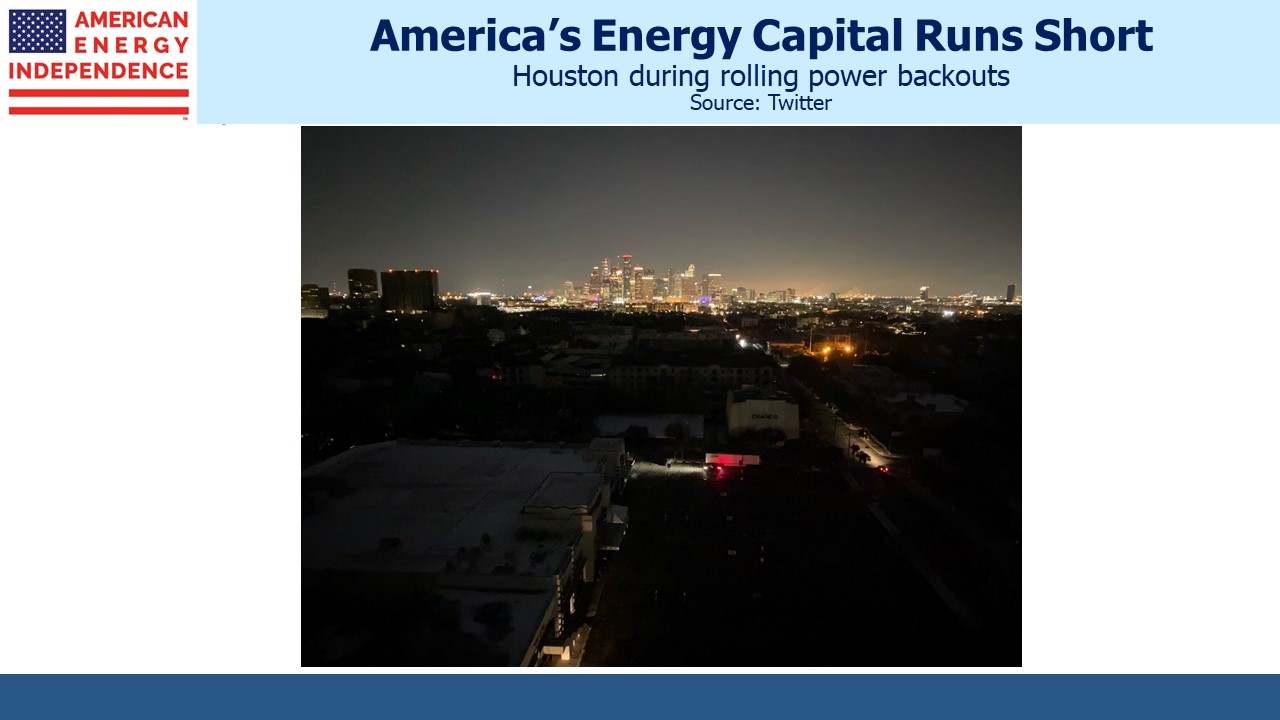
Recent cold weather in the U.S. has once again exposed the fickle nature of renewable power. Its intermittency means its often available but not always when you need it most. Texas expects to see record electricity demand over the President’s Day weekend. However, the chill has reduced windmills’ share of power generation from 42% to 8%, as ice has impeded their operations. Natural gas, always there to compensate for weather-related unreliability, tripled its contribution to Texans’ electricity needs.

.avia-image-container.av-j4ogd5-b17403237c36443c62e04abaa21edaee img.avia_image{ box-shadow:none; } .avia-image-container.av-j4ogd5-b17403237c36443c62e04abaa21edaee .av-image-caption-overlay-center{ color:#ffffff; }

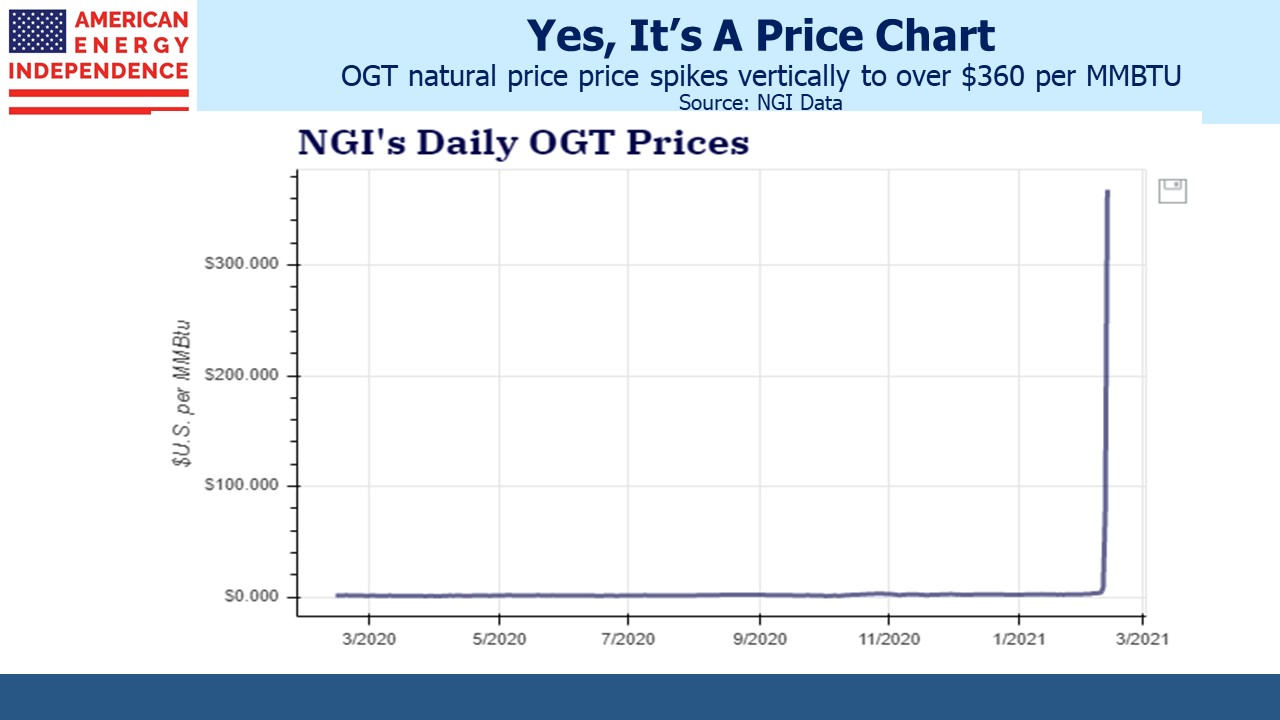
North Asian LNG prices exceeded $35 per Million BTUs (MMBTU) during a cold snap in  January (see Asia Leads Natural Gas Demand). On Friday, natural gas on the Oklahoma Gas Transmission line (OGT) touched $600 per MMBTU intra-day on Friday, settling at over $360. The Henry Hub benchmark closed at $2.91. Few fans of renewables will factor this cost in when promoting how “cheap” wind power is.

The world is using more of every kind of energy. China’s electricity consumption grew at 7% p.a. over the past decade. An energy transition that makes the most of natural gas is one that’s likely to succeed. A fund backed by Bill Gates recently backed start-up C-Zero, which aims to split natural gas (methane) into hydrogen, which it’ll burn, and solid carbon which it will bury. Since combusted hydrogen only produces heat and water, it’s zero-emission energy. There are many R&D efforts to use natural gas cleanly, often by capturing the emissions before they enter the atmosphere. The U.S. and our pipeline sector are well positioned for it.

We are invested in all the components of the American Energy Independence Index via the ETF that seeks to track its performance.


Modern Monetary Theory Goes Mainstream

Modern Monetary Theory (MMT) argues that because a government can never go bankrupt in its own currency, the only constraint on spending is inflation. Applied to the U.S., this justifies pandemic stimulus checks, spending on infrastructure and clean energy initiatives, expanded Obamacare and doubtless other initiatives too. Price tabs begin at $1TN nowadays. Stephanie Kelton’s book, The Deficit Myth: Modern Monetary Theory and the Birth of the People’s Economy is worth reading to better understand where this theory will take us. We reviewed it last November.

There are no votes left in fiscal discipline, and investors don’t seem too worried either. With 30 year yields at 2%, there’s little evidence that voters should be more concerned than the bond market.

Kelton was an advisor to Bernie Sanders, now head of the Senate Budget Committee. We are embarked on MMT – although even Kelton’s advocacy of fiscal profligacy recognizes the inflationary constraints of the government outspending the economy’s ability to deliver goods and services. She quaintly believes Congress should score spending plans based on their potential to cause higher inflation, as if election cycles had ceased to exist. No such concern burdens Biden’s $1.9TN proposed Covid relief plan.

Betting on higher inflation, and rising rates, has been a losing proposition for over thirty years. It would seem foolish to expect anything different now – except that making such a bet is extraordinarily cheap.

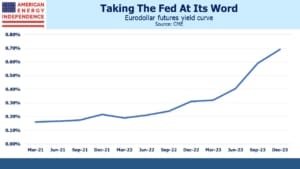
The eurodollar curve, which reflects market expectations for three month Libor, is very flat. It’s true Fed chair Powell has said the Fed plans to keep rates low for a long time, and is willing to see inflation move above 2%, compensating for periods when it’s been stubbornly below their desired average. The futures curve takes him at his word.

But the stage is set for the market to test this view. The kindling includes unprecedented fiscal stimulus, almost $5TN in money market funds, up $1TN in a year (some of which is entering the stock market via Robin Hood) and a probable burst of pent-up consumption once pandemic lockdowns are eased. This may all be easily absorbed by the economy – but many are watching carefully, and a couple of high CPI figures will confirm the worriers.

Commodity prices have been rising. Energy companies are more cautious with their investment plans, which is going to constrain supply in the future. Pipeline opponents have made new construction prohibitive. Investors in the sector like higher energy prices and lower growth capex, so are finding the Democrat agenda surprisingly appealing. These are encouraging circumstances for midstream energy infrastructure, up 11% so far this year.

.avia-image-container.av-1iqtfkw-923ca8f203628f704958d875196fb2f9 img.avia_image{ box-shadow:none; } .avia-image-container.av-1iqtfkw-923ca8f203628f704958d875196fb2f9 .av-image-caption-overlay-center{ color:#ffffff; }

Bond yields are slowly rising to reflect inflation risks, but remain uninvestably low. Sovereign debt ceased offering real returns (i.e. above inflation) years ago. Those days may never come back – MMT advocates will eagerly grasp this vindication of their policies.

December 2022 eurodollar futures yield 0.30%, just 0.10% above today’s three month Libor with 22 months to go and reflecting equanimity about the possibility of higher rates over that time frame. A short position will lose roughly half a basis point per month — this is the cost of negative carry. If the market develops even the slightest fear that rates may rise, a 25 or 50 bps move in eurodollar futures is likely. The Fed probably will remain on hold – but there’s little to be made betting with them, and little cost in betting against.

.avia-image-container.av-n7m8g0-574e88d1400f776a2a0e8cb0c46b998e img.avia_image{ box-shadow:none; } .avia-image-container.av-n7m8g0-574e88d1400f776a2a0e8cb0c46b998e .av-image-caption-overlay-center{ color:#ffffff; }

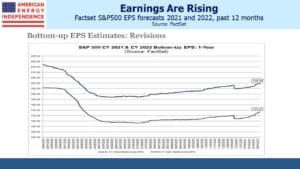
Stocks remain modestly attractive, but that is dependent on bond yields. Factset 2021 and 2022 earnings forecasts for the S&P500 are moving steadily higher, albeit still not back to pre-pandemic levels. But 2021 forecast S&P500 EPS of $173 per share is nonetheless $10 ahead of pre-pandemic 2019. Covid has changed millions of lifestyles for the better and created big winners and losers among businesses, but history will show a one year dip in public company profits.

.avia-image-container.av-v7065c-13dce99c57648d3d3522710a738b9311 img.avia_image{ box-shadow:none; } .avia-image-container.av-v7065c-13dce99c57648d3d3522710a738b9311 .av-image-caption-overlay-center{ color:#ffffff; }

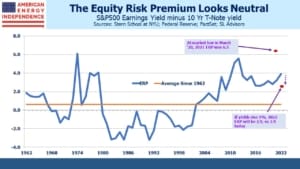
Energy companies dominate the list of 1Q21 upward revisions to earnings. The Equity Risk Premium (ERP), the difference between the S&P500 earnings yield and ten year treasuries, is supportive. However, if long term interest rates were to rise, say, 1% stocks would be less alluring.

The goal of MMT is to push the edge of the envelope. Both political parties have discovered that increased deficits carry no penalty. Now that we’ve informally adopted MMT, higher inflation one day is assured. We just don’t know when. But Federal government spending policies reflect an enthusiastic pursuit.

We are invested in all the components of the American Energy Independence Index via the ETF that seeks to track its performance.



Using More Energy, Everywhere

Last week the U.S. Energy Information Administration (EIA) released their 2021 Annual Energy Outlook (AEO). It is produced by their Bipartisan Policy Center, and presidential elections aren’t supposed to affect their work. It isn’t a policy document but is intended to make forecasts based on current policies and known technology.

.avia-image-container.av-2x4sxho-847318ffbd1f1def814cc515464fbad1 img.avia_image{ box-shadow:none; } .avia-image-container.av-2x4sxho-847318ffbd1f1def814cc515464fbad1 .av-image-caption-overlay-center{ color:#ffffff; }

Past AEOs are taken down from their website, which is a pity because it can be fun comparing current forecasts with prior ones. Fortunately, we save it every year, and the comparisons are interesting.

.avia-image-container.av-93xwwc-e2bca9c50da20324e7b9bcfe47b1ae74 img.avia_image{ box-shadow:none; } .avia-image-container.av-93xwwc-e2bca9c50da20324e7b9bcfe47b1ae74 .av-image-caption-overlay-center{ color:#ffffff; }

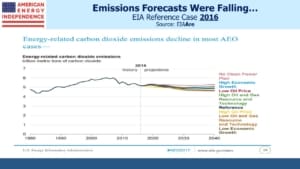
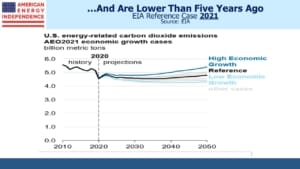
Our initial thought in watching the webinar that launched their new release was that they see a very different energy future than the new Administration, one that still relies primarily on fossil fuels. Joe Biden ran on a platform of getting the U.S. to net zero greenhouse gas emissions by 2050. The AEO projects a modest drop over the next decade before growth resumes. Energy-related CO2 emissions are projected to remain below 5 gigatons by 2050, roughly unchanged over the next three decades but clearly not zero. Nonetheless, it’s a more optimistic than the 2016 AEO. Since then, switching from coal to natural gas for power generation and the Covid-recession have brought emissions down from above 5 gigatons back then. Changed policies and new technologies will be needed to alter that projection.

.avia-image-container.av-1xdd6z0-aa76ec758a6f921359e86bba19faa37a img.avia_image{ box-shadow:none; } .avia-image-container.av-1xdd6z0-aa76ec758a6f921359e86bba19faa37a .av-image-caption-overlay-center{ color:#ffffff; }

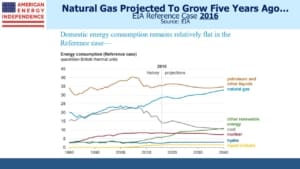
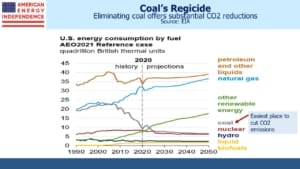
The 2021 AEO projects faster growth in renewables than five years ago, but oil and gas consumption still dominate. In fact, growth in natural gas consumption is expected to track renewables closely, with both gaining market share. Coal has seen a big downward revision since 2016 but will continue to provide more energy than nuclear. If we can’t flip that around over three decades, it will represent a significant missed opportunity.

.avia-image-container.av-63n5yk-ea88ce6c2c6d02fb909f0e1a3292db6d img.avia_image{ box-shadow:none; } .avia-image-container.av-63n5yk-ea88ce6c2c6d02fb909f0e1a3292db6d .av-image-caption-overlay-center{ color:#ffffff; }

One controversial element of the 2021 AEO concerns consumption of petroleum and other liquids. By contrast with AEO 2016, this is now expected to grow, in apparent defiance of everything the Administration and many others have to say. The explanation is greater industrial use of liquified petroleum gas (LPG) which is mostly propane and butane. The U.S. produces 40% of the world’s Natural Gas Liquids (NGLs), almost three times the next biggest (Saudi Arabia, at 14%). NGLs, which include propane and butane and are usually separated from “wet” gas, are one of the Shale Revolution’s big successes. In recent years, increasing domestic production has spurred investment in domestic petrochemical facilities and driven greater exports.

.avia-image-container.av-ly2kng-8825573801fc7cde275ef3e47a57cec3 img.avia_image{ box-shadow:none; } .avia-image-container.av-ly2kng-8825573801fc7cde275ef3e47a57cec3 .av-image-caption-overlay-center{ color:#ffffff; }

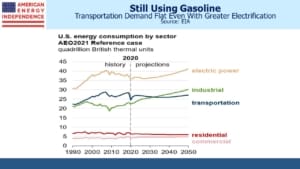
But even gasoline consumption is expected to remain close to current levels over the next thirty years. That it won’t grow reflects increased electric vehicle penetration as well as continuing efficiencies in traditional internal combustion engines. GM recently announced plans to only sell zero-emission cars and trucks by 2035. The incongruity between AEO 2021 and GM’s investment plans lies in policy expectations. GM is preparing for a world of government-imposed constraints on gas-powered automobiles, whereas the AEO 2021 Reference Case assumes unchanged policies. In 30 years we can look back and see which one of these was way off

.avia-image-container.av-4bzxe4-bc72be0b537bebd8085e145cd6e023ba img.avia_image{ box-shadow:none; } .avia-image-container.av-4bzxe4-bc72be0b537bebd8085e145cd6e023ba .av-image-caption-overlay-center{ color:#ffffff; }

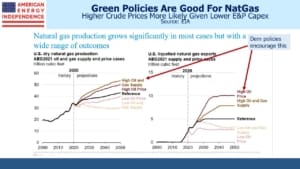
The other big change is in natural gas exports. In 2016 the EIA expected the U.S. to be a net importer of natural gas, while five years later that has reversed. An interesting chart which is more relevant today shows high oil prices stimulating increased natural gas production, because of substitution. The continued decline in capex for new oil production across the industry makes supply-constrained higher oil prices more likely than in the past. Previous AEOs have long considered this link, but it now is a higher probability. Democrat policies are designed to promote higher energy prices, an unintended benefit for energy investors.

The 2021 Annual Energy Outlook offers support to energy investors convinced that today’s weak security prices reflect a far too pessimistic outlook. In fact, we can’t think of a serious forecast of natural gas demand that doesn’t project steady growth for decades. It may not be what progressive Democrats would like to see, but since global energy demand is going to keep growing, we’ll need more of every energy source.

We are invested in all the components of the American Energy Independence Index via the ETF that seeks to track its performance.


GameStop Overhauls The Hedge Fund Business

The impact of GameStop (GME) will resonate far beyond a few short-selling hedge funds. It’s a rare breed of manager that runs exclusively or mostly short positions. Behind the forensic financial analysis that’s required lies a deep skepticism of company executives. They see a dark side to human behavior lurking out of sight to most of us. Short sellers often believe they’ve uncovered a fraud – they’re not just looking for a quick 10-20% gain, they think the stock is a zero. One short seller was so disgusted at the failure of men’s clothier Joseph A Banks to collapse that he abandoned the industry for a few years to rear chickens (see A Hedge Fund Manager Finds More to Like in Farming).

.avia-image-container.av-rsh5tq-28848b9b6878fff2eba5e1b1e8ee2d00 img.avia_image{ box-shadow:none; } .avia-image-container.av-rsh5tq-28848b9b6878fff2eba5e1b1e8ee2d00 .av-image-caption-overlay-center{ color:#ffffff; }

Unshakeable conviction and thick skin absorb the blows of massed opposing forces, from sell-side research, management and other investors to, now, social media sites.

Shorting stocks isn’t limited to specialist funds such a Kynikos, run by Jim Chanos. The original hedge fund created by A. W. Jones was a long/short fund. It sought to neutralize its exposure to market moves by balancing long and short positions. The objectives of hedge funds have evolved over the years. They were originally described as Absolute Return funds — reliably positive, inspiring AR Magazine, which has since folded into Institutional Investor. The 2008 financial crisis showed hedge funds could lose money like anyone else, so marketing shifted to Relative Returns, except those were relatively poor (see Hedge Funds: Still Fleecing Investors with Expensive Mediocrity). In recent years they’ve settled on delivering uncorrelated returns, which Melvin Capital provided so spectacularly last month (reportedly down 53%).

Whatever the description, hedge funds are supposed to offer something different. For a broad array of strategies, that includes carrying some short positions.

Shorting stocks is hard. Almost everyone else involved with the company is against you. Investors in the stock, research analysts and the company itself all regard the short’s failure as vindication of their work. In Germany, the securities regulator was so incensed at negative press coverage of Wirecard that it sued two Financial Times journalists. The lawsuit was only dropped after Wirecard itself confirmed the €1.9BN hole in its balance sheet.

The risk in shorting is asymmetric – as the price falls, your position size shrinks as well. If it rises, your losses are theoretically unlimited, and can reach unfathomable depths as we just saw.

Hedge fund managers regularly describe the difficulty in adding value from short positions. Betting against a company certainly requires more care and attention than other positions. I’ve always thought managers would often be better off simply focusing on long ideas and hedging out the market risk with S&P futures. By focusing their often-considerable analytical abilities on long positions, maybe they’d do better.

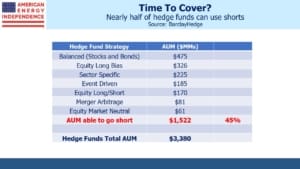
Of $3.4TN in hedge fund assets under management, 45% can be estimated as using short positions in some form. Scraping data from social media sites to identify the crowd’s next victim will quickly become another tool. But shorts just became more risky than previously imagined, and this will have consequences.

A year ago, GME was under $4. A short-seller might have considered a doubling, or perhaps even a quadrupling in price as a plausible worst outcome, and size the position accordingly. For GME, this would have been inadequate by an order of magnitude, since it rose over 100X. The standard definition of “how bad can it get?” just changed.

The social media crowd is reveling in its newfound power. They believe they have launched a form of high-tech populism taking on what they regard as the financial establishment, although hedge fund managers used to think that was their role. We continue to scour chatrooms hopefully for signs they’ll corner the pipeline sector. It must be ripe for their exploitation.

Hedge fund managers will adapt. They’ll have smaller positions, will use options to control risk and will follow DeepF***ingValue on r/WallStreetBets. But shorting stocks has changed forever. Finding a fraud won’t make as much money, because of tighter position limits. Out of the money option volatility will be high, as the value of tail-risk protection rises. Borrowing stock to short may become harder.

Hedge fund investors will add the Melvin question to their due diligence questionnaire. Prime brokers will tighten their financing requirements for most individual short positions. Nobody wants a surprise like this. Being associated with a subsequent GME-like debacle will abbreviate careers.  So everyone will avoid it. There will be less shorting of stocks.

This will cast a chill over the hedge fund business. Many of the smartest people in finance run hedge funds, and they’ll continue to prosper personally. But hedge fund returns, which any casual observer can see have mostly failed to justify their fees for almost two decades, now face an additional headwind.

We are invested in all the components of the American Energy Independence Index via the ETF that seeks to track its performance.


Asia Leads Natural Gas Demand

Last week John Kerry, Climate Czar, warned that natural gas pipeline assets could become “stranded assets” within 30 years. Democrat attitudes toward fossil fuels remind one of St. Augustine (“Lord, make me chaste—but not yet.”). Three decades of debauchery before celibacy shows self-discipline, under the circumstances. Since Biden now owns U.S. climate change policy, indulging the fantasies of climate extremists must be balanced with keeping the lights on.

Fortunately, bond investors’ optimism extends farther still. Transco, a wholly owned subsidiary of Williams Companies (WMB) and operator of the eponymous natural gas pipeline network, has numerous long-term bonds outstanding with yields of 3-3.5%. Transco 3.95% 5/2050 bonds trade at 3.28%, within 1.5% of the U.S. 30 year bond.

Investors and management of natural gas assets recognize that they offer the fastest path to lowering emissions, not solar panels and windmills. Power generation from renewables will grow to be sure, but with global energy consumption expected to increase by half through 2050, every energy source will grow.

.avia-image-container.av-mxwv8p-fbeeb6301e6f72bf8d5b042300604bd1 img.avia_image{ box-shadow:none; } .avia-image-container.av-mxwv8p-fbeeb6301e6f72bf8d5b042300604bd1 .av-image-caption-overlay-center{ color:#ffffff; }

Last week we chatted with senior management from Tellurian (TELL), to discuss their plans for exporting Liquified Natural Gas (LNG). Reaching a Final Investment Decision (FID) to construct their Driftwood export facility in Louisiana relies on getting enough customers signed up. Japan is the world’s biggest importer of LNG, with China second. Asia is almost three quarters of global LNG trade, therefore critical to global trends.

News in recent months has been encouraging. Extended cold weather in north east Asia drove spot LNG prices to over $35 per MCF, more than 10X the U.S. benchmark at Henry Hub. Prices have eased since, but the January 2022 JNK futures trade at $8, a sufficient premium to U.S. prices to cover transportation costs.

TELL management sees LNG as critical to emerging Asia, as it struggles to reconcile the desire for rising living standards with controlling emissions. China intends to increase its emissions for at least the next decade, notwithstanding their vague commitment to get to zero by 2050.

.avia-image-container.av-1kf2hyh-efa19ef6270b09e76355c3510993f1fd img.avia_image{ box-shadow:none; } .avia-image-container.av-1kf2hyh-efa19ef6270b09e76355c3510993f1fd .av-image-caption-overlay-center{ color:#ffffff; }

Last year Beijing temporarily relaxed some of the constraints on coal that had caused some switching to natural gas, to boost growth during the pandemic. But TELL drew our attention to last year’s creation of PipeChina, a $32BN entity created from Sinopec and PetroChina to own the country’s trunk pipeline network for natural gas. The intention is to deregulate LNG imports, creating more competition and increased sensitivity to demand.

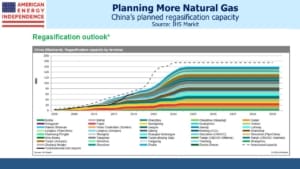
There is enormous potential for China to use more natural gas, which provides less than 10% of their primary energy needs and only 3.1% of power generation as of 2019 (according to IHS Markit). Reducing China’s current and projected coal consumption must be the focus of any climate change discussion. The world should hope that China’s natural gas pipelines are heavily used, and for much longer than the three decades our globe-trotting climate czar envisages for similar U.S. assets. Regasification capacity, a measure of China’s ability to import LNG, is going to almost double over the next five years.

In 2019, China imported 62.5 million tons of LNG, equivalent to 8 Billion Cubic Feet per Day (BCF/D) of natural gas. The U.S. is currently exporting around 11 BCF/D of LNG.

Check out What’s Cool About LNG?, a fascinating six-minute video that shows how natural gas burns with less carbon output than a candle, and how a lit cigarette isn’t hot enough to ignite LNG.

.avia-image-container.av-11f3q7d-96654c35eeb349807018080f29ab0db8 img.avia_image{ box-shadow:none; } .avia-image-container.av-11f3q7d-96654c35eeb349807018080f29ab0db8 .av-image-caption-overlay-center{ color:#ffffff; }

India is another growth market, although developing domestic long haul natural gas pipelines has been slowed by regulatory uncertainty and land rights issues. Potential LNG importers must look enviously at China’s relentless prioritization of national interest over individual rights.

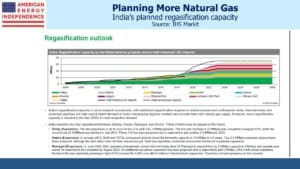
Nonetheless, Indian LNG imports more than doubled over the past decade, with Qatar shipping the most. Regasification capacity is set to grow significantly over the next five years, albeit not as fast as China. With domestic production falling, LNG imports are likely to provide more than half India’s natural gas for the foreseeable future.

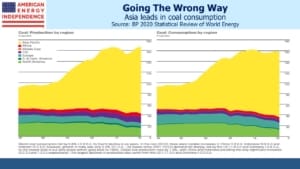
Coal consumption is moving strongly in the wrong direction, fueled by non-OCED demand in Asia. In John Kerry’s Augustine moments, he’ll realize that the world needs natural gas to get us off coal. The natural gas industry understands that too.

We are invested in all the components of the American Energy Independence Index via the ETF that seeks to track its performance.


Williams Companies Sees A Climate Change Winner In Natural Gas

Last week Williams Companies (WMB) held their first ever ESG Event. As might be expected, the most interesting parts were on the “E” (Environmental). It’s hard to find much original to say on Social issues, and Governance should simply mean following industry best practice.

WMB is in a position to be a big winner from policies to combat climate change. If pragmatists seize control from renewable evangelists, which they should now that Democrats own the issue, they’ll realize that measurable progress on reducing emissions will come from natural gas. Rising CO2 emissions over the next couple of years will be no surprise after almost a year of lockdowns. But the deteriorating mix of power generation (i.e. more coal and negligible increase in clean energy) mean that President Biden isn’t assured of overseeing lower emissions during his current term.

There may be valid reasons but failing to reduce emissions below their prevailing level at Trump’s exit will represent failure. Gains in natural gas over coal for power generation are set to reverse this year, because of higher prices for the former (see Emissions To Rise Under Democrats). Democrat policies to inhibit oil and gas production are already having an impact. Spending on new production continues to fall.

WMB moves 30% of America’s natural gas, much of it via their extensive Transco pipeline that runs from Texas to NY. Originally built to supply natural gas from the southeast to New York, in recent years it’s switched directions in places. Some natural gas now moves south, from the Marcellus Shale to Cheniere’s LNG export facilities in Texas and Louisiana.

.avia-image-container.av-ysqit4-6411e4fa5b45c3ee17ab3df3500d3371 img.avia_image{ box-shadow:none; } .avia-image-container.av-ysqit4-6411e4fa5b45c3ee17ab3df3500d3371 .av-image-caption-overlay-center{ color:#ffffff; }

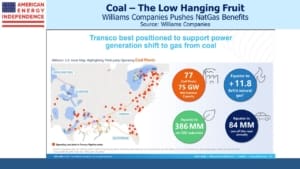
WMB has identified 77 coal-burning power plants that are within Transco’s “footprint”. That is, they operate in a state through which Transco passes, and therefore can be supplied with natural gas should they be converted. Converting them all would lower US energy-related CO2 emissions by over 8%.

It must be the easiest 8% reduction available over the next few years, if the Administration can find a way to do it. WMB CEO Alan Armstrong clearly grasps the opportunity.

While America stands to benefit from shutting down coal plants, the world needs China to head in this direction. China burns half the world’s coal. They have four times the power output from such plants as the U.S. Much of the world’s planned investment in new coal burning power plants is in China. The Administration is already publicly calling for China to toughen its targets on greenhouse emissions, which are scheduled to keep rising for at least another decade.

.avia-image-container.av-qj62ns-710d8c3f20ede57ab82dcfb6bcc16558 img.avia_image{ box-shadow:none; } .avia-image-container.av-qj62ns-710d8c3f20ede57ab82dcfb6bcc16558 .av-image-caption-overlay-center{ color:#ffffff; }

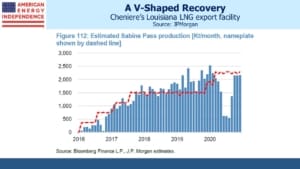
It’s no coincidence that 68% of global trade in Liquified Natural gas (LNG) is in Asia. Last year a sudden drop in demand caused shipments to plunge from Cheniere’s Sabine Pass LNG facility in Louisiana. But helped by a cold winter, European and Asian demand has driven shipments to a new record. U.S. LNG exports last year were up 10% on 2019, a result that seem improbably six months ago.

.avia-image-container.av-1gsza9k-e45a5295eeb9d0bb15bd79fbc5c0abba img.avia_image{ box-shadow:none; } .avia-image-container.av-1gsza9k-e45a5295eeb9d0bb15bd79fbc5c0abba .av-image-caption-overlay-center{ color:#ffffff; }

China sources almost half of its LNG imports from Australia, and the rest from other Asian countries and Qatar, because shipping costs are significant. American natural gas prices have been rising but remain among the lowest in the world. The EIA expects higher prices to drive increased production next year.

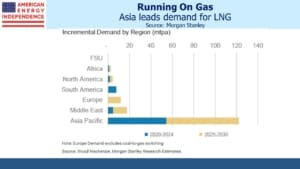
Even though U.S. LNG exports to China are incopnsequential, our LNG exports will still benefit. The recent price spike in Asian prices has slashed European LNG imports – because shipments have been diverted to Asia. Consequently, Morgan Stanley recently raised its 2021 price for European natural gas by 35% (from $4.30 per MCF to $5.80). They expect global trade in LNG to grow at a 4% compound annual rate through 2030, with Asia driving over 80% of this increased demand and rising to 73% of the global market.

The U.S. opportunity in natural gas is to substitute it for coal. The global opportunity is to take advantage of low U.S. prices to meet growing Asian demand. WMB is well positioned to be part of both solutions.

We are invested in all the components of the American Energy Independence Index via the ETF that seeks to track its performance.


Emissions To Rise Under Democrats

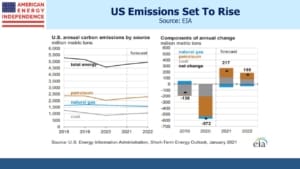
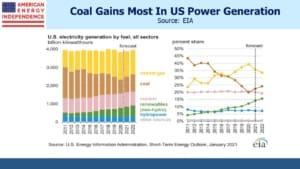
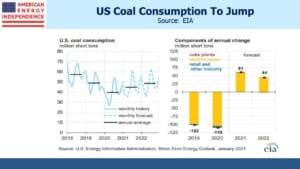
By the end of President Biden’s first year in office, his administration’s report card on climate change will offer some uncomfortable facts. Natural gas, after taking market share from coal for power generation under the Trump administration, will see those gains reversed. In the U.S. Energy Information Administration’s (EIA) most recent Short Term Energy Outlook, they forecast that U.S. coal consumption will increase its share of power generation from 20% last year to 24% by next. The biggest source of falling CO2 emissions in the U.S. has been the reduction in burning coal, a trend that pre-dated the last administration but continued through it.

.avia-image-container.av-1hwxgxu-2d61e1c714ddd4d02f0cd6fa79eb19d4 img.avia_image{ box-shadow:none; } .avia-image-container.av-1hwxgxu-2d61e1c714ddd4d02f0cd6fa79eb19d4 .av-image-caption-overlay-center{ color:#ffffff; }

President Biden will no more accept the blame for this unhappy shift than Trump could claim credit for the positive trend that preceded it. But policy changes are partly the cause.

.avia-image-container.av-2pl4u3m-02fbf651e43a4de3f02a6b8fa11983e8 img.avia_image{ box-shadow:none; } .avia-image-container.av-2pl4u3m-02fbf651e43a4de3f02a6b8fa11983e8 .av-image-caption-overlay-center{ color:#ffffff; }

Natural gas consumption grew over the past several years because it was cheap. Trump’s pro-energy stance stimulated oil and gas production, much to the chagrin of investors who would have benefited from less. Prices have been rising recently, and although there are many global macro factors at play, the chilling effect of Democrat policies on new fossil fuel production is playing a part.

.avia-image-container.av-7b5y82-d13d6bdfd27da3624059d60d31069802 img.avia_image{ box-shadow:none; } .avia-image-container.av-7b5y82-d13d6bdfd27da3624059d60d31069802 .av-image-caption-overlay-center{ color:#ffffff; }

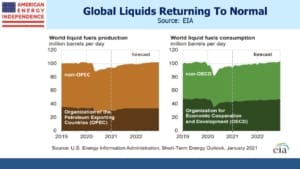
Over the next two years, world liquids fuel consumption is expected to recoup the Covid slump, so that 2022 will look much like 2019. The same is true in the U.S.

.avia-image-container.av-terhwi-f2be9fdf1271d12ebf2e5f3c49ad3bd4 img.avia_image{ box-shadow:none; } .avia-image-container.av-terhwi-f2be9fdf1271d12ebf2e5f3c49ad3bd4 .av-image-caption-overlay-center{ color:#ffffff; }

Optimists will point to the growth in solar and wind energy, whose share of U.S. electricity production is set to increase, from 12% last year to 16% in 2022. However, nuclear power will lose 2% (from 21% to 19%), as continued opposition which includes climate extremists reduces one source of zero-emission power. Add in a 1% drop in hydropower, and clean energy is set to gain 1% market share over the next two years – hardly dramatic.

.avia-image-container.av-10k7bvm-e3ce90e3c6e120ed520a60e4714922f3 img.avia_image{ box-shadow:none; } .avia-image-container.av-10k7bvm-e3ce90e3c6e120ed520a60e4714922f3 .av-image-caption-overlay-center{ color:#ffffff; }

As a result, U.S. CO2 emissions are going to begin rising again. By the middle of Biden’s term, there will be little to point to in terms of actual U.S. results on climate change. The entire story will be one of hope. It’ll be hard to lecture China on the need to curb their emissions, which are forecast to keep rising along with rising living standards.

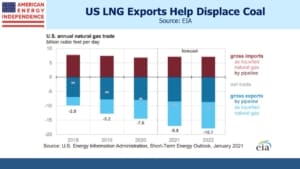
Fortunately, U.S. natural gas exports are expected to keep rising. Over the next couple of years it looks as if America’s biggest contribution to curbing global emissions will be enabling the foreign buyers of our natural gas to use less coal than they otherwise would.

It’s hard to pivot towards cleaner energy. The two places where public policy has been aggressive (Germany and California) have little to emulate. Increased coal consumption to counter renewables’ intermittency (Germany), unreliability (California) and high prices (both) aren’t an appealing destination for the rest of us.

The politics of this will be fascinating. Climate extremists are likely to be frustrated at the lack of results. The Democrats’ razor-thin margin in the Senate make sweeping policy changes unlikely.

Reducing coal consumption is the low hanging fruit of reducing emissions. It not only generates twice the CO2 emissions of natural gas when burned, but also pollutes locally with fine particulate matter and nasty chemicals such as mercury. Executive actions via the Environmental Protection Agency and aggressive enforcement of existing environmental laws could increase the cost of coal, offering the new administration some chance of improved results.

Trump won three of the five biggest coal producing states (Wyoming, West Virginia and Kentucky) with Pennsylvania and Illinois voting for Biden. Democrats might therefore conclude that they have little to lose by taking on the coal industry, a move that would be easily supported by the science. It’ll be a tricky decision though, because they’d risk losing the other two.

The biggest weakness in policies to combat climate change is their reliance on supply constraints. Billions of people use fossil fuels, and we are all contributing to emissions to varying degrees. But rather than raising prices directly on the consumption of energy, policies more often seek to manage sources of supply. Public support to reduce emissions is shallow – if people believed the planet was truly at risk, nuclear energy would be an obvious solution. We’d have a carbon tax in the U.S., but that’s a political non-starter. So policy focuses on supply, because the impact is less visible.

The logical progression is to engineer higher coal prices. The natural winner would be natural gas, the only energy source with the capacity to quickly compensate for, say, a 5% drop in coal production.

Democrats own the U.S. response to climate change for the next four years. Higher energy prices are part of their strategy. It’s what energy investors would like too.

We are invested in all the components of the American Energy Independence Index via the ETF that seeks to track its performance.


Warnings Of Inflation Grow

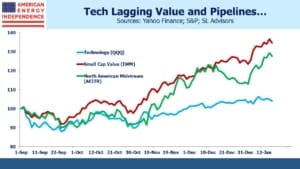
In early November when Pfizer’s vaccine announcement triggered a strong rally, technology stocks lagged small cap value. Having been out of favor for years, the Russell 2000 sprang to life, drawing in buyers at the expense of tech.

.avia-image-container.av-2dyeoc2-12ff98df0ddfe96213537e6d3015a5a2 img.avia_image{ box-shadow:none; } .avia-image-container.av-2dyeoc2-12ff98df0ddfe96213537e6d3015a5a2 .av-image-caption-overlay-center{ color:#ffffff; }

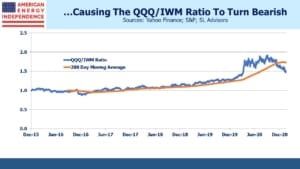
The relative movement of tech to value, defined as the ratio of the Nasdaq and Russell 2000 indices, crossed through its two hundred day moving average. This signaled an end to tech’s previous ascendancy, at least for those who follow charts.

.avia-image-container.av-26dhkmq-2aaa69406da2d948489ff2a247eca7c4 img.avia_image{ box-shadow:none; } .avia-image-container.av-26dhkmq-2aaa69406da2d948489ff2a247eca7c4 .av-image-caption-overlay-center{ color:#ffffff; }

The pattern has continued since, with the ratio now solidly below its two hundred day. It looks like a new trend has begun. Pipeline stocks are beginning to show up on recommended lists. US News included Kinder Morgan (KMI) among their ‘7 Best Value Stocks to Buy for 2021.’ Barrons regularly pushes midstream energy infrastructure for yield. The components of the American Energy Independence Index, undoubtedly a value play, still yield over 8% on a market cap weighted basis even after rallying 12% in January.

.avia-image-container.av-1qkq6fm-d016ede752db325490d6f568c750af1c img.avia_image{ box-shadow:none; } .avia-image-container.av-1qkq6fm-d016ede752db325490d6f568c750af1c .av-image-caption-overlay-center{ color:#ffffff; }

Coincident with this shift in leadership, signs of inflation are appearing. Liquefied Natural Gas (LNG) prices have soared in Asia because of unusually cold weather. JNK LNG, the regional benchmark, recently traded up eightfold from last April with some Asia-bound shipments trading at 10X the price of the US Henry Hub benchmark last week. This is great news US LNG exporters.

.avia-image-container.av-10lr21e-4cf3e81ebd471cd20a82ec209343c157 img.avia_image{ box-shadow:none; } .avia-image-container.av-10lr21e-4cf3e81ebd471cd20a82ec209343c157 .av-image-caption-overlay-center{ color:#ffffff; }

The JNK squeeze is dramatic but temporary. However, other commodities have also been rising sharply. Crude oil has firmed up on hopes that vaccinations will allow a return to our former lives by summer. China’s sharp economic rebound has more than doubled the price they pay for iron ore compared with March. Even rice has risen over a third since October.  Prices for hot rolled steel have doubled. Inflation is increasingly a conversation topic among investors, and is drawing more media attention such as Higher inflation is coming and it will hit bondholders in yesterday’s FT.

.avia-image-container.av-x0wuqa-cadf1fa78f247f56f77eb6c0bf369dd9 img.avia_image{ box-shadow:none; } .avia-image-container.av-x0wuqa-cadf1fa78f247f56f77eb6c0bf369dd9 .av-image-caption-overlay-center{ color:#ffffff; }

Gold has been weakening in recent months, but Bitcoin has soared, perhaps becoming the refuge of choice for some fleeing fiat money.

The Federal government is doing its best to cause bond investors sleepless nights. This week incoming President Biden will press Congress to approve an additional $1.9TN in pandemic relief, our third package in a year. The Federal Reserve is actively seeking inflation above its 2% target, to compensate for years of undershooting.

If inflation doesn’t rise, it won’t be because we didn’t try. It’ll reflect the continuation of disinflationary forces that have constrained it for so long.

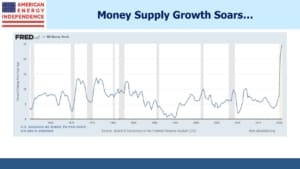
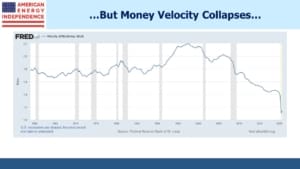
Money Supply as measured by M2 is growing at the fastest rate since records exist. However, nominal GDP is not similarly rising, since money velocity is plunging to new depths. During the 2008-09 financial crisis, when the Fed’s Quantitative Easing led to M2 growth less than half as strong as it is now, some feared a resurgence of inflation. However, the extra liquidity sat in bank reserves and was only slowly recycled into the economy.

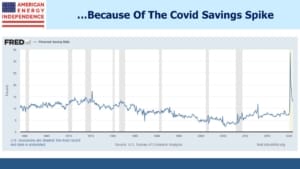
The difference today is that money market funds for institutional and retail accounts are $4.3TN, far higher than a year ago. The US savings rate soared above 30% last April, and although it’s been falling since then it remains historically high.  By contrast with 2008-09, these balances are readily available to fund consumption.

There is substantial dry powder for households to spend, should they so wish.

But there’s also substantial overseas demand for US treasuries, which yield the most of any G7 nation. Japan holds $1.3TN, and China $1.1TN. Theoretically, interest rate parity means that yield differentials among different sovereigns shouldn’t matter once the cost of FX hedging is factored in. But as this article implies, Japanese buyers of ten year treasuries aren’t using ten year forward FX trades to hedge their risk – they’re most likely hedging within one year, where interest rate differentials are narrower and liquidity better, making it cheaper. In effect, they’re taking yield curve risk between short term and long-term rates, but it’s been working for years. With the Fed unlikely to raise rates in the near term, it probably still looks low risk.

The bottom line is that, as long as U.S. inflation remains low, long term rates are likely to remain low too. But as lockdowns finally end, many months of frustrated purchasing power could be unleashed. How that plays out will determine the path for bonds. The market isn’t pricing in repeat of the ‘Roaring 20s’, a century after the first one.

We are invested in all the components of the American Energy Independence Index via the ETF that seeks to track its performance.


Democrats Will Test The Limits On Spending

Modern Monetary Theory (MMT) is taking hold. Relying on the insight that a government can never go bankrupt in its own currency, it posits that deficits don’t matter until they cause inflation (see our review of The Deficit Myth by Stephanie Kelton).

.avia-image-container.av-obxa07-faf6b4caf1c0cb6e7792655111539bae img.avia_image{ box-shadow:none; } .avia-image-container.av-obxa07-faf6b4caf1c0cb6e7792655111539bae .av-image-caption-overlay-center{ color:#ffffff; }

On a week that incoming President Biden unveiled a $1.9TN package to fight Covid and the economic downturn, ten year treasury yields fell. This was helped by Fed Chair Powell, who said, “When the time comes to raise interest rates, we’ll certainly do that, and that time, by the way, is no time soon,”

Meanwhile, JPMorgan, Citi and Wells Fargo released $5BN from their loan loss reserves because of the improving economic outlook.

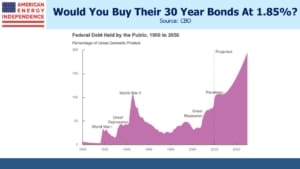
Empirically, deficits don’t seem to matter. The Congressional Budget Office (CBO) projects that Federal Debt:GDP will reach 107% in two years, eclipsing the past high that followed World War II. After a brief pause, it is projected to move stratospherically towards 200% and beyond. This projection was made last September, so omitted the $1.9TN that Biden proposes to add.

Meanwhile, thirty year bonds, which encompass the period during which Debt:GDP will soar, yield under 2%.

MMT remains a fringe theory among mainstream economists. Paul Krugman, liberal credentials burnished by his regular NYTimes op-ed slot, is a critic. Far across the political divide, Larry Summers describes it as a “recipe for disaster.” It’s not political orthodoxy for either party, although progressive Democrats see in it a way to finance their liberal agenda. But you could also envisage Republicans relying on MMT to justify tax cuts.

While economists like Paul Krugman and Larry Summers are debating the merits of MMT, practically speaking the debate is over. In Kelton’s book, she doesn’t argue that deficits never matter – if government spending exceeds the economy’s non-inflationary productive capacity, inflation will rise. That’s how you find out where the limit is.

As the bond market shows, we’re not there yet.

What isn’t receiving enough attention is that our fiscal policy is steadily adopting the MMT framework. Persistently low interest rates have removed the last remaining bulwark against fiscal profligacy. Spending hawks have gradually retired from Congress or been voted out. Holding such views is a thankless task. You don’t need to be an MMT advocate to ask why we don’t borrow huge sums at such low rates. The deficit was already growing under Trump because of tax cuts, before Covid relief took it higher still.

Last March, Trump tweeted, “With interest rates for the United States being at ZERO, this is the time to do our decades long awaited Infrastructure Bill. It should be VERY BIG & BOLD, Two Trillion Dollars, and be focused solely on jobs and rebuilding the once great infrastructure of our Country! Phase 4”

Biden’s $1.9TN package is to be financed fully with debt as opposed to taxes – for now anyway. And it doesn’t include anything from the Green New Deal (see The Bovine Green Dream). Or for infrastructure.

Big spending is a bi-partisan strategy.

What seems increasingly likely is that we’ll keep pushing our deficit higher until we generate inflation. To fail to do so is to needlessly leave people worse off. The government should spend, and provide jobs for all, because as Kelton writes in her book, “…poverty strips people of the opportunities to flourish and to participate in the American dream.”

Bernie Sanders, who will chair the Senate Budget Committee once the Democrats take control of the Senate next week, has Stephanie Kelton as an adviser. His platform during his run for the presidency last year included $30TN for Medicare for All, $16TN for the Green New Deal and $7.5TN in Federal job guarantees. Any complaints he may have on Biden’s spending plans are likely to criticize their lack of ambition.

Worrying about the deficit has been a fool’s errand for decades. Betting on higher inflation has been a losing trade for the entirety of most investors’ careers. That could remain the case this year too, although there are signs of price pressure. Hot rolled steel has doubled in price since October. Money supply (M2) is growing at 26%, faster than even the inflationary 1970s and 80s.

Protecting against inflation is incredibly cheap. December 2022 eurodollar futures yield 0.29%, only 0.06% more than today’s three month Libor, with almost two years to go. Pipeline stocks, which often have inflation escalators embedded in their tariffs, yield over 8%.

Inflation may stay quiescent, but the cost of protection is very low.

We are invested in all the components of the American Energy Independence Index via the ETF that seeks to track its performance.
We are short December 2022 eurodollar futures.


Renewables: More Capacity, Less Utilization

The U.S. Energy Information Administration (EIA) is generally apolitical – they’re not championing any single energy source. That may change under the new Administration, and they may become a shrill for renewables, but so far, they largely report data.

.avia-image-container.av-3m9ldf2-2c43190d0bbed65142f232f4a9121941 img.avia_image{ box-shadow:none; } .avia-image-container.av-3m9ldf2-2c43190d0bbed65142f232f4a9121941 .av-image-caption-overlay-center{ color:#ffffff; }

Yesterday their website carried Renewables account for most new U.S. electricity generating capacity in 2021, highlighting that 70% of the 39.7 Gigawatts (GW) of new capacity to be added is solar and wind.

.avia-image-container.av-32qxl9q-ccb67b3901423f8e77034e6970215644 img.avia_image{ box-shadow:none; } .avia-image-container.av-32qxl9q-ccb67b3901423f8e77034e6970215644 .av-image-caption-overlay-center{ color:#ffffff; }

Recently they also ran with Nuclear and coal will account for majority of U.S. generating capacity retirements in 2021. The continued drop in coal is good news – its elimination is the fastest route to reduced emissions globally. This trend is unfortunately moving in the opposite direction in China and India, but at least in the U.S. we’re getting it right.

.avia-image-container.av-2qgmnym-aa6bf9df54c13ebc2298f2be31dc3df1 img.avia_image{ box-shadow:none; } .avia-image-container.av-2qgmnym-aa6bf9df54c13ebc2298f2be31dc3df1 .av-image-caption-overlay-center{ color:#ffffff; }

The drop in nuclear is not helpful in terms of lowering emissions, since it produces none. A realistic path towards fighting climate change includes using more nuclear, rather than relying fully on solar panels and windmills.

.avia-image-container.av-23pkn1q-1f8773c0072060ac5d4293459b13cad7 img.avia_image{ box-shadow:none; } .avia-image-container.av-23pkn1q-1f8773c0072060ac5d4293459b13cad7 .av-image-caption-overlay-center{ color:#ffffff; }

What’s notable is that we’re adding 39.7GW of generating capacity while retiring 9.1GW, for a net gain of 30.6GW. Total U.S. power generating capacity is 1,100 GW, so we’re adding around 3%. But U.S. power consumption for the past decade is flat. Energy intensity, the amount of energy consumed per $ of GDP, has been falling for decades in developed countries, reflecting ongoing energy efficiencies and the steady decline of manufacturing’s share of economic output.

So why is the U.S. increasing its energy capacity?

The 39.7GW being added is certainly expected to be used – otherwise the capital wouldn’t have been invested. Most likely, it reflects the lower utilization of renewables, which typically runs 20-30%. By contrast, baseload natural gas power plants run at 90% of capacity, with nuclear higher still.

The dismal truth that, for all the excitement about solar and wind, it takes more than 1 GW of solar capacity to decommission 1GW of coal power. This lower utilization is beginning to show up in the figures. The U.S. is net adding capacity while consumption is flat. Maybe enormous growth in electric vehicles will shift energy consumption from petroleum to electricity, but it’s likely we will gradually utilize less of our power generating capacity as the mix shifts.

.avia-image-container.av-1ou9t1q-9f894dbf6ca59c598aa3c6f745b1ab5c img.avia_image{ box-shadow:none; } .avia-image-container.av-1ou9t1q-9f894dbf6ca59c598aa3c6f745b1ab5c .av-image-caption-overlay-center{ color:#ffffff; }

Comparing the cost per GW of different power sources doesn’t account for differences in utilization, which therefore flatters renewables. The need for back-up power to offset their intermittency is also normally overlooked.

.avia-image-container.av-168pq4u-e03351ad65f2934a5579fdb65684517a img.avia_image{ box-shadow:none; } .avia-image-container.av-168pq4u-e03351ad65f2934a5579fdb65684517a .av-image-caption-overlay-center{ color:#ffffff; }

Germany has pursued renewables aggressively, adding capacity even while demand has been falling. Because of this, they also have among the highest electricity prices in the world. More of their power generation sits idle than in the past, because the windpower they’ve been adding has lower utilization. Watching the “Energiewend” (Energy Transition) has been instructive for the rest of us (see It’s Not Easy Being Green).

.avia-image-container.av-sndk1a-36749863790e1afdcdf63ca4f50ae7b4 img.avia_image{ box-shadow:none; } .avia-image-container.av-sndk1a-36749863790e1afdcdf63ca4f50ae7b4 .av-image-caption-overlay-center{ color:#ffffff; }

At least they’re not as bad as California, the state with America’s most expensive and least reliable electricity (see California’s Altruistic Carbon Policy).

Outside of California, electricity is cheap in the U.S. Some may believe there is plenty of room for prices to rise. If we are serious about climate change, prices should rise. Germany’s example shows where this can go. It’s not yet part of the climate change debate in America. It should be.

We are invested in all the components of the American Energy Independence Index via the ETF that seeks to track its performance.