Can Anyone Catch America in Plastics?

Ethane prices recently hit a four year high. Although this garnered far less attention than the crude oil rally, increasing supplies of ethane is an unappreciated element of the Shale Revolution.

“Dry” natural gas consists of methane, most commonly supplied to residential gas stoves but also increasingly used by power plants to produce electricity. “Wet” gas includes other natural gas liquids (NGLs), such as ethane (more below), propane (used in your outdoor BBQ), butane (cigarette lighters) and other more obscure NGLs such as isobutene. Typically, the NGLs and other impurities are separated out from the wet gas, leaving methane as the natural gas that flows to customers. Because NGLs have marketable value, wet gas is more desirable.

Ethane, once converted to ethylene through “cracking” is the principal input into production of polyethylene. Simply put, ethane is turned into plastic. Polyethylene is manufactured in greater quantities than any other compound.

.avia-image-container.av-1oeq9ic-0fc4075e2087d88bdb748a217d5a200b img.avia_image{ box-shadow:none; } .avia-image-container.av-1oeq9ic-0fc4075e2087d88bdb748a217d5a200b .av-image-caption-overlay-center{ color:#ffffff; }

Plastics are the by-product of ethane

The process is fascinating, and naturally the internet provides ample information. Ethane molecules are broken through heating (“cracked” in industry parlance), and the ethylene produced undergoes further processing into polyethylene pellets. These plastic pellets come with different properties such as strength, flexibility and melting point, which determine their ultimate use. They are heated and molded into many thousands of consumer and specialty products. For an absorbing description that follows ethane molecules from extraction to ultimate use, the Houston Chronicle’s three-part series Texas petrochemical plants turn ethane into building blocks of plastic is highly readable.

Among many fascinating steps, we learn that molten polyethylene pellets are blown into a very thin cylindrical balloon, several hundred feet long. This is then turned into sheets by passing through rollers, and multiple sheets are combined depending on the desired thickness. In the article, these ethane molecules ultimately traveled as plastic pellets to Vietnam where they were processed into packaging for frozen shrimp that was shipped back to the U.S. The petrochemical industry makes this happen.

U.S. ethane production has more than doubled in the past decade, to 1.5 Million Barrels per Day (MMB/D). Ethane is a gas and isn’t shipped in barrels. The MMB/D unit of measure converts the energy content of the ethane to that in a barrel of crude oil. Barrels of Oil Equivalent (BOE), allows volumes of most hydrocarbons to be measured using a common metric. What further sets the U.S. apart is that shale’s light crude comes with relatively high concentrations of NGLs, including ethane. It simply needs to be separated out.  The alternative source of ethane is as a by-product from refining crude oil, a more costly approach.

.avia-image-container.av-zdxf8k-7954ef64b9700b8d8973b73d65ac8e11 img.avia_image{ box-shadow:none; } .avia-image-container.av-zdxf8k-7954ef64b9700b8d8973b73d65ac8e11 .av-image-caption-overlay-center{ color:#ffffff; }

Plastics are the by-product of Ethane

The U.S. is producing so much ethane that some of it is being mixed in with the methane natural gas stream as it can’t be profitably used elsewhere (known as “ethane rejection”). Low ethane prices with the promise of ongoing ample supply have led to a flurry of new petrochemical investments.  Cheap natural gas lowers processing costs, since the conversion of ethane to plastic pellets requires heat. For example, Exxon Mobil (XOM) operates one of the world’s largest polyethylene plants in Mont Belvieu, TX, with ethylene provided by a new facility at their nearby Baytown complex.

But the big increase in natural gas output is in Appalachia, where the Marcellus and Utica shale formations are providing most of this new supply. Royal Dutch Shell is building a new ethane cracker in western Pennsylvania, close to its supply. In total, $202BN of investments in 333 projects have been announced since 2010. U.S. ethane exports have been rising, but as these new facilities become operational they will increase domestic demand. Two thirds of the investments involve foreign companies. The recent jump in the ethane price is partly attributable to new domestic buyers.

The result is that ethane trade flows are shifting, and the U.S. is becoming a more important supplier of plastics.

The Shale Revolution draws attention for the growth in fossil fuels — crude oil and natural gas, where the U.S. leads the world.  But we’re even more dominant in NGLs, contributing one-third of global production. The impact of NGLs and consequent growth in America’s petrochemical industry receives far less attention, although it’s another huge success story.

.avia-image-container.av-rtubs4-f66c68e05ecf71bfe1c72f9439446086 img.avia_image{ box-shadow:none; } .avia-image-container.av-rtubs4-f66c68e05ecf71bfe1c72f9439446086 .av-image-caption-overlay-center{ color:#ffffff; }

Plastics are the by-product of Ethane

Enterprise Products Partners (EPD), Energy Transfer Equity (ETE), Oneok Inc. (OKE) and Targa Resources Corp (TRGP) are well positioned to benefit from America’s growing NGL production. Our funds are invested in all of them.


Saudi America: Why the Shale Revolution is Real

Bethany McLean didn’t intend her latest book, Saudi America: The Truth About Fracking and How It’s Changing the World, to be a booster of the Shale Revolution. The New York Times got it all wrong when they titled her promotional op-ed, The Next Financial Crisis Lurks Underground. Before reading her book, I therefore assumed that in forecasting a collapse in the U.S. energy sector, the very recent one in 2014-16 had simply passed her by (see New York Times Forecasts the 2014-16 Energy Sector Collapse). But McLean accurately chronicles how OPEC nations failed to bankrupt the nascent U.S. shale industry with low oil prices, thereby demonstrating its resilience. She notes the importance of privately-owned mineral rights, an almost-uniquely American concept that facilitated onshore oil and gas exploration long before shale. Those who don’t fear a crash are well represented. The IEA’s chief economist, Fatih Birol, says, “There is a silent revolution taking place in the United States, so silent that nobody’s aware of it.”

.avia-image-container.av-ksv8tz-a2b23a4607070a40a7b05cd86b29910c img.avia_image{ box-shadow:none; } .avia-image-container.av-ksv8tz-a2b23a4607070a40a7b05cd86b29910c .av-image-caption-overlay-center{ color:#ffffff; }

Saudi America - Book Review

In fact, McLean’s warnings of collapse are based on such weak arguments and are so half-hearted that she’s grudgingly conceding the secular change in world energy markets that’s occurring. A private equity investor (“titan”) suggests “…the Federal Reserve is entirely responsible for the fracking boom.” Really? Did the Fed buy energy sector bonds? Are low interest rates failing to benefit any other sector? In 2016, non-investment grade bond yields for some energy names reached 25%. Although there were bankruptcies, the industry survived as assets moved from weak hands to strong. She also finds some bearish hedge fund managers who have lost money shorting shale drillers. If these are the best arguments for another crash in the U.S. energy sector, investors have little to fear. In fact, the weakness of McLean’s arguments against Shale offered a more convincing defense of its longevity than many authors who set out to do just that.

As is often the case, the characters are most interesting. Although McLean relies heavily on past writings on Chesapeake founder Aubrey McLendon, it’s still absorbing to reread about his enormous risk appetite. McLendon’s fiery death while driving alone two years ago looked like suicide, given his mounting financial and legal problems, but it was ruled an accident. The industry lost a colorful believer whose single-minded approach was financially unsuccessful. By contrast, the methodical, analytical approach of companies like EOG demonstrates that the resurgence of hydrocarbon production in the U.S. is not driven by leveraged operators that are permanently bullish.

Shale firms have long been criticized for outspending their cashflow. The industry’s continued access to capital demonstrates that many expect this to reverse. The world’s biggest oil companies, like Exxon Mobil, are now investing in shale, bringing financial discipline and less reliance on capital markets financing, exactly what McLean believes is needed.

You have to work pretty hard to find a downside to American Energy Independence. It’s a bit like complaining about an outsized capital gains tax bill. Shale is pretty obviously an enormous U.S. benefit; less clearly good for others. Nonetheless, McLean tries to get us worried: if we buy less oil from unstable parts of the world, we’re less likely to care about their security. That’s not obviously bad for our young men and women in the military.

McLean fears that the Trump Administration’s desire to drill for oil in the Arctic National Wildlife Refuge (ANWR), “…will crater prices, thereby making the economics of drilling even less attractive than they already are.” Little thought went into that sentence – there are reasons to leave ANWR alone, but crashing the oil market is not one of them. This is where the real McLean emerges – as an environmentalist opposed to fossil fuels, trying to marshal non-environmental arguments against.

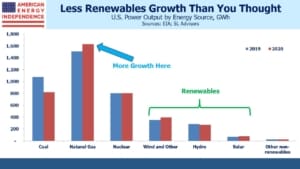
Having made a convincing if unintended case that financial challenges will not derail America’s energy renaissance, McLean then warns that renewables will soon bring its demise. But even here, she makes a strong argument for natural gas as a complement to intermittent solar and wind. She quotes Michael Cembalest, JPMorgan’s thoughtful chief strategist, who wrote that, “An electricity grid with less coal, less nuclear, and more renewable energy would be highly dependent on abundant, low-cost natural gas.” We completely agree.

The short-cycle nature of shale production is its enormous strength, something McLean overlooks. Predicting long term demand for crude oil is never easy, but the development of electric cars makes it exceptionally risky to invest in projects with a 20 year payback, which is what conventional oil projects look like. Shale production relies on drilling hundreds of wells that cost under $10MM each. Output declines sharply from a high rate, but capital invested is repaid quickly, often within two years. Output can be hedged in the futures market. If prices drop, drillers stop completing new wells. This quick payback offers a substantially better risk profile, something the industry recognizes. It’s why capital continues to flow in that direction (see Why Electric Cars Help the Shale Revolution).

Saudi America is a quick read – at only 138 pages, I finished it in around four hours. You won’t gain many insights, but as a chronicle of why the Shale Revolution will continue to transform energy markets, it’s worth a quiet afternoon.


Pipeline Stocks Chart a Higher Path

Technical analysis shows that the outlook for pipeline stocks is bullish.

We rarely write on technicals, since we’re relentlessly focused on the fundamentals. But fundamental news has been light, with prices drifting irregularly lower. Investors are overwhelmingly frustrated with the failure of pipeline company stocks to reflect growing throughput volumes. The U.S. just claimed World’s Biggest Oil Producer (see America Seizes Oil Throne). Liquified Natural Gas exports are set to more than double next year (see U.S. Oil and Gas Exports: A New Weapon). In willful defiance, pipeline stocks sagged. One sell-side analyst described recent investor meetings as, “at times blurred between market discussions and therapy sessions.”

For a chartist relying on technical analysis, we think the sector is setting up for a sustained rally. We don’t make investment decisions based on charts. As a visual price history they are helpful, but our portfolio adjustments are driven by shifts in long term fundamentals. However, many investors use technical analysis as a timing aid. Some pore over charts carefully before making decisions. Absent much market-moving news, such analysis is more relevant.

Energy infrastructure charts show three bullish patterns. The first is that the sequence of lower lows from late last year into Spring was not confirmed by the Relative Strength Index (RSI) readings. This type of divergence typically indicates weaker conviction among sellers on each successive dip, warning of a change in trend. Sure enough, the recent August high exceeded the prior one in February, revealing that a new uptrend has begun.

.avia-image-container.av-1z8zwhb-e8bf9da160ba2d68482d151aa1085eae img.avia_image{ box-shadow:none; } .avia-image-container.av-1z8zwhb-e8bf9da160ba2d68482d151aa1085eae .av-image-caption-overlay-center{ color:#ffffff; }

Pipeline Stocks Chart Higher

Supporting this, in June the 50 day moving average convincingly crossed the 200 day moving average, following which the sector moved smartly higher.

.avia-image-container.av-1ksn1rj-4575e5846931d5447f294547103edfc5 img.avia_image{ box-shadow:none; } .avia-image-container.av-1ksn1rj-4575e5846931d5447f294547103edfc5 .av-image-caption-overlay-center{ color:#ffffff; }

Further confirmation is provided by the clear upturn in the 200 day moving average.

.avia-image-container.av-11y3bm7-c73aeca88e6da15528397b6e913d5fe3 img.avia_image{ box-shadow:none; } .avia-image-container.av-11y3bm7-c73aeca88e6da15528397b6e913d5fe3 .av-image-caption-overlay-center{ color:#ffffff; }

This all points to a sector in which medium term (i.e. 3-12 months) momentum is turning up, with the recent softness not that material over a longer perspective. Crude oil technical analysis shows a bull market many months old, adding to the frustration of  investors in pipeline stocks who feel the two are only correlated on the downside.

.avia-image-container.av-nyabin-e13a753134b132e4b4aeab7995811a26 img.avia_image{ box-shadow:none; } .avia-image-container.av-nyabin-e13a753134b132e4b4aeab7995811a26 .av-image-caption-overlay-center{ color:#ffffff; }

Nonetheless, the sector has been weak. It might be in part because the Alerian MLP ETF (AMLP) has experienced steady outflows since June. Its shares outstanding have dropped by 8% in spite of the fact that 2Q18 earnings were generally good. Some of this is probably due to growing awareness of its flawed tax structure (see Uncle Sam Helps You Short AMLP) and shrinking pool of MLPs (see The Uncertain Future of MLP-Dedicated Funds). One reader on Seeking Alpha described it as “obsolete and tax inefficient”.

Oil and gas volumes continue to grow, which augurs well for the next earnings reports in October. Examples of infrastructure shortages abound. Natural gas at the Waha hub in west Texas trades at $0.82 per thousand cubic feet, a steep discount to the $3 Henry Hub benchmark because gas production exceeds pipeline capacity. Gas is being flared in the Permian basin.

Crude oil in Midland, TX trades at a $12 per barrel discount to Cushing, OK (the delivery point for CME futures). This similarly reflects a shortage of pipeline capacity, since tariffs on long term contracts are around $3-$5. The 2015 collapse was due to fears of pipeline overcapacity, so today’s bottlenecks ought to be positive.

Proposition 112 is the Colorado referendum question that would greatly impede future oil and gas development.  Fear of it passing in November has weighed on affected stocks, such as Noble Midstream (NBLX) and Western Gas (WES). But there’s no indication that other states are considering similar moves, so its impact is limited to those with significant Colorado exposure.

We expect solid 3Q18 earnings, which will support 10% dividend growth across the sector.  This might well provide the fundamental impetus needed for pipeline stocks to rally. When that happens, technical analysts can point to chart patterns that predicted it.

We are invested in Western Gas Equity Partners (General Partner of WES), and are short AMLP.


U.S. Oil and Gas Exports: A New Weapon

Start with Iran. In May, Trump withdrew from the Nuclear Accord over strong opposition from foreign allies and domestic policy experts. America announced it would unilaterally impose sanctions on Iran from November 1. Critics said this would be ineffective. Since then, Iranian oil exports are down 25% and likely to fall further. Any company trading with Iran risks losing access to the U.S. banking system, a penalty sufficiently onerous that buyers of Iranian oil are wasting no time sourcing alternatives. Companies from South Korea, France, Japan, Greece, Spain and Italy have all reduced or halted purchases in recent months. U.S. oil and gas exports are a new weapon.

Coincidentally, this has also created an opportunity for exports of ultra-light condensate oil from Texas to meet Asian demand, with buyers increasingly shunning Iranian condensate. U.S. oil and gas exports are playing a bigger role.

The loss of Iranian crude oil on world markets has pushed prices higher. But the Shale Revolution has moderated the U.S. economy’s sensitivity to energy prices. The negative of consumers spending more on gasoline will be mostly offset by a resurgent domestic energy sector. The New York Times published a rare Trump-positive story, noting that the Iran strategy was working.

.avia-image-container.av-s2tyvr-01b65b72863ef073041d384fd283fc24 img.avia_image{ box-shadow:none; } .avia-image-container.av-s2tyvr-01b65b72863ef073041d384fd283fc24 .av-image-caption-overlay-center{ color:#ffffff; }

U.S. Oil and Gas Exports - Crude OIl

Germany’s heavy reliance on renewables to provide electricity has been hampered by its use of coal. Since it’s not always sunny and windy, solar and wind can’t provide a complete solution. In Germany, dirty coal-burning power plants provide the reliable baseload supply every electricity grid needs. Their emissions have negated much of the benefit of renewables, so Germany wants to burn more natural gas, which is cleaner. Its lower CO2 output makes it a natural complement to renewables (see Pipeline Investors Fight Climate Change).

Consequently, Germany is planning Nord Stream 2, a controversial pipeline that will bring natural gas from Russia to Germany. Trump is correct to ask, “What good is NATO if Germany is paying Russia billions of dollars for gas and energy?” But America can do more than just criticize; Liquified Natural Gas (LNG) from the U.S. provides an alternative not susceptible to mid-winter maintenance. Russia has used this tactic before, when negotiations with Ukraine weren’t going in the desired direction. Shivering Ukrainians found they had little leverage with Gazprom, Russia natural gas company, who is not an attractive supplier. Last week Trump promoted U.S LNG to Poland, another NATO ally.

In North America, the U.S. is providing more natural gas to Mexico, which needs it to meet growing demand for electricity. There is 11 Billion Cubic feet per Day (BCF/D) of pipeline capacity, of which Mexico is only using 4.5BCF/D. Meanwhile, the Permian in west Texas is producing more natural gas than the existing takeaway infrastructure can handle. This is limiting oil production (since gas and oil often both come out of the same well) and resulting in flaring of unused gas which nobody likes. As additional pipelines connect natural gas burning power plants south of the border, they will consume more Permian output.

.avia-image-container.av-mclexj-f248179603d978ea6fc99bc9f3310f2d img.avia_image{ box-shadow:none; } .avia-image-container.av-mclexj-f248179603d978ea6fc99bc9f3310f2d .av-image-caption-overlay-center{ color:#ffffff; }

U.S. Oil and Gas Exports - Mexico

Canada struggles with access for its oil exports, in part due to domestic politics (see Canada’s Failing Energy Strategy). This is why Transcanada’s (TRP) planned Keystone XL Pipeline is so important to them, since it will add up to 830,000 barrels a day of transport capacity for a country chronically short of it.

Trump overturned Obama Administration impediments to Keystone XL shortly after taking office. Although they’ve since had to contend with legal challenges at the state level, TRP expects to begin preliminary work on the pipeline in Montana later this year.

Marcellus natural gas is displacing Canadian imports in the eastern U.S., which is helping our trade balance at a moment when the Administration is focused on imbalances. Construction of Keystone XL is a big help to our northern ally. Energy is a vital component of our bilateral Canadian relationship.

.avia-image-container.av-qh77iv-c4dfd5c9d2c11b9e3663eefc3f18f9ed img.avia_image{ box-shadow:none; } .avia-image-container.av-qh77iv-c4dfd5c9d2c11b9e3663eefc3f18f9ed .av-image-caption-overlay-center{ color:#ffffff; }

U.S. Oil and Gas Exports - LNG

Three quarters of global LNG trade occurs in Asia. Following Japan’s 2011 Fukushima earthquake and tsunami, they virtually shut down their nuclear power industry, which has made them big buyers of LNG. China and India are both looking for cleaner alternatives than coal to meet growing electricity demand. Although China recently imposed a 10% tariff on U.S. LNG imports, they previously exempted U.S. crude oil. China’s reduced purchases of U.S. LNG are being offset by other Asian buyers.

In June, U.S. crude oil exports reached 2.2 Million Barrels per Day (MMB/D). China bought almost a quarter, but other destinations included India and South Korea. We even exported 0.2 MMB/D to Canada, although they remain our biggest provider of crude with 4.5 MMB/D of different grades coming back the other way.

Exports of crude oil, natural gas liquids and LNG are all set to rise sharply in the years ahead, as new infrastructure is completed.

U.S. oil and gas exports are providing additional negotiating leverage over allies and adversaries. The Shale Revolution and energy infrastructure investments are providing vital support.


America Seizes Oil Throne

.avia-image-container.av-jbvntp-196b46f32cd5b11fab81c82ca0903508 img.avia_image{ box-shadow:none; } .avia-image-container.av-jbvntp-196b46f32cd5b11fab81c82ca0903508 .av-image-caption-overlay-center{ color:#ffffff; }

Last week the U.S. became the world’s biggest crude oil producer. Not everyone agrees – Russian production figures still show them ahead. But the Energy Information Administration (EIA) is confident that we are, and that we’re going to stay there at least through next year.

This represents a milestone in the path towards American Energy Independence. Only 10 years ago, U.S. output was 5 Million Barrels per Day (MMB/D) and was in decline. Today it’s reached 11MMB/D and is growing rapidly.  Horizontal drilling and hydraulic fracturing unlocked the huge reserves in shale formations, and the decline was arrested. Over the next several years U.S. output grew sufficiently to more than meet global demand growth.

.avia-image-container.av-lk4w65-1d3bd50c5fd649712f7fac4beba03c8a img.avia_image{ box-shadow:none; } .avia-image-container.av-lk4w65-1d3bd50c5fd649712f7fac4beba03c8a .av-image-caption-overlay-center{ color:#ffffff; }

In 2014 Plains All American (PAGP) produced a powerful chart showing how North American crude was gaining market share. OPEC finally tired of their commensurate lost share which they believed was hurting their revenues. The subsequent 2014-16 energy sector collapse was OPEC’s attempt to bankrupt America’s nascent shale industry, to blunt the growth of this new oil producer. Although the financial pain was widespread, the industry didn’t break. American capitalism responded – costs were slashed, productivity enhanced and a leaner, stronger shale industry emerged.

.avia-image-container.av-18o1vr1-162ec25ba4cd387aea4b5b47584066f7 img.avia_image{ box-shadow:none; } .avia-image-container.av-18o1vr1-162ec25ba4cd387aea4b5b47584066f7 .av-image-caption-overlay-center{ color:#ffffff; }

OPEC relented (see OPEC Blinks), concluding low prices were damaging their members more than the shale upstarts. U.S. production began rising again. It passed its 2014 high last year, and last week took the world’s top oil producer spot, well ahead of many forecasts.

It’s an epic story, with significant consequences across geopolitics, trade and the environment. America’s improved energy security is underwriting a more robust approach to Iran. In the 1970s, support for Israel in its wars against Arab states led to gas lines as OPEC’s flexed its muscle and imposed an oil embargo.

American exports of Liquified Natural Gas (LNG) are creating new trade opportunities with Asia, where South Korea, China and Japan are among our biggest buyers. In spite of the escalating tariffs with China, they recently exempted U.S. crude oil imports from a list of items subject to new tariffs. Germany’s plan to buy more natural gas from Russia via Nord Stream 2 is more easily criticized when U.S. LNG is available. Trump’s tweet, “What good is NATO if Germany is paying Russia billions of dollars for gas and energy?” is hard to fault.

American Shale gas has contributed to the world’s biggest reduction in CO2 emissions (see Guess Who’s Most Effective at Combating Global Warming). It’s made possible the shift from coal to natural gas in electricity generation. The Shale Revolution has been positive in so many ways.

Although few stop to think about it, the Shale Revolution reflects the success of American capitalism. Oil and gas originate in porous rock all over the world, but it’s taken a unique combination of advantages for the U.S. to emerge as virtually the only shale player on the planet. In America Is Great! we list the many attributes whose presence was necessary, such as a skilled energy sector labor force, existing infrastructure, access to capital, advanced technology and so on. Apart from the geology, they’re all the results of America’s capitalist system. The least appreciated is privately-owned mineral rights. All over the world, an individual’s property ownership is limited to the surface, with the government owning what’s beneath. By contrast, American landowners have been able to profit from their mineral rights. This has created private sector wealth in a way that a government claiming eminent domain of a lucrative property never could.

All this means that the Shale Revolution was not luck; if it was going to happen anywhere, it was going to be in America.

The energy infrastructure sector has been lethargic over the past few weeks. 2Q18 earnings were strong, but investor positivity was fleeting. Since early August, flows have been light and buyers cautious. The Alerian MLP ETF (AMLP) has seen outflows on most days, although that may be because people are becoming aware of its flawed tax structure (see Uncle Sam Helps You Short AMLP).

.avia-image-container.av-joz74t-883487ba70292a0dc94e55bad4cb1f14 img.avia_image{ box-shadow:none; } .avia-image-container.av-joz74t-883487ba70292a0dc94e55bad4cb1f14 .av-image-caption-overlay-center{ color:#ffffff; }

Record U.S. oil production should serve as a reminder that pipeline companies are the vital enablers of our energy success. Cash flow yields on the American Energy Independence Index are 8.75% and we expect 15-20% annual cash flow growth this year and next.  The dividend yield is 5.6% and growing 10%/year.  Hydrocarbons have to be processed, stored and moved; record volumes should support 3Q18 profits when they start being reported next month.

We are long PAGP.

We are short AMLP.


Canada’s Failing Energy Strategy

On July 6, 2013, 47 residents of Lac-Megantic, Quebec died horribly when a 74-car freight train carrying crude oil exploded in a fireball. It was the deadliest freight-train accident in Canadian history. Five bodies were never recovered and were assumed to have simply vaporized. DNA samples were required to identify others. Heat from the inferno was felt over a mile away.

In spite of this tragedy, moving crude by rail (CBR) is comparatively safe. Since 2013, safety standards have been tightened throughout North America. The International Association for Energy Economics (IAEE) found the incidence of spills with CBR to be less than for pipelines. However, this is a deceptive statistic. Once you adjust for the greater volumes of crude moved by pipeline versus CBR, as well as the greater distances covered, pipelines remain substantially safer. The report concludes that, “the risk associated with shipping crude oil is noticeably larger for rail deliveries than for pipeline deliveries.”

2,500 miles west, off the coast of Vancouver, live around 75 endangered killer whales. Their connection with Lac-Megantic is not obvious. Fortunately for the Orcas, vocal advocates have successfully made their continued survival more important than avoiding another freight train tragedy. By blocking the Trans Mountain Pipeline Expansion, they have ensured that more Albertan crude oil will reach its buyers by rail, given continued inadequate pipeline capacity.

The Trans Mountain Pipeline (TMX) was put into service in 1953, and has been in continuous operation ever since. It’s another example of the long life of installed energy infrastructure, which generally appreciates in value when properly maintained even while accounting rules allow for its depreciation. Kinder Morgan (KMI), which acquired the pipeline in 2005, had been frustrated in its efforts to more than double the capacity of TMX by adding a second pipeline alongside the first. The TMX Expansion’s approval became a provincial political football. Land-locked Alberta has few choices in exporting its crude oil.

.avia-image-container.av-18ycohp-6ed77f12d7ff85d4acad5a2bbe750b5c img.avia_image{ box-shadow:none; } .avia-image-container.av-18ycohp-6ed77f12d7ff85d4acad5a2bbe750b5c .av-image-caption-overlay-center{ color:#ffffff; }

British Columbia sought to prevent a new pipeline from Alberta reaching the Port of Vancouver. Oil that passes through on its way to export markets has little value to local residents, since British Columbia doesn’t need any more oil. Environmentalists worried about a spill, and regard Albertan oil-sands crude as exceptionally hostile to the environment (it’s true that an oil sands facility is not pretty). First Nations tribes claimed their water supplies were threatened, although of 133 indigenous groups consulted, 43 were in support. And the anticipated increase in tanker traffic at the port of Vancouver, from two to ten per week, risked displacing the dwindling community of killer whales.

.avia-image-container.av-m3nwsd-8b2c3bd7532fe1c3c5221feaf36a20ce img.avia_image{ box-shadow:none; } .avia-image-container.av-m3nwsd-8b2c3bd7532fe1c3c5221feaf36a20ce .av-image-caption-overlay-center{ color:#ffffff; }

It was this last point that prompted the Federal Court of Appeal to overturn the government’s approval of the expansion in late August. Although the absence of a meaningful dialogue with First Nations representatives was cited, failure to consider the increased tanker traffic, “was so critical that the Governor in Council could not functionally make the kind of assessment of the project’s environmental effects and the public interest that the (environmental assessment) legislation requires,” said the ruling, written by Justice Eleanor Dawson. Canadian law provides wildlife with considerable protections.

In a deft move, KMI had by now extricated themselves from the vagaries of Canadian energy policy. For months, they had complained about the impossibility of building a pipeline linking two provinces holding opposite views on its completion. Finally, in May they unburdened themselves of the whole sorry mess and sold TMX to the Canadian Federal government for C$4.5BN, viewed by many as a pretty full price. KMI shareholders dodged a bullet.

A few weeks after agreeing the sale of TMX, KMI estimated in a filing that completion of the expansion would cost C$1-1.9BN more than originally expected and take a year longer. On August 30th, KMI shareholders formally approved the sale, hours after the Court of Appeal ruling. TMX was by now worth considerably less than the C$4.5BN paid — the bailout by Canadian taxpayers was complete.

Prospects for the TMX Expansion are uncertain, with a delay of two years or more seemingly inevitable. The Canadian government is considering an appeal, redoing its environmental review, and crafting legislation to force it through. Canada wants to complete the pipeline. Meanwhile, Alberta grumbles about contemplating separatism, and has in the past suggested that it might halt crude oil shipments to British Columbia altogether.

Canadian crude oil will continue to reach its buyers, although more of it will move by rail. The International Energy Agency expects CBR shipments to double over the next two years due to lack of pipeline capacity. Suncor, Canada’s largest oil and gas producer, won’t expand crude oil production until it sees progress on pipeline approvals. The persistent $25-35 per barrel discount of Western Canadian Sedimentary crude to the WTI benchmark is directly linked to limited transportation choices, and must be regarded as a huge success by Alberta’s neighbors in British Columbia. Since the U.S. is both its biggest energy customer and nowadays its biggest competitor, Canada’s position is unenviable.

.avia-image-container.av-1i4q42l-00fddfef3a7428ed2fb11a449770505d img.avia_image{ box-shadow:none; } .avia-image-container.av-1i4q42l-00fddfef3a7428ed2fb11a449770505d .av-image-caption-overlay-center{ color:#ffffff; }

American readers will be relieved that such extreme dysfunction doesn’t exist in the U.S. Recall though, Boston’s annual winter imports of liquefied natural gas from Trinidad and Tobago to keep the lights on.  Pipeline opposition isn’t limited to our northern neighbor (see An Expensive, Greenish Strategy).

The investment takeaway is that opposition to new pipelines increases the value of those already installed. When shippers resort to rail to move crude oil, their bargaining position on pipeline tariffs is weak. Oil and gas companies suffer lower revenues, consumers higher prices, and railway lines benefit if demand is sustained long enough to justify their capex. But for pipeline companies, installed pipelines with decades of useful life can represent a scarce resource. If the possibility of excess pipeline capacity concerned markets during the 2014-16 energy sector collapse, we are now headed solidly in the other direction.

We are long KMI.


Could Oil “Super-Spike” Above $150?

In July, Pierre Andurand’s hedge fund, Andurand Capital, lost 15% on bullish crude oil bets. Oil was weak in July, but is up 21% in 2018. Notwithstanding this correct outlook, his fund is -5% for the year. Few things are more frustrating for a manager or his clients than losing money on a profitable call.

Putting aside the challenges of hedge funds, which we have amply covered in years past (see The Hedge Fund Mirage; The Illusion of Big Money and Why It’s Too Good To Be True), a bullish outlook on crude enjoys solid fundamental support. Andurand once ran a hedge fund that profited mightily during the 2008 financial crisis, only to fold following large losses in 2011. More recently though, his calls on oil have been better than most (see Fund Chief Survives Oil’s Swings), including correctly forecasting the 2014-15 collapse. Few of his peers successfully navigated this period. Reportedly, Andurand sees a multi-year bull market that could eventually reach $300 a barrel. Bernstein Research, whose deep investment analysis is widely respected, has warned of a “super-spike” above $150 a barrel.

Both supply and demand for crude oil are relatively inelastic over periods of a few quarters or so. Global transportation relies heavily on refined petroleum products. Higher prices discourage some trips, but for the most part miles driven and flown don’t dip much with higher prices. Bringing on new supply typically takes several years. So over the short run, small shifts in demand or supply disproportionately move prices.

Global crude oil demand rose by 1.7MMB/D (Million Barrels per Day) last year and in 2016, up from the ten year average of 1.1MMB/D. Demand growth is driven by developing countries, especially China and India. But far more important to a balanced market is depletion of existing oilfields, something that receives little attention. Output from most plays peaks early in their operational life, when underground pressure is most effective at pushing oil to the surface. Thereafter, production steadily declines. Estimates vary, but most analysts agree that 3-5MMB/D is the global drop in annual production from existing plays, absent any new recovery-enhancing investments.

This year the Energy Information Administration (EIA) estimates that the world will consume 100 MMB/D, a record. In order to offset depletion plus demand growth, new supply of around 5-7MMB/D is required.

Following the oil price crash 2014-15, energy companies adopted greater financial discipline and planned for lower oil prices in the future. The combination of higher required returns and lower assumed prices has had a chilling effect on investment. The U.S. Shale Revolution is at least partly responsible. U.S. output barely dipped during the 2014-15 collapse.  Although low prices weren’t sustained for long, the episode caused subsequent projects to be evaluated against the possibility of a repeat. For example, in April BP’s chairman said they were, “still working with the assumption that this is going to be a world with an abundance of oil.”

.avia-image-container.av-2laga7l-6d9e991c44534cf4682b9daf4a2945d8 img.avia_image{ box-shadow:none; } .avia-image-container.av-2laga7l-6d9e991c44534cf4682b9daf4a2945d8 .av-image-caption-overlay-center{ color:#ffffff; }

Major oil projects have always had risk to input costs and demand over the ensuing decade or longer. But today, those risks are even harder to quantify. It’s generally believed that oil demand will peak within a generation, yet growth in recent years has been as high as ever. Although Electric Vehicles (EVs) have many enthusiasts, sales growth of gasoline-chugging cars easily outpaces EVs in China, which is why crude demand keeps growing.

Improved financial discipline, wariness of a second Shale-induced price collapse and uncertainty around EV growth are three significant factors impeding investments in new supply. Taken together, these three factors have created greater risk aversion than the industry has shown in the past.

Consequently, capital invested in conventional projects remains low and projects are more modest. Companies are favoring “short-cycle”, whose smaller up-front investment consequently gets repaid more quickly with greater IRR certainty.

.avia-image-container.av-27wdlox-58e6bbcf8394356dd8f84615ffd12b2e img.avia_image{ box-shadow:none; } .avia-image-container.av-27wdlox-58e6bbcf8394356dd8f84615ffd12b2e .av-image-caption-overlay-center{ color:#ffffff; }

However, there just aren’t enough short-cycle projects available, which is causing concern within the industry. Schlumberger CEO Paal Kibsgaard warned that, “It is, therefore, becoming increasingly likely that the industry will face growing supply challenges over the coming year and a significant increase in global exploration and production investment will be required to minimize the impending deficit.” Bernstein Research concurred, “Investors currently calling on exploration and production companies to return more cash to shareholders at the expense of funding future production may also come to regret their strategy.”

There are many examples of countries underinvesting in maintaining existing levels of production.

.avia-image-container.av-1omy1f5-c235f70e09f14f86f25f1fe3da80806f img.avia_image{ box-shadow:none; } .avia-image-container.av-1omy1f5-c235f70e09f14f86f25f1fe3da80806f .av-image-caption-overlay-center{ color:#ffffff; }

Because less risky, short-cycle projects are mostly shale plays in the U.S., a stark difference in financing has opened up between America and Europe. EU bank financing for Exploration and Production, always far smaller than in the U.S., has collapsed in recent years.

.avia-image-container.av-13mej0x-b45fe979d66bd259c38e0646e925b376 img.avia_image{ box-shadow:none; } .avia-image-container.av-13mej0x-b45fe979d66bd259c38e0646e925b376 .av-image-caption-overlay-center{ color:#ffffff; }

Although Saudi Arabia is believed capable of producing as much as 12.5 MMB/D for a few months, many observers feel this is unsustainable. U.S. shale is one of the few areas of growth. Permian output in west Texas is expected to average 3.3 MMB/D this year and 3.9MMB/D in 2019. Yet, infrastructure constraints recently caused the EIA to trim its outlook for U.S. 2019 production from 11.8MMB/D to 11.7 MMB/D, up 1 MMB/D versus this year. Concern that U.S. production could lead to another price drop is limiting new global investment – yet, the most optimistic forecasts of U.S. output show that significant additional new supply beyond US shale is going to be needed.

A determination to avoid past mistakes of unprofitable oversupply is likely to lead to the opposite; an undersupplied oil market. The question is, how high must crude go to satisfy the new profitability goals and other concerns of the integrated oil companies. Many fear that $100 a barrel will be insufficient – and the market is poorly positioned for any supply disruptions, perhaps caused by Iran or some other geopolitical shock. Another Shale-induced price collapse, falling demand due to EVs and new-found financial discipline represent long-term concerns inhibiting the search for new discoveries.

Oil needs to be high enough to compensate for all three risks. Since today’s prices aren’t high enough to stimulate enough new investment, oil should move higher. This will encourage conventional investment, but will also test the limits of the U.S Shale Revolution in growing output.  To bet on increasing oil and gas volumes in the U.S., invest in the network of infrastructure that moves these supplies to market.

The components of the American Energy Independence Index are growing dividends at 10% per annum.

.avia-image-container.av-swjhv5-da86ddbf444d4c43ecb22b49c2022edb img.avia_image{ box-shadow:none; } .avia-image-container.av-swjhv5-da86ddbf444d4c43ecb22b49c2022edb .av-image-caption-overlay-center{ color:#ffffff; }


Reliable Yields Are the Best

Before jumping at an attractive yield, investors should pause to consider its consistency.

In recent years, traditional MLP investors were victims of one of the greatest betrayals in U.S. financial history. Older, wealthy Americans were drawn to companies that paid out most of their cashflow in distributions. For years, America’s energy came from roughly the same places in the same amounts, which meant little need for pipeline operators to re-invest in the business. The Shale Revolution changed all this – new sources of oil and gas required new infrastructure (see Will MLP Distribution Cuts Pay Off?).

MLPs decided to grow, redirecting cashflows from payouts to new projects. K-1 tolerant, income seeking investors were the quintessential long term buyer sought by every CEO. All they wanted was stable income. Although for years MLPs provided this, in 2014-15 many of them seized the opportunity to be growth businesses, which redirected cash away from investors. Alignment of interests was lost. MLPs in aggregate demonstrated that Distributable Cash Flow would be paid to investors only as long as they didn’t have any better uses for it. Payouts were cut, trust was shattered. Today’s sector remains 28% below its August 2014 high, and its recovery offers something for everyone (see Growth & Income? Try Pipelines).

Stable and growing dividends remain highly valued. Although the Alerian MLP ETF (AMLP) has cut its distribution by 30% (see It’s the Distributions, Stupid!), Alerian used to post a chart with 6% average ten year distribution growth.  Index components change, and Alerian was using the historic growth of existing index members regardless of how long they’d been in the index. This introduced a survivor bias, in that MLPs cutting distributions used to be dropped while the newly IPO’d ones they added were typically growing quickly. This confused many, because it failed to match actual investor experience. It seemed that everyone but Alerian knew MLP distributions were being cut. Facing growing criticism (see MLP Distributions Through the Looking Glass), Alerian revised their chart to better match reality.

.avia-image-container.av-1r9wo9k-472ff65638404b4df0dc37999ee7d41e img.avia_image{ box-shadow:none; } .avia-image-container.av-1r9wo9k-472ff65638404b4df0dc37999ee7d41e .av-image-caption-overlay-center{ color:#ffffff; }

However, energy infrastructure overall has provided far more distribution stability than shown by MLPs. The American Energy Independence Index consists of the biggest pipeline companies in America, which are mostly corporations although it includes a few MLPs as well. It yields 5.5% based on 2018 dividends, a payout that is up 10% on 2017. We expect dividend growth of almost 11% next year. While income seeking investors are naturally drawn to attractive yields, the reliability of the payout is critical.

.avia-image-container.av-1anobmg-48322e56652a3a7a39e77ae650804bb2 img.avia_image{ box-shadow:none; } .avia-image-container.av-1anobmg-48322e56652a3a7a39e77ae650804bb2 .av-image-caption-overlay-center{ color:#ffffff; }

The chart shows that Alerian MLP Index dividends fell far more than for energy infrastructure as a whole. Moreover, they still have a long way to recover back to the levels of 2014. Although we think MLP distribution cuts are mostly behind us, the group’s history is one that income seeking investors shouldn’t soon forget. By contrast, American Energy Independence Index dividends dipped but quickly recouped their losses. The members of this index have demonstrated far more reliability with their payouts.

.avia-image-container.av-qyl254-0ec81f4f7b74b2a0e0dda44f8d5ccaeb img.avia_image{ box-shadow:none; } .avia-image-container.av-qyl254-0ec81f4f7b74b2a0e0dda44f8d5ccaeb .av-image-caption-overlay-center{ color:#ffffff; }

The Alerian MLP Index yields 7.3%, although it’s only accessible via structurally flawed MLP-dedicated funds that pay corporate tax (see The Tax Drag on MLP Funds). Because tax expense for such funds flows out of their NAV, in reality, the yield is lower. The energy infrastructure sector’s 5.5% yield is accessible through conventional, RIC-compliant funds with no tax drag. Corporations have managed their cashflows, including payouts, far more reliably than have MLPs. Moreover, those lower payouts have meant more retained earnings to be reinvested back into their businesses.  This is what will drive the 10% annual dividend growth we expect 2017-19, a level MLPs failed to achieve even in the boom years leading up to the 2014-15 collapse.

As the second chart shows, when payouts are cut less in the short run, they grow faster over the long run. Energy infrastructure is a growth business that offers attractive yields. Investors who favor companies with a reliable history of dividends are likely to fare better.

We are short AMLP.


Growth & Income? Try Pipelines

The chart below is a sobering one for pipeline investors. Over the past five years, the S&P has returned 13.1% p.a., versus -2.7% for the Alerian MLP Infrastructure Index (AMZIX). An allocation to AMZIX contributed almost a 16% p.a. performance drag, such that $100 invested in the S&P500 in July 2013 would now be worth $185 rather than $71. The Alerian MLP Fund (AMLP) did 1% p.a. worse than this.

.avia-image-container.av-1ngo9b5-271e175242e59b62e2edd3ce4f9cb063 img.avia_image{ box-shadow:none; } .avia-image-container.av-1ngo9b5-271e175242e59b62e2edd3ce4f9cb063 .av-image-caption-overlay-center{ color:#ffffff; }

Starting in 2014, oil prices collapsed and MLP unit prices followed. As a consequence, energy infrastructure has a correlation with the S&P500 of only 0.63, which makes it an interesting diversifier. Cuts in payouts to fund growth were poorly received by an income-seeking investor base (see It’s the Distributions, Stupid!). Sentiment remains cautious. However, there are growing signs that pipeline companies have turned the corner.

.avia-image-container.av-168pl35-447a7407cd7b786b6d00cdf261b15331 img.avia_image{ box-shadow:none; } .avia-image-container.av-168pl35-447a7407cd7b786b6d00cdf261b15331 .av-image-caption-overlay-center{ color:#ffffff; }

Dividends have started growing again. 2Q18 earnings were full of upside surprises, as higher volumes drove profits. Energy Transfer Partners (ETP) telegraphed a good quarter when discussing its combination with Energy Transfer Equity (ETE), (see Running Pipelines is Easy). Their Distributable Cash Flow (DCF) duly came in 17% ahead of expectations, in part through higher capacity utilization. Analysts expect to see 15% annual growth in DCF over the next two years.

Enterprise Products (EPD) reported a 2Q18 EBITDA beat of 13%. Enlink Midstream, LLC (ENLC) provided higher 2019 guidance. Kinder Morgan (KMI) is reducing leverage faster than expected due to its sale of TransMountain Pipeline to the Canadian government. DCF at Cheniere (LNG) is expected to grow 3 fold over the next two years as Liquefied Natural Gas exports take off. It was hard to find any bad news.

.avia-image-container.av-ieh8kh-b6b867523c5fc6b446e6b3b98588169d img.avia_image{ box-shadow:none; } .avia-image-container.av-ieh8kh-b6b867523c5fc6b446e6b3b98588169d .av-image-caption-overlay-center{ color:#ffffff; }

Many of the biggest MLPs have converted to corporations, which makes the Alerian MLP Indices less representative of the sector than in the past. Last year we launched The American Energy Independence Index, which holds a diversified basket of the largest North American pipeline corporations, along with a handful of big MLPs. It yields over 5%, and we expect DCF growth of 15-20% annually through 2020. This will support healthy dividend growth as well as improved coverage ratios.

This resumption of dividend growth is attracting investors again, which has helped the sector to a higher YTD return than the S&P500.

Energy infrastructure offers a low correlation with the market, as well as being attractively valued with improving fundamentals. Adding pipeline exposure can improve a portfolio’s prospects while adding some diversification.

We are long EPD, ENCL, ETE, KMI.

We are short AMLP.


It’s the Distributions, Stupid!

Jim Carville’s admonition during Bill Clinton’s 1992 run for President was, “It’s the economy, stupid!”

In its August 2018 edition, The Utility Forecaster warns readers to approach MLPs “with caution.” Too risky for income investors is their conclusion. MLP buyers have been badly abused, and Chief Investment Strategist Robert Rapier reminds readers of the many “simplifications” that triggered unwelcome tax bills, as well as the multiple distribution cuts. Without doubt, MLP prices have followed distributions.

In one important respect though, Rapier adopts a simplistic yet incorrect explanation. “…during a long downturn in oil and gas prices, contracts expire and MLPs had to renew agreements under less favorable terms. Many MLPs found themselves doing what was once unthinkable – they had to cut distributions.”

It’s conventional wisdom that the 2014-15 oil collapse hurt pipeline company operating earnings, which caused payout cuts. But the numbers don’t support this narrative. The Kinder Morgan (KMI) chart below shows their Distributable Cash Flow (DCF) per share alongside a significantly more volatile stock. KMI’s DCF per share is little changed from 2015 to 2016, but the share price fell by half. They cut their payout twice: once when combining Kinder Morgan Partners (KMP) with KMI (“simplification”, in which KMP investors received KMI stock with a lower payout as well as a tax bill); and again later when KMI cut its dividend. KMI was learning that MLP investors want income over the promise of growth.

.avia-image-container.av-jz5pbz-ab04edb85ae7933d057934f28fe27824 img.avia_image{ box-shadow:none; } .avia-image-container.av-jz5pbz-ab04edb85ae7933d057934f28fe27824 .av-image-caption-overlay-center{ color:#ffffff; }

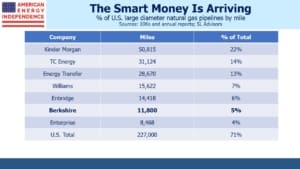
To fund their growth projects, KMP was paying out most of its DCF and then seeking to recoup some of it through secondary offerings.  In effect, investors were being asked to reinvest a portion of their distributions back into the company. Many holders found this unattractive, since they spend the income. So KMP’s yield rose, which made issuing equity too expensive. KMI concluded MLP investors no longer suited their purpose, and left to become a corporation. Today, KMI yields 5.1%, with a payout more than 2X covered by its $4.7BN DCF.

MLP buyers can be focused on distributions to the exclusion of anything else. Two recent examples highlight:

In late July, American Midstream Partners (AMID) slashed its distribution by 75% so as to, “…significantly reduce leverage, provide capital for strategic growth opportunities, and create long-term value.” Although these all sound like desirable objectives for a total return investor, AMID’s stock fell 43%.

Meanwhile, Hi-Crush Partners (HCLP) tripled its distribution and now yields 23%. The higher payout is unlikely to persist, but if it’s sustained for a year the company will convert to a corporation. Whether or not this is good for investors, its stock rose 28% on the day of the announcement.

MLP investors want their income.

The chart from Bank of America is even more striking. On the MLPs they cover, they show steadily growing EBITDA with improving leverage, alongside a declining Alerian MLP Index. Falling MLP distributions clearly drove index performance more than improving financials.

.avia-image-container.av-10zoghr-b04696c9a3e335708761f4a632692d1d img.avia_image{ box-shadow:none; } .avia-image-container.av-10zoghr-b04696c9a3e335708761f4a632692d1d .av-image-caption-overlay-center{ color:#ffffff; }

EBITDA vs Leverage

It’s as if MLP investors look at payouts and little else.

Probably the simplest measure of MLP payouts is to look at dividends on the Alerian MLP ETF (AMLP), which are 30% lower than in 2015.

.avia-image-container.av-25kzun-aff82ce80a769a809c7b65abbb9437f0 img.avia_image{ box-shadow:none; } .avia-image-container.av-25kzun-aff82ce80a769a809c7b65abbb9437f0 .av-image-caption-overlay-center{ color:#ffffff; }

There were nonetheless some companies whose operating performance sagged. Plains All American (PAGP/PAA) relied in part on its Supply and Logistics division to support its distribution. When arbitrage opportunities dried up in 2016-17, almost $800MM in EBITDA evaporated, leading to a second distribution cut. Today, increased Permian volumes are boosting cashflows once more. On last week’s earnings call they forecast 2019 EBITDA growth of 14-15%.

But episodes such as PAGP were the exception – operating results for the most part held up.

As memories of the 2014-15 bear market recede, we believe the conventional explanation for it will shift. MLP prices didn’t collapse because of weak operating performance. They fell because DCF was redirected to pay down debt and finance new projects, all to achieve growth (see Will MLP Distributions Pay Off?). Income seeking MLP investors don’t want their income redirected in this way. Hence, persistently weak MLP prices which have led the shift to a corporate structure for those companies wishing to access a far larger pool of buyers.
BofA Merrill is forecasting 2016-20 distribution growth for 27 of the 32 midstream infrastructure names they cover. JPMorgan forecasts 6-10% growth 2017-19. We expect our American Energy Independence Index to grow its dividends by 9% this year and 11% in 2019.

These forecasts are supported by growing pipeline demand. There are bottlenecks in moving crude oil and natural gas out of the Permian Basin in west Texas, and in getting natural gas out of the Marcellus in Pennsylvania. New pipelines to transport Canadian heavy oil from Alberta continue to face political challenges. The Shale Revolution is driving volumes higher.

With pipeline demand and dividends both growing, the sector is poised to continue its rally.

We are invested in KMI and PAGP. We are short AMLP.

Includes corrected text and a revised chart compared to an earlier version, with respect to Kinder Morgan