Year-End Roundup

Heading into year’s end, a number of interesting stories caught my attention. Energy Transfer (ET) rarely avoids conflict and is embroiled in a dispute with three pipeline developers in Louisiana who sought crossings over Gulf Run Pipeline, owned by ET. Momentum Midstream, one of the developers with a $1.6BN project, accused ET of unfair trade practices. ET has also sought temporary restraining orders against Williams Companies and DT Midstream.

Pipelines routinely have to cross over or under each other as they crisscross the country. Momentum argues that without competition, ET could control up to 80% of the pipeline capacity supplying LNG exports in Louisiana. ET argued that the crossings sought were numerous, threatened pipeline safety and disregard ET’s exclusive ownership over certain stretches of land.

A court ruling is awaited. ET’s well-earned bare-knuckle approach to business hasn’t hurt the stock, +27% this year.

Morgan Stanley continues to report attention around the Alerian MLP Infrastructure Index (AMZI), which AMLP tracks (albeit not very well). The shrinking pool of MLPs is causing AMZI to be more concentrated and even to move beyond midstream infrastructure by incorporating USA Compression Partners, LP. At their recent rebalancing, AMZI publisher Vettafi retained the 12% position cap. Morgan Stanley continues to warn that AMZI might eventually relax its 12% cap or, more radically, AMLP might adopt a RIC-compliant index which would limit its MLP holdings to 25% (versus 100% now).

Such changes could create turmoil in MLP names. But Vettafi could also do nothing, reasoning that if investors didn’t like the fund’s current structure they wouldn’t own it.

Kinder Morgan’s (KMI) prescient sale of the TransMountain (TMX) pipeline project to Canada’s federal government in 2018 (see Canada’s Failing Energy Strategy) looks better every month. Facing unexpectedly hard rock, TMX recently asked the regulator for permission to drill a smaller-diameter pipe through a 1.4 mile section. The regulator turned them down, causing TMX to warn of a further two year delay if they are forced to proceed with the wider diameter. Canadian Natural, the country’s biggest oil producer, has urged the regulator to give its approval. Meanwhile the Trudeau administration approved another C$2BN in loan guarantees for a project quickly exceeding triple the cost anticipated when KMI made its well-timed exit.

A drought in Panama has impeded ship traffic through the canal in recent weeks. This is because the locks rely on supplies of inland fresh water to operate. As a result, Chile and some Asian buyers have reduced their imports of US gasoline from the gulf coast, depressing prices. The alternative route around the tip of South America is more costly and slower. Interestingly though, an LNG executive recently told us that Panama sets the canal tarrif close to the break-even point for ships considering the alternative. For US LNG exports to Asia, this suggests that the long route takes longer but doesn’t cost that much more.

In Oklahoma, fans of David Grann’s Killers of the Flower Moon will have been fascinated to see the Osage Nation win a victory against a wind farm built by Italian energy company Enel. A decade-long legal fight was settled when U.S. Court of International Trade Judge Jennifer Choe-Groves ruled eighty wind turbines had been illegally built. They have to be removed. You can find a more complete telling of this unusual tale here.

.avia-image-container.av-rbqzvl-c115256f64132832b8d0d4a30c0087fe img.avia_image{ box-shadow:none; } .avia-image-container.av-rbqzvl-c115256f64132832b8d0d4a30c0087fe .av-image-caption-overlay-center{ color:#ffffff; }

We know oil production has become more efficient over the years, but this chart of rigs versus production back to 1980 is a compelling visual. Few forecasters saw US oil production reaching a new high this year. But it did.

Finally, the slowdown in US EV sales continues to draw unwelcome news coverage. They’re still growing, but at a declining rate. EVs are also taking dealers about three weeks longer to sell than conventional cars. Sales tend to be concentrated in blue counties and states. Across the US EVs have an 8% market share, but in California it’s 24%. In Michigan it’s 3%.

The Administration wants to require that EVs represent 2/3rds of all automobile sales by 2032. Canada is planning to require all auto sales be zero emission by 2035.

The EPA estimates that the typical passenger car emits about 4.6 Metric Tonnes (MT) of CO2 per year. The Inflation Reduction Act values CO2 pulled out of the ambient air and permanently buried via Direct Air Capture (DAC) at up to $180 per MT in tax credits. This is enough to have encouraged Occidental to build the world’s biggest DAC plant and CEO Vicki Hollub is bullish on the technology.

It looks as if public policy is to force EV adoption by making conventional cars scarce. But if you’d prefer to own just one car, not two like most EV owners I know (a regular one for long journeys), a carbon tax based on 2X the DAC credit would impose a $1,656 annual cost on the owner of a gas-powered car. Some would willingly pay that for the convenience of easy refuelling and assurance that inadequate charging infrastructure wouldn’t force them to have their EV transported back home on a truck.

I would be one of those people willing to pay the $1,656 annually. It’s why a carbon tax would be better than the current method of subsidies, tax credits and regulation. It gives people a choice.

We have three have funds that seek to profit from this environment:
Energy Mutual Fund

Energy ETF

Inflation Fund


Higher Despite Retail Selling

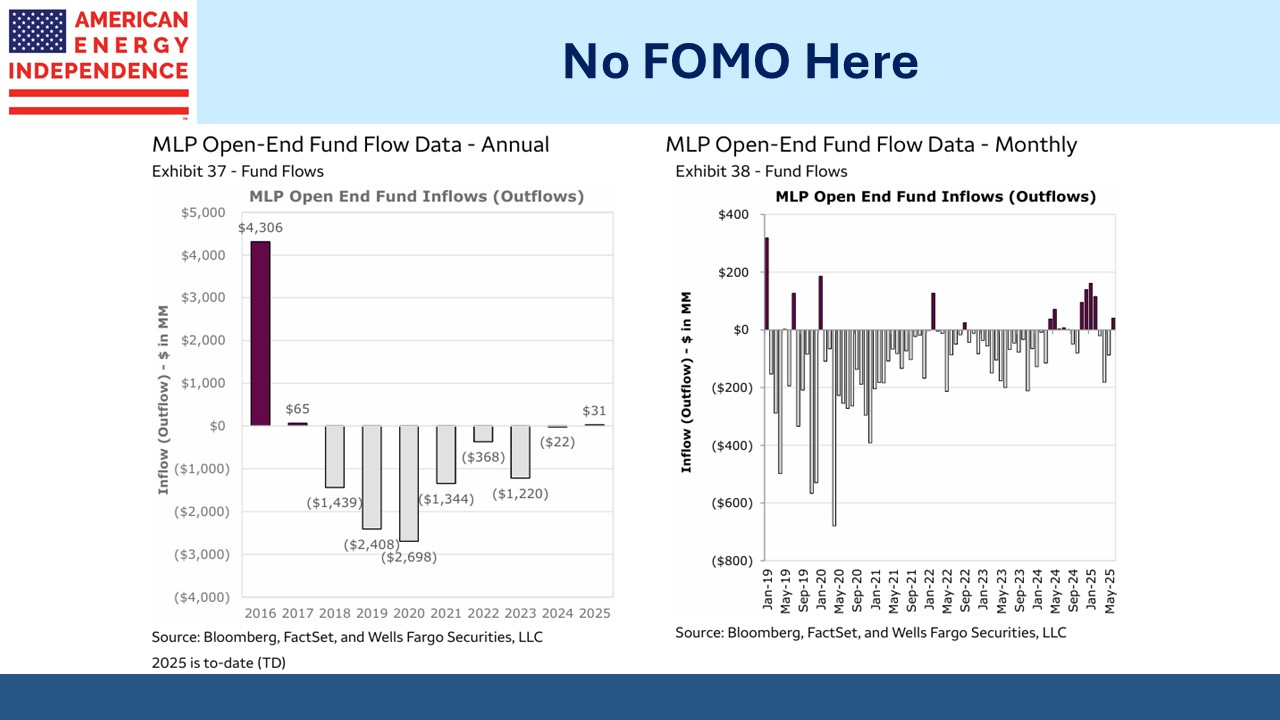
The only negative about the pipeline sector today is the direction of fund flows. It’s regularly covered in this blog and a topic that continues to mystify us. Although we’re still awaiting data for the last two months of 2023, it’s almost certain to be the fifth year of the last six during which retail investors exited MLP funds.

This category includes both the non-RIC compliant MLP-only funds like the Alerian MLP ETF (AMLP) as well as other RIC-compliant funds such as the ones we run. The $4.6BN that investors withdrew in 2020 can fairly be attributed to the pandemic. Leveraged funds were partly to blame (see MLP Closed End Funds – Masters Of Value Destruction).

.avia-image-container.av-2kkx1h0-19e1c5731545b0618d3bb4ef308aacd8 img.avia_image{ box-shadow:none; } .avia-image-container.av-2kkx1h0-19e1c5731545b0618d3bb4ef308aacd8 .av-image-caption-overlay-center{ color:#ffffff; }

But the outflows continued the following year even as the sector maintained its recovery. 2022 was an exception, perhaps because nine of the eleven S&P sectors were down as the Fed aggressively tightened policy. Energy was +64% and Utilities scraped out a 1% return.

The monthly data tells the same story, with only 19 out of 70 months since 2018 being positive.

Even more incongruous is that performance has been good. Four of the past six years have been positive, even though there was net retail buying in only one of those.

For investors, the 2020 market collapse caused by the pandemic was sharp but mercifully brief. The S&P500 finished the year +18%. The recovery was well under way entering 2021, as the vaccine rollout progressed. You’d think those pipeline investors not panicked into selling by the Covid collapse and blow up of closed end funds would be unshakeable. Apparently, they weren’t.

.avia-image-container.av-24cwy6s-5c567473095d1789d72228bc1be73336 img.avia_image{ box-shadow:none; } .avia-image-container.av-24cwy6s-5c567473095d1789d72228bc1be73336 .av-image-caption-overlay-center{ color:#ffffff; }

Over the past three years, the S&P Energy sector has easily beat the other ten S&P sectors, returning 36% pa. The “Magnificent Seven” with their AI theme have left the other 493 members of the S&P500 behind. But in spite of this, the S&P Technology sector has lagged energy considerably, delivering 15% pa.

Midstream energy infrastructure also beat the other ten sectors over three years, with 25% pa. There is this incongruity in which retail investors are selling but prices are nonetheless rising. Usually fund flows follow performance and even accentuate the prevailing trend.

.avia-image-container.av-1pm75jo-e9a15ea4afa24b417479ab739d42b9c6 img.avia_image{ box-shadow:none; } .avia-image-container.av-1pm75jo-e9a15ea4afa24b417479ab739d42b9c6 .av-image-caption-overlay-center{ color:#ffffff; }

The retail sellers are clearly missing out on the pipeline sector’s strong performance. Some are probably motivated to avoid energy because of concerns about climate change, and that must also apply to the legions of investors who choose not to commit capital to the sector. This is in spite of strong operating performance and declining leverage, routinely noted on this blog. In rejecting midstream energy infrastructure, these investors exhibit the antithesis of irrational exuberance – call it irrational gloom.

Pipeline companies have taken the other side of the retail selling. Just one company, Cheniere, has offset the retail outflows from MLP funds with their buyback program in 2023. Adding back those from Kinder Morgan, Targa Resources, Enterprise Products and Energy Transfer results in buybacks of more than double the net outflows. The less informed have been selling to the better informed. It’s why the sector has performed so well in spite of investor selling.

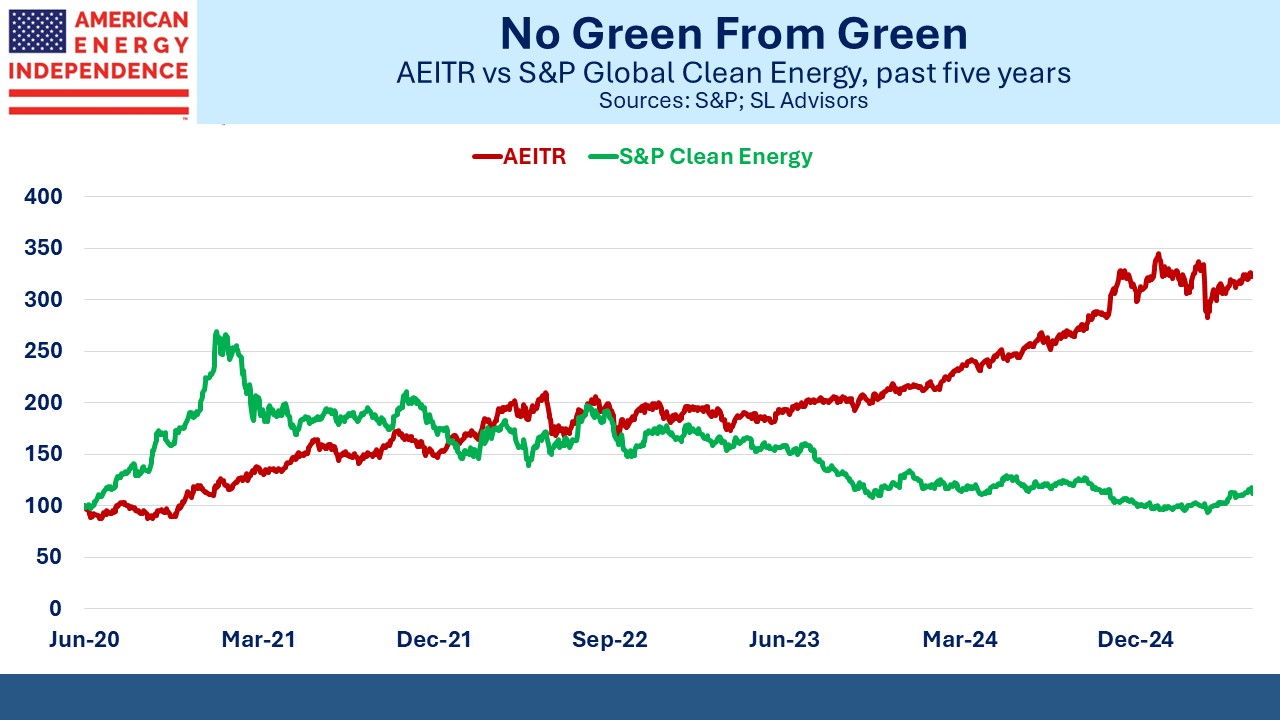
Perhaps those who have been underweight traditional energy for up to the last three years will finally reconsider as we enter 2024.  If they’ve been allocated to clean energy they’ll have done even worse.

.avia-image-container.av-zv53hw-44ff08da9252ce13bfafa4728646e0a6 img.avia_image{ box-shadow:none; } .avia-image-container.av-zv53hw-44ff08da9252ce13bfafa4728646e0a6 .av-image-caption-overlay-center{ color:#ffffff; }

The S&P Global Clean Energy Index (SPGTCED) has done worse than any of the S&P’s eleven sectors since 2021 and finished behind all of them in two of the past three years. Even a 1% bias within an investor’s energy allocation towards clean energy would have cost 0.5%pa in underperformance.

We’re open to investing in renewables if only we could identify profitable opportunities. Stable visible cashflows are nowhere to be found in solar and wind. Many of the investors who reject traditional energy on non-economic grounds use the same analysis to favor SPGTCED. But they’ve found that Federal subsidies and a conviction that they’re doing the right thing can’t overcome poor economics and the cost of intermittency. If the prospects for steady profits improve we’ll revisit, but don’t feel we’ve missed anything so far.

Pipeline companies will continue their buybacks next year, continuing to offset the net fund outflows. And if retail investors merely stop selling that should provide a further boost.

This blog can be accused of being a persistent cheerleader for the sector. But for the past three years, that advice has aligned with results. We’re optimistic that 2024 will be similar.

.avia-image-container.av-jb66yc-16958ca8af385d48f16daca8c0e7a7aa img.avia_image{ box-shadow:none; } .avia-image-container.av-jb66yc-16958ca8af385d48f16daca8c0e7a7aa .av-image-caption-overlay-center{ color:#ffffff; }

We have three have funds that seek to profit from this environment:
Energy Mutual Fund

Energy ETF

Inflation Fund


The MLP Yuletide Spirit

This time of year usually prompts a blog post on MLP seasonals. It’s been a reliable topic (see 2015’s Why MLPs Make a Great Christmas Present or 2016’s Give Your Loved One an MLP This Holiday Season). The Alerian MLP Infrastructure Index (AMZI), which is tracked by the Alerian MLP ETF (AMLP) has long displayed a pronounced January effect. Individual investors tend to assess their portfolios around the calendar year end, but the K1s accentuate this effect for MLPs.

If you’re considering selling an MLP, doing so in December instead of January avoids an extra K1 for the stub year. Similarly, a purchase delayed from December to January avoids a one month K1 from the prior year. Using AMZIX data since 1996, the January effect is clearly visible.

.avia-image-container.av-2cf7wq4-2a8b138826f47ac379b8b3699aa5897b img.avia_image{ box-shadow:none; } .avia-image-container.av-2cf7wq4-2a8b138826f47ac379b8b3699aa5897b .av-image-caption-overlay-center{ color:#ffffff; }

The Covid pandemic distorted the pattern somewhat. In March 2020 the AMZIX collapsed, closing the month –48%. It was a miserable time to be invested in the sector. The following month’s rebound was +48%, although that still left the index –34% YTD. Some excessively leveraged operators were partly to blame (see MLP Closed End Funds – Masters Of Value Destruction).

These two months dominate the average March and April returns, rendering the other months seemingly inconsequential.

Five years ago it looked as if the seasonal pattern was weakening (see MLPs Lose That Christmas Spirit) but in hindsight we were just looking back on a period of poor performance during which almost every month was flat or down.

.avia-image-container.av-280jw0c-59ccbad5d5023f8908bc0f55e5735954 img.avia_image{ box-shadow:none; } .avia-image-container.av-280jw0c-59ccbad5d5023f8908bc0f55e5735954 .av-image-caption-overlay-center{ color:#ffffff; }

Seasonals are now back in vogue. Sell-side research routinely mentions the January effect. Morgan Stanley noted that year-end, “historically has pointed to positive performance capture in late December through January.” A strategy of going long at the end of November for two months has an average return of +2.9%, roughly a third of the annual return. Morgan Stanley found that since 1996 MLPs have “posted a positive total return from December 15 through the substantive balance of January,” constituting 41% of the total return during that time.

.avia-image-container.av-1ql7fvw-626d2d31ee2e5411fb67d02da7da7c61 img.avia_image{ box-shadow:none; } .avia-image-container.av-1ql7fvw-626d2d31ee2e5411fb67d02da7da7c61 .av-image-caption-overlay-center{ color:#ffffff; }

It has been possible to earn much of the sector’s return with comparatively short holding periods arranged around year’s end.

The effect is less pronounced for the American Energy Independence Index (AEITR), probably because it limits MLPs to 20% so as to be investable in a fund without being taxed as a corporation. Institutions are much less likely to be driven by the calendar, not least because their investment returns are mostly not taxed. The S&P500 exhibits no meaningful seasonal pattern.

.avia-image-container.av-47000c-cbdc99c3f0439805df10f0834b02fdbe img.avia_image{ box-shadow:none; } .avia-image-container.av-47000c-cbdc99c3f0439805df10f0834b02fdbe .av-image-caption-overlay-center{ color:#ffffff; }

Less appreciated is the quarterly pattern around payouts. MLP investors love their distributions, which are generally paid in the first month of the quarter. Because of the distortion caused by Covid in 2020, it’s helpful to look at median returns rather than average. Over the past five and ten years this quarterly pattern is generally visible. For the past decade January was positive seven times and April eight. Oddly, July doesn’t show any seasonality.

Even with the median return, April still stands out as an appealing month. Perhaps a few investors annoyed at the delayed tax filing often caused by K1s decide to sell just as soon as they receive their April distribution. This was even true during the 2013-18 period when no other seasonal pattern was visible. I’ve personally found April to be the most interesting time to make seasonal trades in this sector.

Few MLP investors will find trading their positions appealing. The point of MLPs is to enjoy those tax deferred distributions for as long as possible, putting off indefinitely the recapture of taxes generated by a sale. These holders wouldn’t be interested in the possibility of a quick buck at the risk of an accelerated tax obligation.

In the spirit of open-mindedness and in spite of its numerous shortcomings routinely described on this blog, I can suggest AMLP as a temporary trading vehicle for this purpose. Since it is 100% MLPs it reflects the same seasonal pattern as its index, AMZI. In the past I have found it preferable to use options on AMLP rather than buying or selling the ETF directly. I already have plenty of exposure to the sector, so concluded that for a trade seeking to pick up a few per cent it’s imprudent to add any more long exposure.

In Sunday’s blog I incorrectly said Vettafi, who publishes AMZI, had dropped the 12.5% position limits in their quarterly rebalancing and allowed Energy Transfer to remain at 19.5%, a level it reached both through appreciation and the acquisition of Crestwood. It turns out they were just slow to update their website. TMX Group  announced their acquisition of Vettafi last week. Perhaps they were distracted.

.avia-image-container.av-jyxdyk-1dbe3b697a7aa5d213b1e616532c9b8a img.avia_image{ box-shadow:none; } .avia-image-container.av-jyxdyk-1dbe3b697a7aa5d213b1e616532c9b8a .av-image-caption-overlay-center{ color:#ffffff; }

We have three have funds that seek to profit from this environment:

Energy Mutual Fund

Energy ETF

Inflation Fund


Safely, Cautiously Bullish

There’s no particular reason why a 12 month outlook is more important at year’s end, but that is nonetheless when research analysts take stock of past forecasts and offer new ones. In late 2022 many economists were forecasting a recession by now. In his press conference on Wednesday, Fed chair Jay Powell retained enough humility to avoid it looking like a victory lap. The FOMC’s own forecasts have often been inaccurate in the past (see Policy Errors On Interest Rates And Energy). As he once said himself forecasters should be humble and have much to be humble about. The Fed’s critics are silenced for now.

The 2024 outlook is described as “cautious” for midstream by Wells Fargo, and “mixed” although “tactically constructive” for energy more broadly by JPMorgan. Morgan Stanley says, “We see a path higher post the pullback, but risks still exist.” Irrational exuberance is nowhere to be seen.

Perhaps analysts are chastened by S&P Energy ETF (XLE), which has had a disappointing year; at -1.35% it’s 24% behind the S&P500. Midstream has been the standout within the energy complex. The American Energy Independence Index (AEITR) is +14% YTD. MLPs have been especially strong, with Energy Transfer (ET) +26%. The many financial advisors we talk to who own ET should be happy.

Morgan Stanley notes that energy stocks are at a 55% discount to the S&P500, 2X the average over the past decade. They are also bullish on crude oil, like most analysts, seeing Brent averaging $85 next year. There’s just not enough E&P capex to cover well depletion plus demand growth. This has been the bull thesis on oil for some time. Perhaps now it will work.

The Fed’s latest Summary of Economic Projections (SEP) includes three rate cuts next year, although Powell reminded journalists that this isn’t a plan, simply the aggregate guidance from 19 FOMC members, all but two of whom expect at least one cut. PCE inflation is expected to reach 2.1% by 2025 with unemployment historically low at 4.1%. Phillips Curve adherents will find fault with this rosy outlook, but economists and the interest rate futures market look for a “soft” landing next year, dubbed by the WSJ the “Most Crowded Trade on Wall Street.”

.avia-image-container.av-18l53wb-a6af6b38e483bb97a3a115bdf810c295 img.avia_image{ box-shadow:none; } .avia-image-container.av-18l53wb-a6af6b38e483bb97a3a115bdf810c295 .av-image-caption-overlay-center{ color:#ffffff; }

Dividend yield plus dividend growth plus buybacks is a good way to forecast cash returns, exclusive of any capital appreciation, for pipelines. Wells Fargo sees 7% + 4% + 0-1% on this metric, providing a solid 11-12% total return forecast for 2024.

Cash became a legitimate investment choice this year. With a couple of brief exceptions prior to the 2020 pandemic, the last time cash earned a positive real return of any consequence was in 2008 before the Great Financial Crisis.

CPI is currently running at 3.1% (4.0% ex food and energy). Cash was trash for so long that for a significant percentage of today’s investors that’s all they’ve experienced. But treasury bills yielding 2% or so above inflation seems like a decent choice for anyone ambivalent about committing more long term capital to stocks. Occasionally investors have questioned why midstream infrastructure yields of 7% are to be preferred over a riskless 5.25%.

The answer lies in the Fed’s apparent pivot on interest rates, since this should further highlight the sector’s yield. 5.25% treasury bill yields look increasingly temporary. If so, midstream stocks may provide some capital appreciation on top of the projected 11-12% cash return.

Vettafi, which publishes the Alerian MLP Infrastructure Index (AMZI), dropped their 12% position limit in their quarterly rebalancing last week. This avoided the reduction of positions in several MLPs, notably ET which has reached 19.5%, partly because of its acquisition of Crestwood.

Had the 12% limit been maintained, rebalancing would have resulted in over $500MM in ET shares being sold by the Alerian MLP Fund (AMLP) which tracks AMZI. XLE’s two biggest holdings, Exxon Mobil and Chevron, represent 39% of that fund. Energy investors like their bets concentrated. AMLP is adopting that model.

ET is 5% of the AEITR, more representative of its share of the sector’s market cap.

The COP28 ended with a commitment to “transition away” from fossil fuels – a pledge to phase them out failing to draw enough support. They currently provide 80% of the world’s energy.

Solar and wind are 3%. They’re not yet growing fast enough to even satisfy the world’s increasing demand for energy. The International Energy Agency reported that coal consumption reached a new record of 8.5 billion metric tonnes this year, up 1.4% from last year.

Everybody should want to see coal phased out. It’s the most prolific source of CO2 emissions per unit of energy produced, and also creates harmful local pollution. Yet India burned 8% more this year and China 5%, due to growing electricity demand and weak hydropower output.

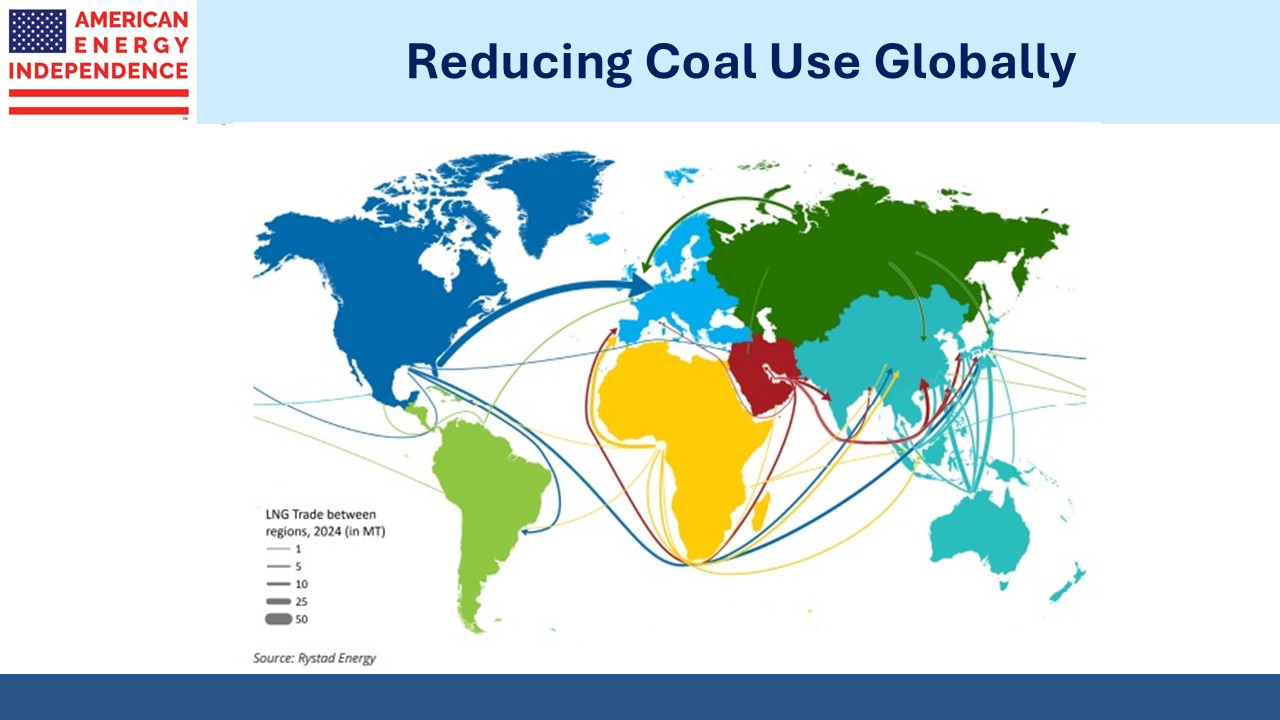
North American LNG exports look set to double over the next four years as several new export facilities become operational. That will help to curb the emerging world’s insatiable appetite for coal.

.avia-image-container.av-n9ad0b-09c62038a0ff6491813adbc758bd16e7 img.avia_image{ box-shadow:none; } .avia-image-container.av-n9ad0b-09c62038a0ff6491813adbc758bd16e7 .av-image-caption-overlay-center{ color:#ffffff; }

We have three have funds that seek to profit from this environment:
Energy Mutual Fund

Energy ETF

Inflation Fund


Pipelines Shed Their Oil Sensitivity

Brent crude currently trades for around $4 per barrel less than a year ago. Back then Goldman Sachs published another highly convincing research report predicting higher oil driven by increasing demand and chronic underinvestment in new supply. Since then Jeff Currie has left the firm, hopefully not because of his not yet vindicated commodity super cycle thesis. Plenty of other firms were bullish. JPMorgan was cautiously looking for prices to be $6 higher. Few were loudly negative.

It’s therefore been an opportune moment for midstream energy infrastructure, as represented by the American Energy Independence Index (AEITR) to separate itself from oil and move higher.

.avia-image-container.av-2zydld2-e8129d5e176afd884774f5f40146841e img.avia_image{ box-shadow:none; } .avia-image-container.av-2zydld2-e8129d5e176afd884774f5f40146841e .av-image-caption-overlay-center{ color:#ffffff; }

The chart shows the two started to move more synchronously in 2015. This was roughly when the global oil market woke up to the increased supply provided by the US shale revolution. Pipeline companies had increased their capex to support higher volumes. This increased their sensitivity to oil prices, exacerbated by increasing leverage.

The “toll road” model of MLPs became deeply discredited. Distribution cuts followed. Corporations fared far better than MLPs. The current quarterly distribution of the Alerian MLP ETF (AMLP) remains 41% below its 2016 peak. This distribution is also now all classified as ordinary income, rather than as a return of capital which acts as a deferral of taxes (see AMLP Fails Its Investors Again).

The pandemic brought another co-ordinated swoon in oil prices and pipeline stocks, although both soon recovered, leaving only the hapless investors in closed end MLP funds with any lasting damage since they’d had to delever at the lows (see MLP Closed End Funds – Masters Of Value Destruction).

.avia-image-container.av-2nywr9i-6df39159037ea2cf6cdf395962c06286 img.avia_image{ box-shadow:none; } .avia-image-container.av-2nywr9i-6df39159037ea2cf6cdf395962c06286 .av-image-caption-overlay-center{ color:#ffffff; }

The most recent 100-day correlation of oil and pipelines is close to the lowest in five years. Midstream earnings have been reliably good every quarter this year, with companies regularly meeting or beating expectations and offering improved forward guidance. This is what’s behind the 14% YTD return, meaningfully ahead of the S&P Energy ETF (XLE) which is –3% YTD.

Although it’s not blindingly obvious from the correlation chart, the weaker recent relationship between crude prices and pipeline stocks has coincided with declining leverage. This makes sense – stronger balance sheets are better able to withstand fluctuations in throughput. We have always believed the sector’s sensitivity to commodity prices reflected the vagaries of investor sentiment more than revised expectations of cash flows. But as Debt:EBITDA has fallen back below 4.0X to 3.5X on its way towards 3.0X, the frustrating link with oil has moderated.

.avia-image-container.av-20ov05i-a3917af2521a185ea62847ae541f6af4 img.avia_image{ box-shadow:none; } .avia-image-container.av-20ov05i-a3917af2521a185ea62847ae541f6af4 .av-image-caption-overlay-center{ color:#ffffff; }

This has been accompanied by US crude output that recently set a new record of 13.2 Million Barrels per Day (MMB/D). Consensus early this year was that US production would grow slowly given the declining quality of undrilled shale wells and continued capital discipline. But E&P companies are demonstrating improved capital efficiency, producing more per dollar of capex. Chevron CEO Mike Wirth recently made this point on CNBC when Becky Quick asked why capex was lower than in recent years in spite of the recovery in prices and Administration pleas to pump more (for now, anyway).

.avia-image-container.av-1p5tqcm-b9aaf19177d6deaef69d5283b282c7a2 img.avia_image{ box-shadow:none; } .avia-image-container.av-1p5tqcm-b9aaf19177d6deaef69d5283b282c7a2 .av-image-caption-overlay-center{ color:#ffffff; }

Investors committing capital to the sector understand that current 6-7% yields are excessive given the declining risk profile. Infrastructure assets with visible, stable cashflows have drawn buyers this year even with the Fed raising rates.

.avia-image-container.av-18cibly-c5c2b655309c5566a667e5a69aefdb42 img.avia_image{ box-shadow:none; } .avia-image-container.av-18cibly-c5c2b655309c5566a667e5a69aefdb42 .av-image-caption-overlay-center{ color:#ffffff; }

Tellurian (TELL) CEO Charif Souki was just ousted from Tellurian, the second time an LNG company he founded has given him the boot. TELL has struggled to get their Driftwood LNG facility started, in large part because Souki’s long term bullish view on global natural gas prices led to TELL retaining price risk on their liquefaction contracts. The consequent higher risk profile has made financing harder to obtain. Delays have allowed buyers to cancel contracts, further imperiling the company’s ability to raise capital.

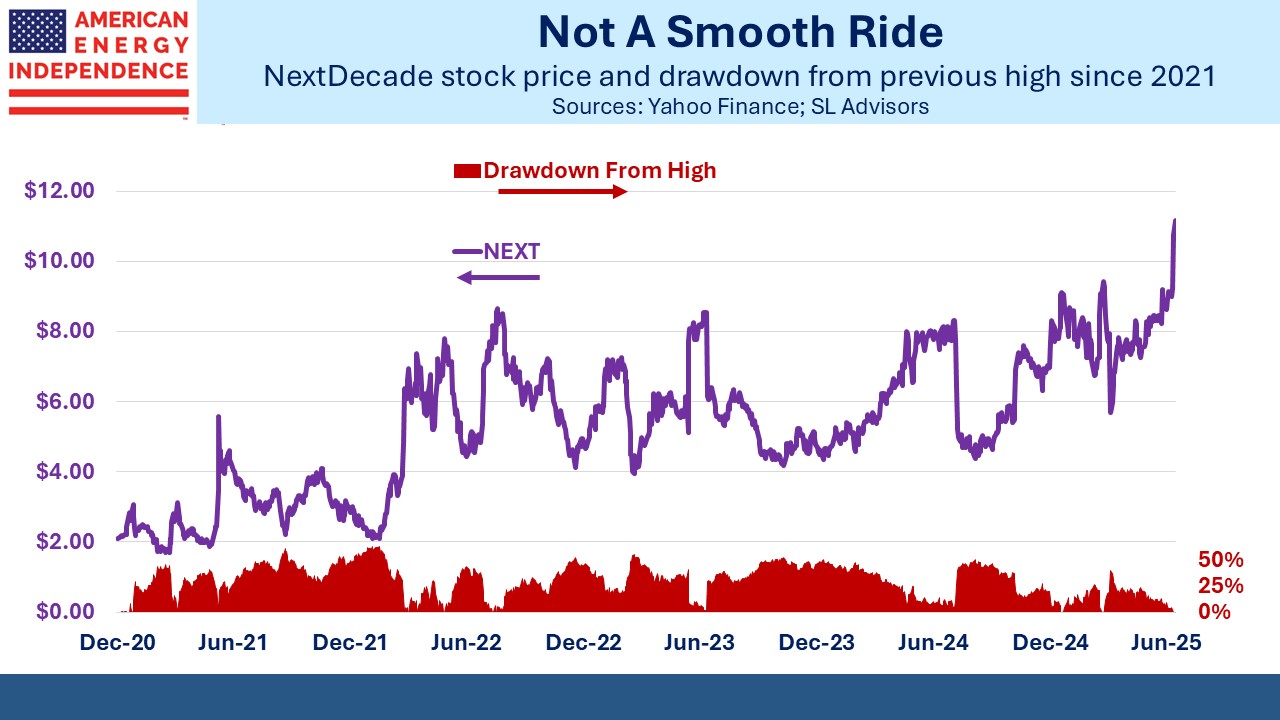
The contrast with NextDecade (NEXT) is striking. Two years ago both companies were signing long term contracts to supply LNG and negotiating with investors for the capital to build their respective greenfield LNG terminals. Breakthroughs and disappointments caused sharp moves in both stocks. But NEXT achieved Final Investment Decision (FID) on their Rio Grande facility in the summer. The market has become steadily more skeptical that TELL will similarly reach FID on their Driftwood project.

Last month TELL warned investors there was substantial doubt about its ability to remain a going concern.

Carl Icahn figured long ago that Souki was a visionary but not the guy you want running the business, which led to Souki’s ouster from Cheniere in 2015. His compensation has been notoriously high and divorced from tangible results. He was recently paid $20 million (watch Tellurian Pays For Performance in Advance). The board finally had enough. Souki’s oversized risk appetite and compensation persuaded us and many others to invest elsewhere a long time ago.

.avia-image-container.av-s1ncme-e5258f7f71453cd0459fd9062428e7a9 img.avia_image{ box-shadow:none; } .avia-image-container.av-s1ncme-e5258f7f71453cd0459fd9062428e7a9 .av-image-caption-overlay-center{ color:#ffffff; }

We have three have funds that seek to profit from this environment:
Energy Mutual Fund

Energy ETF

Inflation Fund


Report From Wells Fargo Conference

SL Advisors partner Henry Hoffman spent a couple of days last week at the Wells Fargo Midstream and Utilities Symposium. He had the opportunity to meet with many of our portfolio companies and drew some useful insights.

Below are Henry’s notes from the event.

Chatter at the Conference:

Throughout the one-on-one meetings, hallway conversations, and mealtime discussions, Equitrans (ETRN) was a hot topic. Everyone seemed intrigued by the article published last Friday, hinting at a possible sale of the company. Questions arose: had they received a tempting offer, prompting them to explore broader interest? And if so, who might the potential buyer be? Could a deal materialize before the Mountain Valley Pipeline project’s valves were even turned on? One CEO humorously referred to ETRN as “eye candy for anyone who looks at a map.” Speculation was rampant, with my personal favorite theory coming from an analyst at a hedge fund who suggested they might have received an offer from Energy Transfer, sparking the “leak” for Williams to swoop in as a white knight defensive bidder against ET’s potential encroachment into Williams’ territory. The conference buzzed with theories and excitement, and the possibility of a bidding war for ETRN could inject fresh energy into the midstream sector.

Editor’s Note: Wells Fargo thinks Kinder Morgan may also be an interested buyer.

Most Impressive Management of the Conference:

Cheniere’s CFO, Zach Davis, delivered a meticulously calculated approach to value creation at Cheniere. Their disciplined strategy has allowed them to offer LNG liquefaction rates at a substantial premium compared to competitors, with no trouble filling new capacity slots to the satisfaction of existing customers. Cheniere’s ability to generate surplus free cash flow provides them with significant flexibility for investments in additional trains, debt reduction, or share buybacks, all geared towards enhancing shareholder value.

.avia-image-container.av-m6vwgs-b7a06d170c8f0f40b9a6c813e774e28e img.avia_image{ box-shadow:none; } .avia-image-container.av-m6vwgs-b7a06d170c8f0f40b9a6c813e774e28e .av-image-caption-overlay-center{ color:#ffffff; }

Topic That Left Me Puzzled:

A surprising revelation at the conference was that Carbon Capture, Utilization, and Storage (CCUS) is progressing more slowly than anticipated. Despite the potential for substantial financial incentives from Congress, there appears to be a lack of urgency from the Biden administration in providing guidance and clarity. Consequently, there have been fewer Class 6 wells drilled than expected. This came as a surprise since one might have assumed that drilling vertical wells and injecting CO2 would be a straightforward geological matter, especially without the pushback from anti-fossil fuel groups, given that CCUS directly involves capturing CO2. The expected surge in CCUS activity after the Inflation Reduction Act has yet to materialize, and the industry seems to be off to a slow start.

#1 Misunderstood Story:

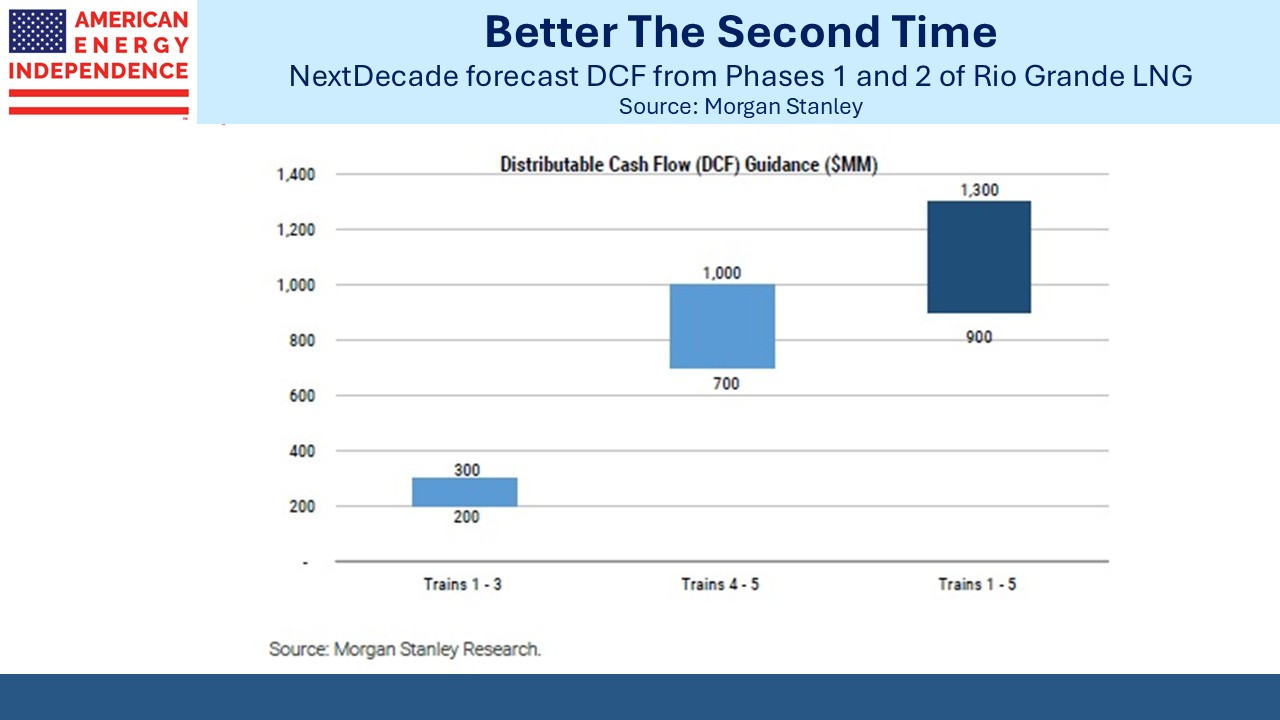
Ironically, the simplest narrative appears to be the most misunderstood investment opportunity in the industry. NextDecade’s (NEXT) CEO, Matt Schatzman, outlined the case for the first three trains (Phase 1) at the Rio Grande site in South Texas as laying the foundation for a massive LNG facility akin to Cheniere’s. Phase 1 brought in strategic partner Total Energies, a lending syndicate of 30 major banks, EPC partner Bechtel, and equity partners, including premier private equity infrastructure fund Global Infrastructure Partners (GIP), GIC (Singaporean sovereign wealth fund), and Mubadula (the sovereign wealth fund of the Emirate of Abu Dhabi). These partnerships enhance the certainty of additional trains, which promise significantly higher economics for NEXT.

Phase 1’s estimated cash inflow of ~$250 million for all three trains translates to roughly $83 million per train. By contrast, Trains 4 and 5 are projected to yield $700-$1 billion in cash flows or approximately $425 million per train, including the option for equity partners to participate. Furthermore, NEXT has the land available for three more trains (Trains 6-8), which are expected to offer even better economics, as they do not have the same obligations to current equity partners as options on Trains 4-5. There’s also the potential upside from their Carbon Solutions business, although this remains uncertain, as touched upon earlier.

Energized CEO Award:

Kinetik Holdings CEO Jamie Welch exuded enthusiasm for the investment case. In his distinctive Australian accent, he referred to 2024 as a “barn burner” year, anticipating a sharp drop in capital expenditure and a surge in free cash flow. He was highly optimistic about creating substantial shareholder value, to be realized when they find the right buyer for the company.

Additional Insight on M&A:

During the conference, Enterprise Products (EPD) Co-CEO & CFO, Randy Fowler, shared astute comments on M&A in the midstream sector. He believes that strategic buyers will dominate the landscape. However, Fowler emphasized the need for strategic buyers to exercise caution when considering private equity acquisitions, citing concerns about quality and downstream commitments. When you buy an asset, you really want the flexibility to control the molecule.  For a purchase to be viable for them, it must meet two key criteria: it must possess “industrial merits” and be accretive to cash flow per unit when adjusted for leverage.

We have three have funds that seek to profit from this environment:
Energy Mutual Fund

Energy ETF

Inflation Fund


Why Pipeline Construction Is Hard

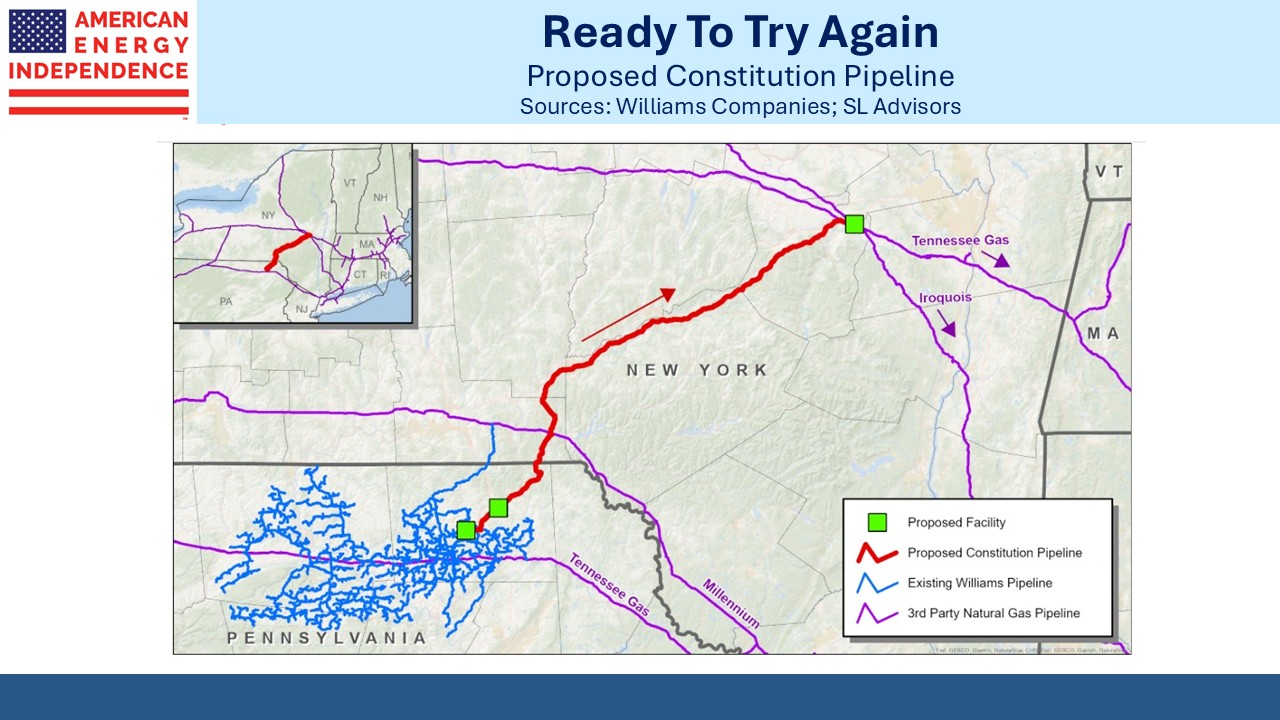
Mountain Valley Pipeline (MVP) will soon move 2 Billion Cubic Feet per Day (BCF) of natural gas from West Virginia to southern Virginia. It will allow increased takeaway capacity from the Marcellus and Utica shale plays in Appalachia. By connecting to Transco (owned by Williams Companies) it will allow for natgas to be transported south, in some cases reaching Cheniere’s LNG export terminals in Sabine Pass, LA or Corpus Christi, TX.

MVP will play a small but important role in getting US natural gas to our friends and allies around the world. It will enable buyers to reduce their dependence on coal for power generation, lowering GreenHouse Gas (GHG) emissions and local pollution. It will offer improved energy security to its buyers. If you’re a strategic environmentalist or climate advocate – and few are – MVP is part of the solution to how we reduce CO2 emissions.

.avia-image-container.av-se5gb5-a2a6725be605a477c7160ea3cb21ac79 img.avia_image{ box-shadow:none; } .avia-image-container.av-se5gb5-a2a6725be605a477c7160ea3cb21ac79 .av-image-caption-overlay-center{ color:#ffffff; }

Instead, MVP will probably be the last greenfield natgas pipeline attempted in the US. This is mostly because we have the network we need, but also because navigating the US permitting process is more torturous than being stranded on a desert island indefinitely with that wretched little girl Greta.

Planning for MVP began in 2014. RBNEnergy.com, which publishes regular informative blog posts on US energy, has 19 articles dedicated to MVP and mentioned it in at least 37 different posts this year alone. MVP became a victim of climate extremists who learned how to weaponize the judicial system to insert uncertainty and delay into any project they dislike.

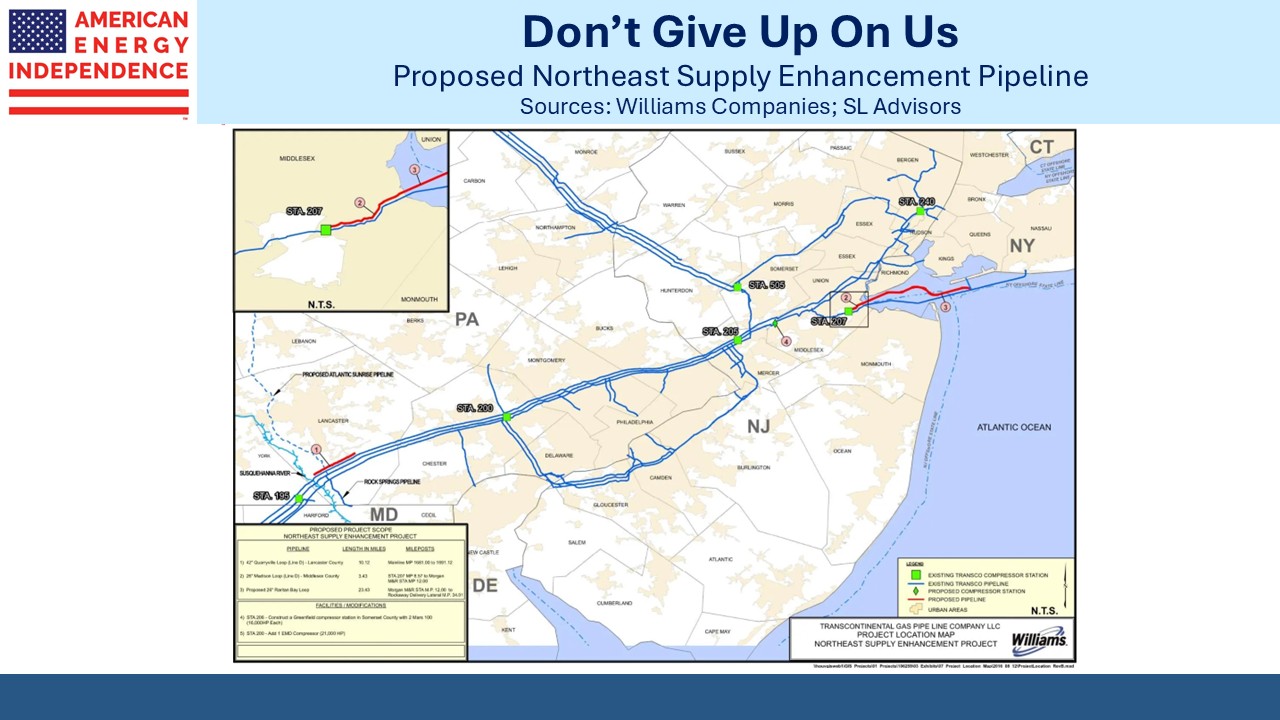
While Equitrans was pressing on with MVP, several other projects to move Appalachian natural gas to the US east coast were dropped. These included Enbridge’s Access Northeast expansion of its Algonquin Gas Transmission pipeline, which had already obtained FERC approval. Kinder Morgan’s Northeast Energy Direct expansion of Tennessee Gas Pipeline is another. These and other pipeline companies concluded that permits didn’t assure completion, perhaps anticipating the travails of MVP.

By May 2021 the 303-mile pipeline was 90% completed. The last thirty miles would average less than one mile per month. MVP required permits from numerous government agencies, including FERC, the US Bureau of Land Management (BLM), the US Army Corp of Engineers and the Virginia State Water Control Board. To cite just two examples, in 2018 a judge on the 4th Circuit struck down Nationwide Permit 12, which had been granted in 2017 by the Army Corp of Engineers and reissued in 2018.  The court acted because stream crossings need to built within 72 hours to limit environmental damage, and it was believed MVP was not complying. The court also annulled MVP’s right of way through Federal lands that had been previously granted by the BLM.

Constructing infrastructure projects is often disruptive to the local community, and society is unlikely to accept unquestioned Federal permits allowing work to move forward. But under the current system, a company can acquire all the needed approvals and move forward in good faith, only to find work halted by a court. In effect, a permit issued by a government agency can’t be relied upon.

Equitrans (ETRN), which owns MVP as part of a consortium, has been struggling to complete the late, overdue project for years. They finally reached the goal line when Senator Joe Manchin (D-WV) insisted on Congress by-passing any remaining challenges as part of the increase in the debt ceiling in the summer. MVP was deemed by Congress to be in the national interest (see A Pipeline Win From The Debt Ceiling).

Even then the Court of Appeals for the 4th Circuit blocked construction to allow the Department of the Interior to assess construction through Jefferson National Forest. In August the Supreme Court finally weighed in and progress resumed. In an October 17 SEC filing, ETRN warned of further added costs because, “The ramp up of MVP’s contractor workforce has been slower and more challenging than expected, due to multiple crews electing not to work on the project based on the history of court-related construction stops…”

The permitting uncertainty isn’t limited to fossil fuels. The SunZia Wind and Transmission project filed for permits in 2006 and is only now starting construction. Navigator CO2 Ventures recently canceled a proposed pipeline aimed at supporting carbon capture because of “unpredictable state regulatory processes”.

Every infrastructure project faces opposition, and climate extremists are far from a homogeneous group with a coherent set of strategic objectives. Communities on the Jersey shore, where we have a summer home, are the red part of a blue state and their opposition to Orsted’s proposed offshore wind turbines helped scupper that project (see Windpower Faces A Tempest).

We concluded years ago that the impossibility of building new pipelines in the US would improve Free Cash Flow (FCF), because with less capex companies would return more cash to shareholders. This is what’s happening. As climate extremists learned how to use legal challenges to further their aims, “Hug a climate protester and drive them to their next protest” began to make sense.

But the tool of limitless court challenges knows no political ideology, and it’s being used against projects that seek to build more intermittent energy (solar and wind) as well as carbon capture. It no longer affects the midstream energy infrastructure sector – the present pipeline network is going to have to be adequate, because there’s little industry appetite to endure another MVP. Ironically, liberals convinced the planet is burning up should be the most vocal supporters of the permitting reform that MVP shows is so sorely needed.

Last week ETRN said they were considering selling themselves, and the stock duly rose. MVP should go into service next quarter, years late and at more than double the initial estimated cost. According to analysts at Citibank, the list of potential buyers includes Williams Companies, Kinder Morgan and Energy Transfer. Some potential acquirers dropped plans years ago to build pipelines adding natural gas takeaway capacity out of the Marcellus. One of them will likely conclude that it’s better to buy a finished project and avoid the painful construction process.

Last year NextEra Energy, an owner of the MVP JV, wrote down their interest in the pipeline. Earlier this year, ETRN’s market cap ascribed zero value to MVP. Consensus among investors was that the project would never be completed. Now that it is, there will be multiple suitors. It shows that climate extremists don’t just support the pipeline sector’s FCF, they also make existing infrastructure more valuable.

We have three have funds that seek to profit from this environment:
Energy Mutual Fund

Energy ETF

Inflation Fund


Bond Rally Boosts Pipelines

Bonds had a great month in November. The Bloomberg Agg was +4.5%. Ten year yields dropped 50 bps. Indications that the Fed will pause again were extrapolated into easing expectations as soon as next quarter. Lower yields help the relative valuation of equities, although Factset earnings forecasts are no longer trending upwards. Consequently, the rally in stocks in November offset the improved relative pricing created by lower bond yields. The Equity Risk Premium (ERP) continues to suggest that there’s little need to rush into stocks. It’s now below the average since 1962 and substantially below the average of the past two decades. Fixed income is becoming competitive once more.

The interplay of price and earnings forecasts leaves the energy sector with the most upside according to analyst forecasts, a position it’s held for much of this year. Midstream energy infrastructure yields of 6-8% are attractive. Nonetheless, we’ve often been challenged on this by financial advisors noting that riskless three month t-bills yielding 5.4% seem better.

.avia-image-container.av-35rnggo-35f145e1fafb7493665c1c0f71412eae img.avia_image{ box-shadow:none; } .avia-image-container.av-35rnggo-35f145e1fafb7493665c1c0f71412eae .av-image-caption-overlay-center{ color:#ffffff; }

The obvious response is that t-bill yields may fall – the rally in bonds shows the market expects as much within the next couple of quarters. Pipeline dividends are unlikely to fall – JPMorgan is forecasting median dividend increases of 5-7% for large cap US midstream corporations and MLPs. They expect more modest 3% growth for Canadians (Enbridge just raised their payout 3.1%). But their yields are higher.

.avia-image-container.av-yubtk-f814ac0df5748e40f7598bdf46e6e63c img.avia_image{ box-shadow:none; } .avia-image-container.av-yubtk-f814ac0df5748e40f7598bdf46e6e63c .av-image-caption-overlay-center{ color:#ffffff; }

Falling yields without a recession may be the most positive environment for this sector. Investors searching for income should increasingly be drawn to investment grade names with dividend yields above treasuries and the ability to raise them as well as repurchase shares. The American Energy Independence Index returned +8.1% in November, bringing its YTD return to +15.9%.

.avia-image-container.av-246fblk-2b0707f6d87e91c272db3945fc9d355a img.avia_image{ box-shadow:none; } .avia-image-container.av-246fblk-2b0707f6d87e91c272db3945fc9d355a .av-image-caption-overlay-center{ color:#ffffff; }

We’ve also fielded questions on the impact on natural gas of Israel’s invasion of Gaza in response to the October terrorist attack by Hamas. It’s understandable given that Russia’s invasion of Ukraine last year sent European gas prices skyrocketing. This created profitable opportunities for US LNG shippers such as Cheniere to arbitrage between cheap domestic prices and Germany’s need to replace Russian supplies.

By contrast, offshore natural gas production in the eastern Mediterranean has continued although it was briefly halted by the Israeli government at the outset of hostilities. Israel has one Floating Storage and Regasification Unit (FSRU) six miles offshore. Last year Germany scrambled to lease most of the world’s available FSRU’s so they could import LNG. Until then they had none. But there’s been no disruption to Israel’s gas supply.

More meaningful to Israel’s ability to supply it armed forces is crude oil, 60% of which comes from Kazakhstan and Azerbaijan. These two Muslim countries have shown little inclination to curb supplies out of solidarity with the Palestinians. In any event, other producers would surely step in if needed, including the US.

The outlook for global natural gas demand remains constructive. Cambodia just canceled a planned coal-burning power plant and intends to substitute with natural gas power supported by LNG imports, a first for the country.

.avia-image-container.av-1ghdg1k-598d2296531e9cca469d2ae70da454ca img.avia_image{ box-shadow:none; } .avia-image-container.av-1ghdg1k-598d2296531e9cca469d2ae70da454ca .av-image-caption-overlay-center{ color:#ffffff; }

Cheniere continues to sign long term LNG contracts. They minimize commodity risk, providing gas at whatever is the prevailing US market price and concentrating their economics on charging for liquefaction services. But last week they agreed to provide LNG to Austria’s OMV at a price linked to the European TTF benchmark. If you’re wondering how LNG tankers reach land-locked Austria, the answer is that OMV operates an LNG terminal in Rotterdam. Canada’s ARC Resources will supply the natural gas, also at a price linked to the TTF which will limit Cheniere’s risk.

.avia-image-container.av-12e8eyg-a3c52ad61236f9df5aef5d62cdea7326 img.avia_image{ box-shadow:none; } .avia-image-container.av-12e8eyg-a3c52ad61236f9df5aef5d62cdea7326 .av-image-caption-overlay-center{ color:#ffffff; }

Attendees at the COP28 climate conference reading the EIA’s Today in Energy last Thursday will be dismayed to learn that global CO2 emissions from coal, oil and natural gas are all likely to be higher by 2050 in spite of the UN’s goal that they reach zero. This is based on existing policies and represents a base case. But in their 2023 International Energy Outlook, even the most optimistic scenario which they call the Low Zero-carbon Technology Cost Case, fossil fuels represent 66% of primary energy. Today it’s 80%, and the Reference Case assumes 70%. While the EIA expects growth in renewables like every serious forecaster, fossil fuels will need to grow as well to meet higher overall energy consumption. CO2 emissions in the optimistic case are still higher by 2050, at 38 Billion Metric Tonnes (GigaTonnes, or GTs), versus 41GTs in their base case and 35.7GTs today.

Part of the problem is that consumers are balking at the cost of the energy transition. Unsold electric vehicles sitting on dealer lots and multi-billion-euro losses on wind turbines are examples. Democrat political leaders starting with Biden have emphasized jobs, but it’s becoming increasingly clear, as it always was to us, that reducing CO2 emissions is worthwhile but also very expensive.

.avia-image-container.av-35ujso-9e41f217df75b679276fd6ab3ae4f95e img.avia_image{ box-shadow:none; } .avia-image-container.av-35ujso-9e41f217df75b679276fd6ab3ae4f95e .av-image-caption-overlay-center{ color:#ffffff; }

We have three have funds that seek to profit from this environment:

Energy Mutual Fund

Energy ETF

Inflation Fund


Another Climate Conference

COP28, the annual UN climate conference, starts tomorrow in Dubai in the United Arab Emirates (UAE). It’s easy to criticize the world’s efforts at reducing global Greenhouse Gases (GHGs). They over-emphasize intermittent solar and wind instead of going all in on nuclear and should replace coal with natural gas.

China gets a free pass to increase emissions through at least 2030 so their living standards can modestly catch up with the west. The US didn’t impose the decades of growth-stultifying communist central planning in 1949 that caused their living standards to fall behind. But we’re supposed to cut GHGs while theirs grow. President Biden and Xi Jingping, leaders of the world’s top two emitters, the US (6.4 billion Metric Tonnes (MTs) of CO2 equivalent and falling since 2007) and China (14.4 and rising) won’t be attending. The UAE, OPEC’s third biggest producer of liquid fuels, is planning to use the presence of so many energy executives in Dubai to discuss oil deals.

.avia-image-container.av-1z7vf9n-60fe5ca39393ab5a170192095c60f5a0 img.avia_image{ box-shadow:none; } .avia-image-container.av-1z7vf9n-60fe5ca39393ab5a170192095c60f5a0 .av-image-caption-overlay-center{ color:#ffffff; }

The US just auctioned 35,000 acres of Wyoming land to oil and gas drillers, demonstrating that the White House is acting with more pragmatism and less emotion than left-wing Democrats might like. As St. Augustine might have said, “Give me 100% clean energy (chastity), just not yet.”

3,700 US auto dealers are calling on the Administration to slow regulations requiring two thirds of new cars to be battery electric by 2032. Electric Vehicle inventories in the US are up fivefold over the past year, according to digital listing platform CarGurus.

Climate extremists despair at the apparent lack of progress. But there is plenty of evidence that the world’s energy producers are adapting to the energy transition.

.avia-image-container.av-1j6u3rf-312cbb7d2df2140e1ce1303e5703e93b img.avia_image{ box-shadow:none; } .avia-image-container.av-1j6u3rf-312cbb7d2df2140e1ce1303e5703e93b .av-image-caption-overlay-center{ color:#ffffff; }

Global investment in fossil fuels has yet to recover to pre-pandemic levels in real terms, while renewables investment has increased by around half in five years. Given the long lead-time in developing new oil and gas reserves, caution around capital commitments that require a decade or more to deliver a return is prudent. By most measures the world is going to be short of crude oil since demand continues to grow. The Energy Information Administration (EIA) sees global liquids consumption rising by 1.4 Million Barrels per Day (MMB/D) next year to 102.44 MMB/D, 0.4 MMB/D faster than production. China’s oil consumption grew at 3.5% annually over the past decade.

Nonetheless the price of crude has confounded many bullish oil forecasters this year.

.avia-image-container.av-4ggsgb-84f72de5f1cd27e2fe72a5da3ef90b68 img.avia_image{ box-shadow:none; } .avia-image-container.av-4ggsgb-84f72de5f1cd27e2fe72a5da3ef90b68 .av-image-caption-overlay-center{ color:#ffffff; }

Carbon capture received a big boost from last year’s Inflation Reduction Act (“Green Spending Act”). With tax credits for Direct Air Capture (DAC) of CO2 rising to $180 per MT, private sector investment is picking up. More than half the new capital dedicated to the sector over the next three years is expected to be in the US. The power sector, where concentrated emissions of CO2 can be sourced, will receive around half of planned investment over that time. Removing CO2, long criticized as impractical and ruinously expensive, is becoming an important tool (see Carbon Capture Gaining Traction).

American Airlines is buying carbon credits from a company that turns sawdust and tree bark into compressed bricks that are then coated and buried. This prevents the biomass from otherwise decomposing and releasing CO2 into the air. American Airlines is paying $100 per MT for the credits. Burying sawdust seems an unlikely way to reduce CO2 levels, but Graphyte’s backers include Bill Gates’s Breakthrough Energy Ventures. The company expects to start producing the bricks next month and believes their technology is cheaper than other types of carbon capture.

It’s likely that innovation in this sector, spurred by the Green Spending Act, will continue to lower costs while adding new methods.

.avia-image-container.av-j5vfkb-5c32dbe5110fc69a17ca20b66eaf14bd img.avia_image{ box-shadow:none; } .avia-image-container.av-j5vfkb-5c32dbe5110fc69a17ca20b66eaf14bd .av-image-caption-overlay-center{ color:#ffffff; }

Federal support is also stimulating new investment in pipelines to move hydrogen and CO2. Hydrogen offers promise when blended with natural gas at low percentages but generates Nitrous Oxide (NOx) at higher concentrations, as noted in this comment on a previous blog post.

The US is leading the world with new investment and innovation in reducing emissions from today’s energy and removing CO2 from the atmosphere. We’re also exporting increasing amounts of natural gas to our trading partners and allies, enabling them to use less coal for power generation. The US has a great story to tell on climate change and the energy transition, one that is underpinned by today’s midstream infrastructure companies. Climate extremists are wrong to focus their criticism on rich countries. The path of emissions in China and whether they eventually peak and then fall, will determine global levels.

We have three have funds that seek to profit from this environment:
Energy Mutual Fund

Energy ETF

Inflation Fund


Natural Gas Liquids – The Forgotten Cousins

Media coverage of reliable energy tends to focus on oil and gas. Oil comes in hundreds of different grades of complex hydrocarbon molecules. Natural gas, methane, is the simplest hydrocarbon of them all with a molecular formula of CH4. In between methane and crude oil lie Natural Gas Liquids (NGLs) – successively more complex combinations of carbon and hydrogen. Methane, also known as “dry” gas, is measured in cubic feet or BTUs. NGLs are measured in Millions of Barrels per Day (MMB/D). When NGLs are found with methane, it’s called “wet” gas.

NGLs don’t get much attention, but they should because their growth over the past decade has been more impressive than for either of their better known cousins. Over the past fifteen years, US NGL production has tripled, to 6.5 Million Barrels per Day. This growth in output has fueled a big jump in exports, up more than 10X since 2010. Just under 40% of our NGL production now goes overseas, up from 10% in 2010.

.avia-image-container.av-k3kkdt-8556ef1686d084b43f968bbe051a2a42 img.avia_image{ box-shadow:none; } .avia-image-container.av-k3kkdt-8556ef1686d084b43f968bbe051a2a42 .av-image-caption-overlay-center{ color:#ffffff; }

One of the important roles played by midstream energy infrastructure companies is to separate these hydrocarbons from impurities present when they’re extracted, and from one another. They also make money storing, moving and exporting NGLs, creating multiple opportunities to “touch a molecule” as the vertically integrated companies often point out.

Ethane (C2H6) is used in the US for the production of ethylene from which most plastics are made. In many other countries plastics are made from Naphtha, which is derived when crude oil is refined. The abundance of ethane in the US has supported increased plastics production and foreign direct investment in new petrochemical facilities from companies seeking to benefit from US NGL growth

Ethane production has tripled since 2010. Propane has increased by 3.6X. Most of us are familiar with propane from its use in outdoor grills for barbequing. Propane is also used by farmers for drying crops. In regions not supplied with piped natural gas, such as SW FL, restaurants often cook with propane which is delivered in large upright cylinders.

.avia-image-container.av-22fsiq9-e82131e3be5f40eb32248f3be3f0cf89 img.avia_image{ box-shadow:none; } .avia-image-container.av-22fsiq9-e82131e3be5f40eb32248f3be3f0cf89 .av-image-caption-overlay-center{ color:#ffffff; }

Butane is sometimes blended with propane or gasoline. Isobutane is used in refining. Pentane is used to make polystyrene foam.

NGL prices typically move together, and for the most part they’re all more valuable than natural gas on an energy equivalent basis. The chart shows prices expressed in this form to equalize for the fact that each NGL has a different energy content, measured in Millions of British Thermal Units (MMBTUs).

.avia-image-container.av-1n6i00h-17a1e2b155ad55e965aae4a343046f20 img.avia_image{ box-shadow:none; } .avia-image-container.av-1n6i00h-17a1e2b155ad55e965aae4a343046f20 .av-image-caption-overlay-center{ color:#ffffff; }

Ethane occasionally dips below methane, which can lead to more of it being left in the natural gas stream that is delivered to homes and businesses. This is known as “ethane rejection” when the ethane isn’t valuable enough to justify separating it out from the methane.

Crude oil (not shown in the chart) is currently 5-6X more expensive than US natural gas on an energy equivalent basis. Crude oil is much easier to handle and transport, with transatlantic shipping costs of 3-7% of the price of the commodity. By contrast, converting natural gas to LNG so it can be moved by tanker can cost as much or more than the value of the commodity itself.

.avia-image-container.av-14xv0xd-519ec7bbeacb30aa7306ad76016243ac img.avia_image{ box-shadow:none; } .avia-image-container.av-14xv0xd-519ec7bbeacb30aa7306ad76016243ac .av-image-caption-overlay-center{ color:#ffffff; }

This also explains why, unlike crude oil, regional natural gas prices vary so widely around the world. It’s easier for price discrepancies to prompt oil arbitrage than for natgas. For example, US gas is among the cheapest in the world, but we have 12 billion cubic feet per day of LNG export capacity via liquefaction plants, so exports are capped by this physical constraint regardless of relative pricing.

January natgas futures for Dutch TTF, the European benchmark, are $14.50 per MMBTUs. January futures for the JKM benchmark used in Asia are $17.10. US Henry Hub January futures are $3.00. This is why US LNG export capacity is set to double over the next four years. The world wants more US natural gas, which will underpin prices here somewhat as more liquefaction plants come online.

.avia-image-container.av-wip3ox-0d0d8ca9c70380b59ba0f384ab557f0d img.avia_image{ box-shadow:none; } .avia-image-container.av-wip3ox-0d0d8ca9c70380b59ba0f384ab557f0d .av-image-caption-overlay-center{ color:#ffffff; }

In reviewing the many uses of NGLs, it’ll be clear that few of them can be replaced by renewables. Plastic bags, synthetic rubber, refrigerant, polystyrene and lubricants don’t lend themselves to being provided by solar panels or windmills. Climate extremists will argue that we should use less of all these products, but there’s little evidence of public policy embracing such a view. New Jersey outlawed plastic bags last year so we keep several cloth bags in the car for grocery trips. The United Nations Environmental Programme reported in 2020 that a cotton bag needs to be used 50-150 times before it has less climate impact than a plastic bag.

In 2018 the Danish Environmental Protection Agency suggested it was 7,100 times.

Nonetheless, I still carry my cloth bag conspicuously in the supermarket parking lot, especially when I see a Tesla driver. We both look disingenuously green. But I think our investments in natural gas infrastructure are more helpful to the planet than reusable grocery bags or electric vehicles, because they help reduce coal demand.

We have three have funds that seek to profit from this environment:
Energy Mutual Fund

Energy ETF

Inflation Fund