Russian Gas Exports Face An Uncertain Recovery

European imports of LNG rose sharply following Russia’s invasion of Ukraine two years ago. The US was well positioned to step in and provided virtually all the additional LNG Europe bought. The current pause on new LNG export terminals runs counter to these trade flows, but it’s increasingly clear this policy has few supporters other than some climate extremists.

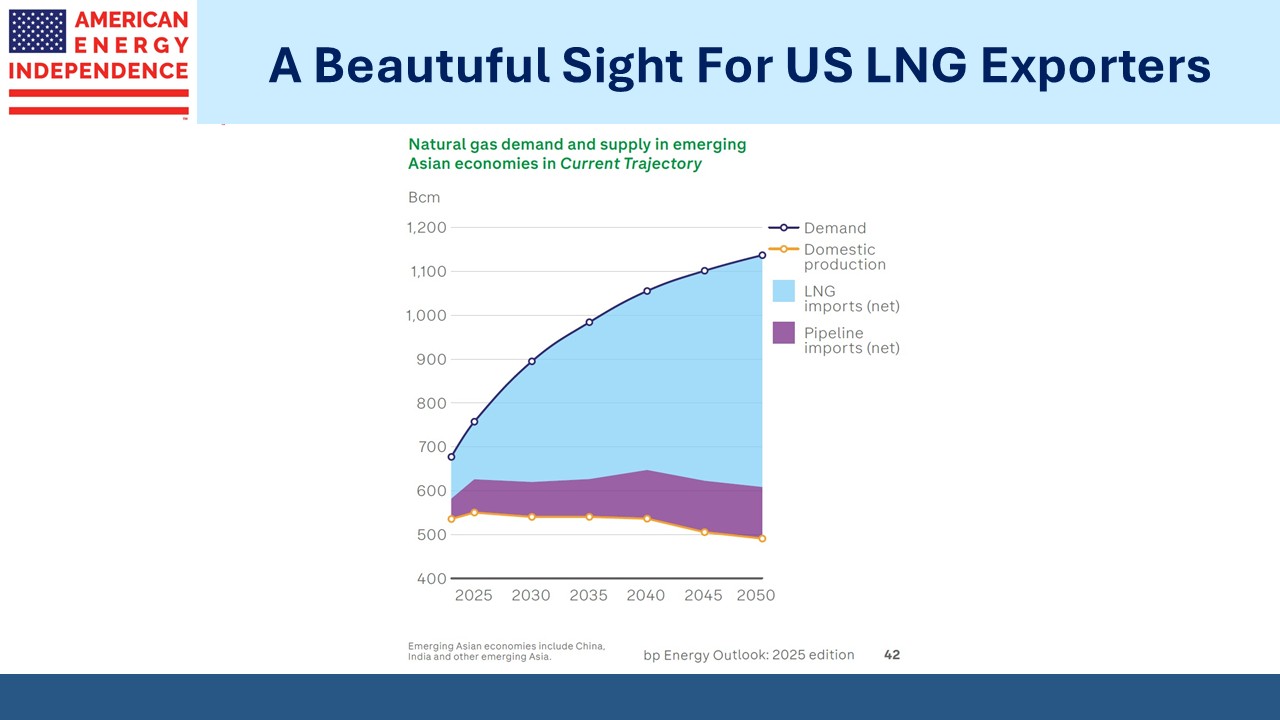
Russia has had to pivot towards Asia and FSU (Former Soviet Union) buyers for its natural gas exports. In 2021 Russian exports via both pipeline and as LNG were 244 Billion Cubic Meters (BCM), around 23.6 Billion Cubic Feet per Day (BCF/D). For reference, last year the US became the world’s largest LNG exporter, averaging 11.9 BCF/D.

Last year Russian exports were 142 BCM, down 42% over two years.

.avia-image-container.av-j7wbcy-1dbc708ae2ffbbcff6430eee7750baa7 img.avia_image{ box-shadow:none; } .avia-image-container.av-j7wbcy-1dbc708ae2ffbbcff6430eee7750baa7 .av-image-caption-overlay-center{ color:#ffffff; }

Returning gas exports to their previous level will take years if it occurs at all. Negotiations over the Power of Siberia 2 pipeline project with China are moving slowly, and there’s even a suggestion that Russia may begin construction of the pipeline before they have a signed agreement in hand. China clearly feels they have a strong hand to play – and yet China’s own energy strategy is to lessen its dependence on western supplies. Their booming EV market is one way to reduce the need for crude imports. Another is to align more closely with Russia, since on several levels they need one another.

Russia is also expanding its LNG export capability. The Novatek Arctic LNG 2 terminal with annual capacity of 27 BCM (2.6 BCF/D) may start operations as soon as this month. The US has threatened anyone providing “material support” with penalties or criminal prosecution. This apparently hasn’t dissuaded Philip Adkins, CEO of Red Box Energy Services, as described in this FT article.

Other projects that are less far along are vulnerable to sanctions as well as denied access to western liquefaction technology. Russian LNG projects have suffered timing delays. See Russia’s Gas Export Strategy: Adapting to the New Reality for more detail.

Last week the International Energy Agency (IEA) published CO2 Emissions in 2023. In recent years the IEA has moved from providing objective analysis of energy markets to promoting anodyne versions of the energy transition. Few of their projections on energy use are remotely plausible. As a result, some think if Trump wins the election he’ll stop funding the IEA, which seems to have outlived its purpose with its new approach.

The IEA reported that global energy-related CO2 emissions grew by 1.1% last year. Executive director Fatih Birol claimed that increased EV deployment over the past five years had constrained global oil demand, thereby reducing emissions. He overlooked that in the world’s biggest EV market Chinese electricity is 62% derived from coal. At the IEA, cheerleading sometimes beats analysis.

Canada announced that the TransMountain Expansion (TMX) pipeline that they purchased from Kinder Morgan (KMI) in 2018 (see Canada’s Failing Energy Strategy) will finally start operating. It connects oil-rich Alberta with Pacific export terminals in British Columbia.

TMX is planning 2.1 million barrels of linefill next month and another 2.1 in May. Construction has been a financial disaster for taxpayers, with the ultimate cost likely to exceed by 4X estimates when KMI deftly unloaded the project. Alberta has always struggled to get its oil to market. British Columbia’s left-leaning government has long been hostile to TMX, which prompted KMI’s sale. Keystone XL was intended to add southern takeaway capacity until Biden canceled it. Alberta’s oilmen will be relieved.

Canada also intends to expedite approval of new nuclear projects, a pragmatic step that acknowledges the limitations of solar and wind. The Sierra Club Canada is, like its US namesake, opposed to nuclear power. Climate extremists aren’t good for the rest of us.

Carbon Capture and Sequestration (CCS) is often dismissed by those who want the world to rely on intermittent energy. Occidental is building the world’s biggest CCS facility in Texas and is optimistic about licensing the technology. They gave up on one project, named Century, after concluding the economics weren’t attractive enough. However, they drew a $550 million investment from Blackrock in Stratos, which is expected to be commercially operational by the middle of next year.

In Singapore, Exxon and Shell have formed a JV to work with the government on a CCS project. Opponents dislike CCS because it allows fossil fuels to be used without emitting CO2. This is why the rest of us should hope CCS becomes a vital part of the energy chain, since it will preserve our use of reliable energy rather than the intermittent, weather-dependent type.

We have three have funds that seek to profit from this environment:
Energy Mutual Fund

Energy ETF

Inflation Fund


Coal Trade Is Growing

American coal exports are booming. Exports of thermal coal rose 26% last year, to 44 Million Metric Tonnes (MMTs). This is mostly burned to produce electricity. We also exported 46.5 MMTs of metallurgical coal, typically used in industrial processes such as steel manufacture.

Shipments of thermal coal to India doubled, to 14.1 MMTs, close to a third of such exports.

Coal is widely understood to generate roughly twice the Greenhouse Gas emissions (GHGs) as natural gas. In addition, local pollution causes respiratory problems for people living nearby.

.avia-image-container.av-18gdnbu-099753a99d501ad279f1e55e5ed8a4bd img.avia_image{ box-shadow:none; } .avia-image-container.av-18gdnbu-099753a99d501ad279f1e55e5ed8a4bd .av-image-caption-overlay-center{ color:#ffffff; }

US GHGs have fallen over the past 15 years primarily because we’ve been reducing coal-sourced power in favor of natural gas. Increased use of renewables has also contributed, but not as much.

A coherent White House climate policy would encourage developing countries, the main source of demand growth for energy, to follow the US example. This would mean increasing natural gas availability through LNG exports and reducing coal availability.

Instead, we’re doing the opposite. With coal exports reaching a record, the White House injected uncertainty into long term US LNG supply by pausing the approval of new export terminals.

Pakistan announced last year a quadrupling of coal-fired power generation in response to high global LNG prices. Japan recently broke off negotiations with Energy Transfer about buying LNG from their planned Lake Charles facility because of uncertainty over whether it will be built.

.avia-image-container.av-k6fgfu-79da2eed2b51c67f40b1eed4a6c50c00 img.avia_image{ box-shadow:none; } .avia-image-container.av-k6fgfu-79da2eed2b51c67f40b1eed4a6c50c00 .av-image-caption-overlay-center{ color:#ffffff; }

India is the second biggest consumer of coal, albeit way behind China who is 4X as big. A new round of Ukraine-related sanctions on Russia is intended to impede their exports of coal to India, which will presumably further boost their appetite for US shipments.

India plans to increase LNG imports so as to increase fertilizer production. This is needed to feed their growing population whose diets will include more protein as living standards rise (see LNG Pause Will Boost Asian Coal Consumption). Urea is a nitrogen-based fertilizer derived from natural gas via the Haber-Bosch process.  It provides plants with nitrogen which promotes growth. Solar and wind power cannot produce fertilizers, other than providing heat energy to enable the chemical processes.

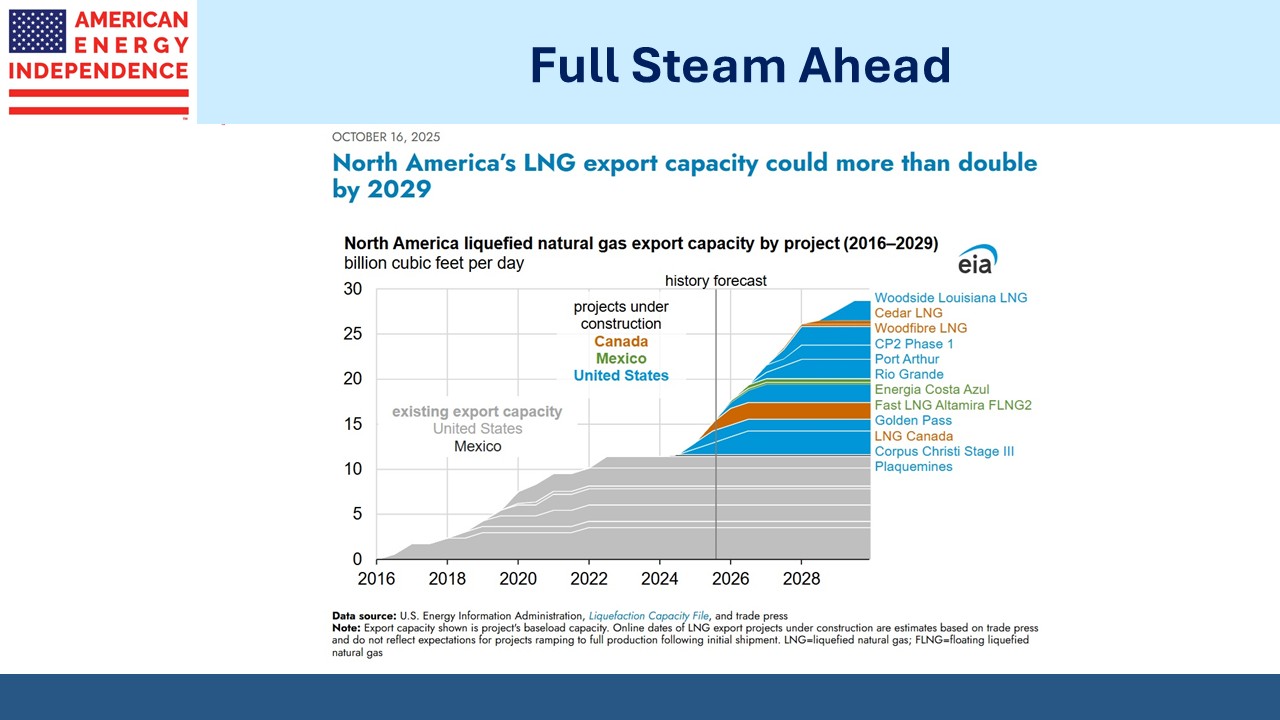
To put the export statistics in perspective, the 44 MMTs of thermal coal we exported, which will mostly be burned to generate power, have the same energy equivalent as 9.4 Billion Cubic Feet per Day (BCF/D) of LNG exports. We currently export 12-13 BCF/D of LNG, mostly to Asian buyers who use less coal as a result. This figure will double over the next four years or so as export terminals at various stages of construction reach completion. But the DOE pause on new approvals has cast uncertainty.

Nobody wants to sign a 20 year commitment to purchase LNG without knowing that the proposed facility will actually be built. According to the Energy Institute’s 2023 Statistical Review of World Energy, global coal trade grew at 0.6% pa over the past decade.

It’s fair to say that US climate policy is not closely aligned with trade policy as it relates to energy exports. We are encouraging purchases of the fossil fuel that generates the most GHGs while impeding its replacement with cleaner-burning LNG.

US climate extremists including TikTok boy Alex Haraus (see White House Adopts An Energy Policy Where Everyone Loses) have promulgated a flawed policy that will increase emissions by encouraging coal use.

When people disagree with you it’s tempting to question their intelligence. This is quicker than considering whether their alternate view holds some insight. It’s also intellectually lazy.

However, in the case of climate extremists I have concluded that factual analysis informs their views to an inconsequential degree. They exhibit a Pavlovian opposition to any form of reliable energy. They know little of how the world works. They think everything can run on solar and wind even though 80% of the world’s energy today comes from fossil fuels. Many of them even oppose nuclear power, so beholden by the purist belief in intermittent energy.

In short, climate extremists are not the smartest people you’ll meet.

Electoral enthusiasm is the lowest I can recall in over four decades living in the US. It’s why Biden grasped at the LNG permit pause as an opportunity to energize progressives. But it’s poor policy, and after the election if the current octogenarian occupant of the Oval Office wins, a more effective policy prescription will likely follow. This should include more gas and less coal.

Trump has already said he’ll lift the pause.

So the investor’s perspective should be to look past the current short term thinking and consider what a thoughtful policy will look like. Those who think hard about how the world can reduce GHGs expect climate extremists to be drowned out by pragmatic solutions.

We have three have funds that seek to profit from this environment:
Energy Mutual Fund

Energy ETF

Inflation Fund


4Q Earnings Wrap

Earnings for 4Q23 are almost complete. Most companies came in at or a few per cent ahead of market expectations. Cheniere (CEI) beat sell-side estimates by 11%, continuing a remarkable run. They are targeting a 1:1 ratio between buybacks and debt reductions and based on their long run desired share count should be retiring 12-13% of outstanding shares over the next few years.

CEI’s FY2023 EBITDA came in at $8.77BN. The stock dipped last week as 2024 EBITDA guidance came in a little below expectations at $5.5-6.0BN. Last year they benefitted from large regional price differences in natural gas on the portion of their LNG capacity not committed under long-term agreements. They have not assumed the same opportunity this year. Despite CEI’s flat stock performance over the past year, JPMorgan and Wells Fargo continue to rate them Overweight. It’s one of our bigger holdings.

.avia-image-container.av-1lnb4kv-2328f95169d61a03c288a25f65764153 img.avia_image{ box-shadow:none; } .avia-image-container.av-1lnb4kv-2328f95169d61a03c288a25f65764153 .av-image-caption-overlay-center{ color:#ffffff; }

Plains All American (PAGP) came in 10% ahead of expectations as their crude oil and Natural Gas Liquids segments both reported strong results. They increased their distribution by 19%.

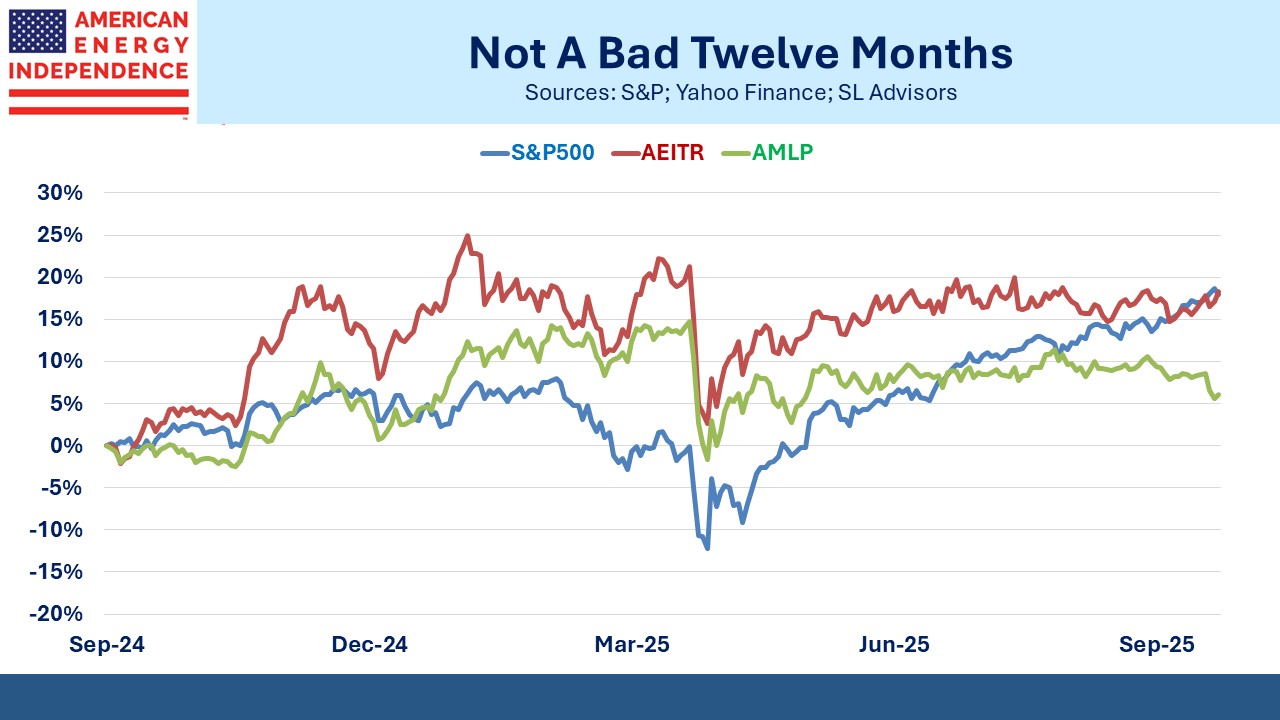
PAGP stock has performed strongly in the past year, +31% versus the American Energy Independence Index (AEITR) at +17%. We tend to underweight crude oil businesses in favor of natural gas where we believe the long-term growth prospects are more assured. Nonetheless, the softening of US demand for electric vehicles will encourage the view that US crude oil demand is not going to fade away.

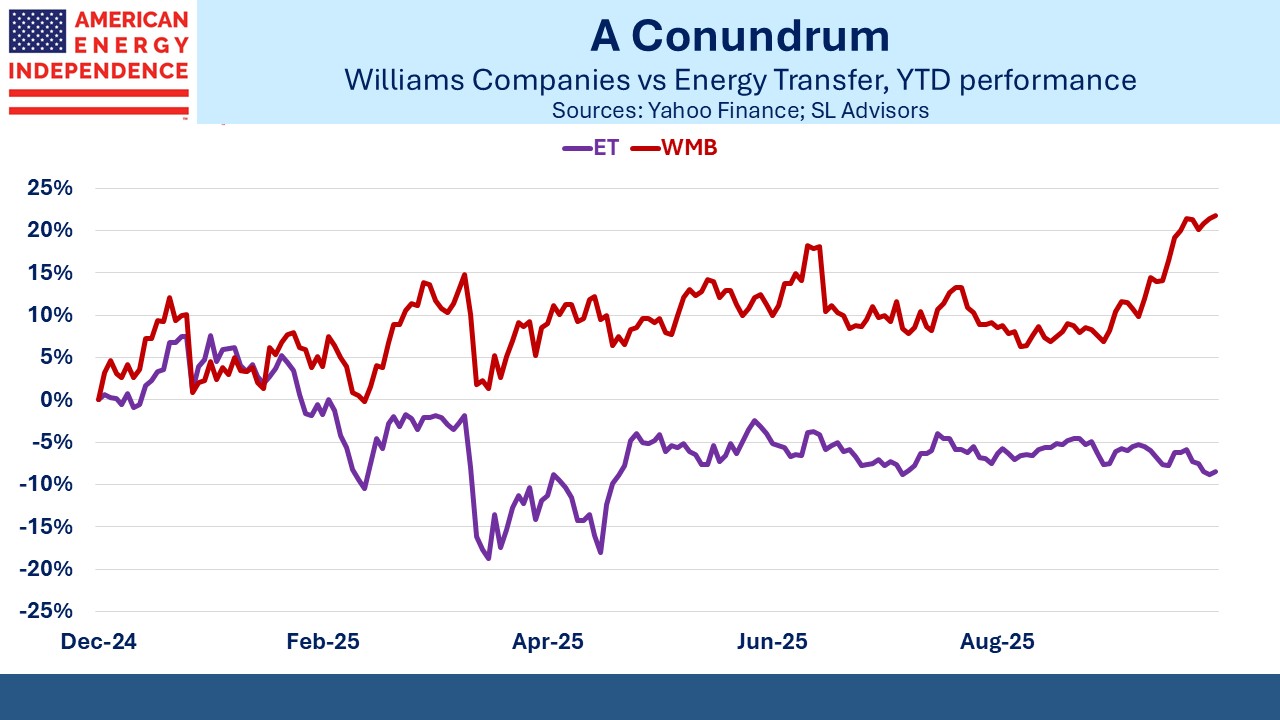
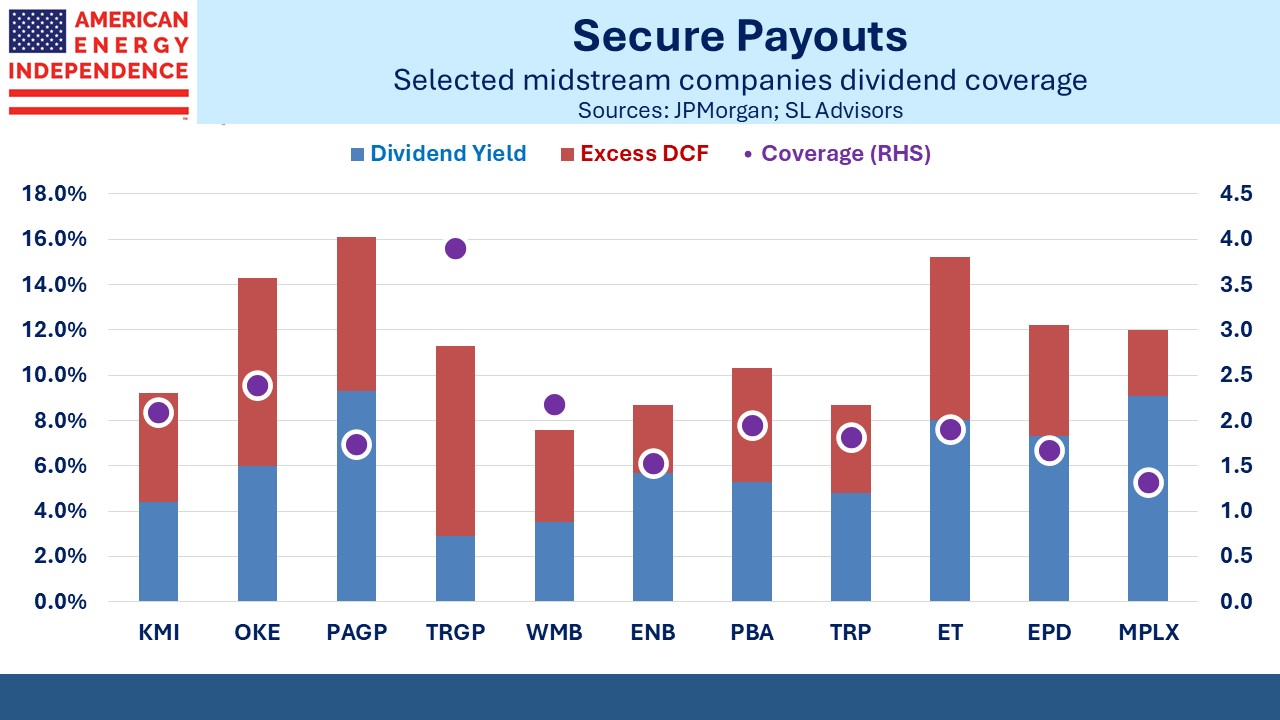
Energy Transfer’s (ET) 4Q EBITDA came in close to consensus at $3.6BN. However, 2024 EBITDA guidance was slightly below expectations while capex was somewhat higher. The stock remains attractively priced in our view, and any disappointment over the guidance was short-lived. It’s up 26% over the past year, including that high dividend which currently yields 8.4% and is covered 2X by Distributable Cash Flow (DCF). ET is rated Overweight at JPMorgan and Wells Fargo.

Targa Resources (TRGP) is another strongly performing stock, +33% over the past year including its low dividend which currently yields 2%. TRGP is well positioned to transport NGLs from the Permian to export terminals on the Gulf coast, providing an integrated service to customers with multiple opportunities to add value.

JPMorgan expects 9%+ EBITDA growth this year and next. With management committed to returning 40-50% of cash from operations to shareholders via dividends and buybacks, there is plenty of room for TRGP to increase its quarterly payout.

The Canadians have been lagging the sector because of market concerns about their capex. Enbridge’s (ENB) C$19BN acquisition of three utilities from Dominion last year wasn’t well received. They’ve raised 85% of the funds needed through debt, equity and asset sales. ENB stock is -4% over the past year, meaningfully underperforming the sector. Their 7.8% yield is 1.4X covered by DCF. Analyst opinion is mixed – JPMorgan is Overweight while Wells Fargo is Underweight.

TC Energy (TRP) has also lagged the sector, +4% over the past year. Their capex has been higher than investors would like over the past couple of years, but projects are nearing completion and spending is coming down. Coastal GasLink was completed late last year and will provide natural gas to LNG Canada’s export terminal in Kitimat, BC for export to Asian customers. The Southeast Gateway project will connect customers in Mexico with domestic supply. It is scheduled to be completed next year. This year capex is forecast to be C$8-8.5 and closer to C$6BN next year. Their 7% dividend yield is 1.5X covered by DCF.

Overall earnings confirmed the predictability of cashflows in the midstream sector. It is often described as a “toll-like” business model. The pandemic-induced collapse in 2020 challenged this description, but performance since then has shown that the description remains apt. Attractive dividends with ample coverage from DCF is common across the sector.

.avia-image-container.av-478kwf-4fc22289bff8b5c6f45393f683a0d40b img.avia_image{ box-shadow:none; } .avia-image-container.av-478kwf-4fc22289bff8b5c6f45393f683a0d40b .av-image-caption-overlay-center{ color:#ffffff; }

I was struck by a chart the other day showing a sharp drop in the price of used Teslas. A couple of years ago wait times of as much as a year were common for buyers to take delivery of their new vehicle. Nowadays it’s a few weeks, and sales have slowed so that Electric Vehicles (EVs) are taking dealers longer to shift than conventional cars.

The halving of resale values for EVs reflects consumer realization that they’re nice to drive but charging is inconvenient. Cold weather reduces their battery range, as does age. As suggested in this video (see Stop Paying For Overpriced EVs), these are the reasons they ought to be cheaper than an equivalent gas-powered car. Reduced resale value boosts annual depreciation, increasing the cost of ownership.

EVs are gradually finding a more appropriate price point.

.avia-image-container.av-nrqt0v-365a313b38fc8bcbca552db9d7c3b205 img.avia_image{ box-shadow:none; } .avia-image-container.av-nrqt0v-365a313b38fc8bcbca552db9d7c3b205 .av-image-caption-overlay-center{ color:#ffffff; }

We have three have funds that seek to profit from this environment:
Energy Mutual Fund

Energy ETF

Inflation Fund


What Investors Ask Your Blogger

Recently I’ve given presentations to a couple of investment clubs in Naples, FL. Usually I speak about midstream energy infrastructure, but I was also asked to expand on Our Darkening Fiscal Outlook, recently published on our blog,

The Q&A is always enjoyable at such events. Below are some common themes that came up.

Don’t weak natural gas prices show that Biden’s pause on approving new LNG export terminals is hurting US producers?

The White House directed the Department of Energy (DOE) to consider the overall climate impact of approving further LNG exports. They didn’t cancel existing approvals, so North American LNG export volumes are still on track to roughly double over the next four years. This includes new terminals in Canada and Mexico.

.avia-image-container.av-1hb9ewo-91aab977042d7b8811a58457bda2d478 img.avia_image{ box-shadow:none; } .avia-image-container.av-1hb9ewo-91aab977042d7b8811a58457bda2d478 .av-image-caption-overlay-center{ color:#ffffff; }

As noted previously, the pause is unlikely to reduce emissions since Asia will simply burn more coal. Pakistan announced last year a quadrupling of coal-generated power because of high LNG prices. But it is causing uncertainty. For example, Japan’s Kyushu Electric is postponing negotiations with Energy Transfer about buying LNG from their planned Lake Charles terminal until it’s clear it will be built.

Today’s weak US natural gas prices aren’t related to the DOE pause, since it only affects the construction of new terminals which are several years out. Prices are weak because of a relatively mild winter (although I can report Naples has been unusually cold). Chesapeake recently announced they’ll be reducing natural gas production because of low prices. With natural gas well below $2 per Million BTUs, it’s clear that domestic producers and foreign buyers would both benefit from increased trade.

Will there be more mergers in the midstream sector?

Investment bankers have been busy in the energy sector over the past six months or so. The number of MLPs keeps shrinking although we expect Enterprise Products and Energy Transfer to retain their pass-through status given high insider ownership. Western Midstream Partners (WES) might be sold at some point, and that would further reduce the number of MLPs. It would also create a deferred income tax recapture event for holders if bought by a c-corp. Magellan Midstream agreed to Oneok’s acquisition last year despite the tax bill it created for long-time investors. Presumably WES holders might similarly accept a merger-induced tax bill if they felt the terms were right.

When will our dire fiscal outlook provoke a crisis?

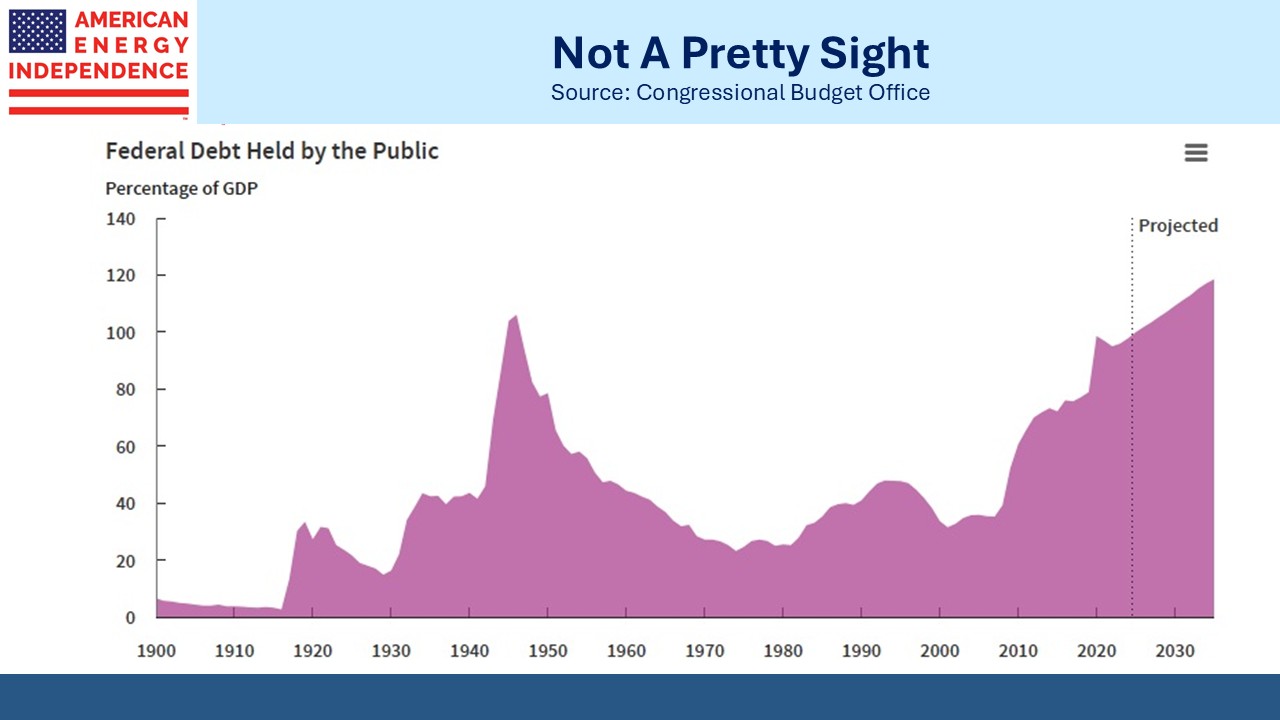
A chart showing the stratospheric path of US indebtedness is sufficient to make the case that a debt crisis is inevitable. So why hasn’t it already happened? Thirty year bond yields of 4.5% do not reveal reluctant buyers. But then Argentina has defaulted nine times since independence in 1816 and is always able to come back for more. It’s unclear why any return-oriented investor would ever buy Argentine debt, but there are sufficient undiscerning bond buyers that in 2017 they issued 100 year bonds.

Bond underwriters know how to have fun at others’ expense. Let’s hope there were no CFA charterholders making such purchases.

.avia-image-container.av-16ehr4o-5c0da6fdc2aa31067266b550c8756838 img.avia_image{ box-shadow:none; } .avia-image-container.av-16ehr4o-5c0da6fdc2aa31067266b550c8756838 .av-image-caption-overlay-center{ color:#ffffff; }

Since at least as far back as the Great Financial Crisis of 2008-09, a surplus of return-insensitive capital (central banks, sovereign wealth funds) along with inflexible mandates at others such as pension funds has kept yields low.

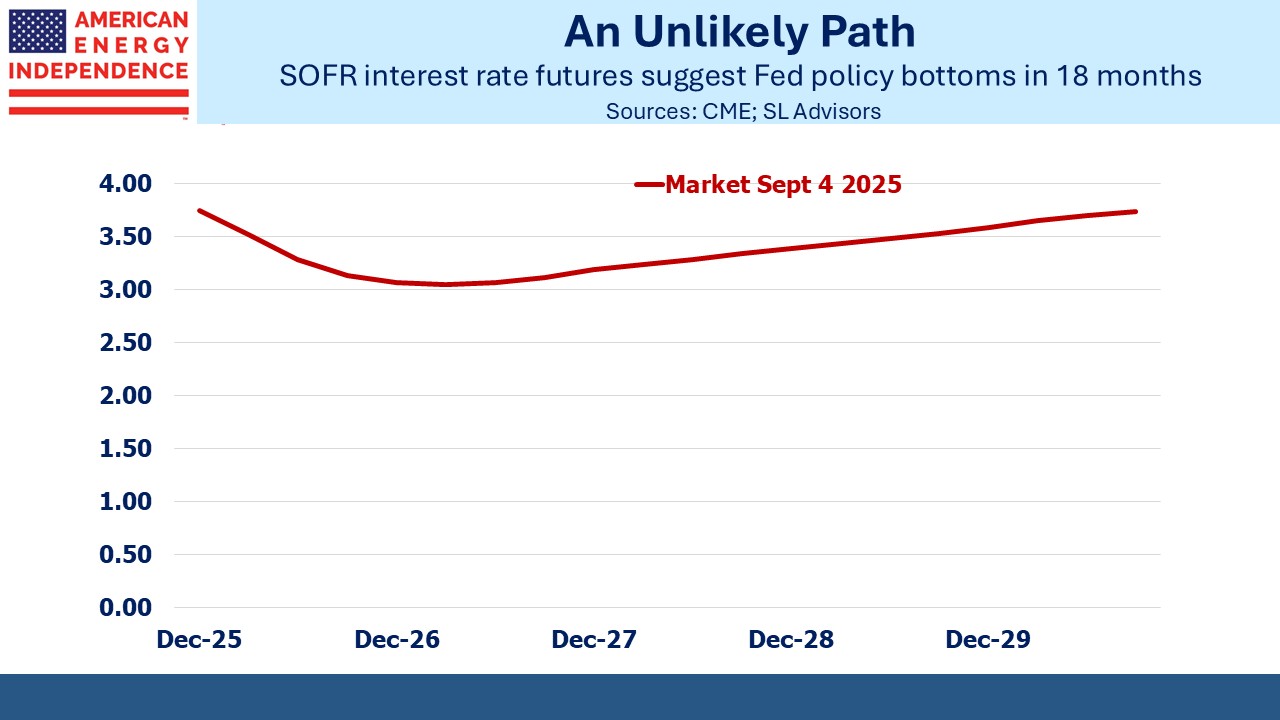
The Federal Reserve owns almost a fifth of our Federal debt, a portion the Congressional Budget Office expects to remain unchanged. Research suggests that quantitative easing reduced bond yields by as much as 1%. This contributes to the present conundrum whereby monetary policy is generally regarded as restrictive whereas the inverted yield curve leaves ten year treasuries at 4.3%, or 2% above expected inflation over their lifetimes.

3.3% GDP growth, 3.7% unemployment and a stock market at new highs all suggest that rates are not much of an economic headwind.

Can I trust the inflation numbers?

It’s always fun to demonstrate why inflation statistics are deceptive. See Why It’s No Longer Enough To Beat Inflation. In brief, there is no government conspiracy to understate inflation. It’s just that the economists at the Bureau of Labor Statistics measure what they can, not what you think.

“A basket of goods and services of constant utility” is what they measure. Statisticians strip out quality improvements, because they provide more utility. So consumer electronics such as iphones show up as falling in price because more features for the same cost equals a price cut in BLS-land.

What most investors want to know is the rate at which their spending capacity needs to grow so that they don’t feel any poorer. Since living standards grow, simply keeping up with CPI will leave you worse off relative to the median.

.avia-image-container.av-san048-71cca94b6a27453b0690c88be4df25be img.avia_image{ box-shadow:none; } .avia-image-container.av-san048-71cca94b6a27453b0690c88be4df25be .av-image-caption-overlay-center{ color:#ffffff; }

Whenever you read “in today’s dollars” the writer isn’t giving a true picture of what it felt like to buy, say, a color TV in 1953 which cost $1,500.

That’s around $15,000 “in today’s dollars” because using CPI you need $10 today to buy what $1 did back then.

2022 median household income was $92,750, so that TV looks as if it cost about two months pay for the typical family. But in 1953 median household income was $4,242, so it really took over four months of pay to buy the TV.

The correct comparison would keep the portion of household income needed to buy the item the same as in 1953. Multiplying the $1,500 1953 TV by $92,750/$4,242, or 21.86, gives almost $33K. That’s the more meaningful representation of what a 1953 TV cost. It keeps the portion of household income needed to buy the TV the same in 2022 as in 1953.

There’s no need to mistrust the BLS. But if your purchasing power doesn’t keep up with median household income, you’ll gradually become poorer by comparison with the rest of the country.

We have three have funds that seek to profit from this environment:
Energy Mutual Fund

Energy ETF

Inflation Fund


Our Darkening Fiscal Outlook

There are two ways in which our looming fiscal catastrophe draws closer. One is through the passage of time, as entitlements grow with more aging Medicare recipients. The other is through worsening projections from the Congressional Budget Office (CBO).

Both are happening.

Start with interest expense. In the CBO’s May 2022 ten year Budget and Economic Outlook, this line item was forecast to hit $1TN in 2030, eight years hence. Last May, the CBO brought this date closer by two years, to 2028. And in the February outlook just released it’s now 2026. Since 2022 the $1TN date has gone from eight years out to just two.

.avia-image-container.av-36xzdup-d1e8e412de590b85dcde409036b6c925 img.avia_image{ box-shadow:none; } .avia-image-container.av-36xzdup-d1e8e412de590b85dcde409036b6c925 .av-image-caption-overlay-center{ color:#ffffff; }

Inflation ran higher than projected in 2022, which also pushed up nominal GDP. But even as a % of GDP, the interest expense figures have worsened. This year we’ll spend 3.1% of GDP on interest, rising to 3.7% in 2032.

.avia-image-container.av-2jkwbk1-d0079b9dd9a2f74a2462c912727e8001 img.avia_image{ box-shadow:none; } .avia-image-container.av-2jkwbk1-d0079b9dd9a2f74a2462c912727e8001 .av-image-caption-overlay-center{ color:#ffffff; }

Projections for the Fed’s balance sheet are moving higher as well. Ever since Ben Bernanke unleased Quantitative Easing (QE) during the 2008 Great Financial Crisis (GFC), the Fed has struggled to bring its bond holdings back down to the level that’s needed to operate monetary policy.  Fearful of causing a spike in bond yields, they rely on maturing bonds rolling off to shrink their holdings.

.avia-image-container.av-mqlcu9-525a27698ec2fcbbcbadb7cd35aa4b30 img.avia_image{ box-shadow:none; } .avia-image-container.av-mqlcu9-525a27698ec2fcbbcbadb7cd35aa4b30 .av-image-caption-overlay-center{ color:#ffffff; }

The Fed’s balance sheet is currently $7.7TN, of which $4.7TN is US treasury securities. Most of the balance is Mortgage-Backed Securities (MBS). Two years ago, the CBO expected the Fed’s holdings of US treasuries to drop to $3.3TN by 2025. Now they’re projecting $4.4TN and expect it to be back at $4.7TN by 2026. An excessive balance sheet has become an enduring feature of our monetary policy.

.avia-image-container.av-1gxml4x-176ef43e76ba55ac628eda8ccb40469e img.avia_image{ box-shadow:none; } .avia-image-container.av-1gxml4x-176ef43e76ba55ac628eda8ccb40469e .av-image-caption-overlay-center{ color:#ffffff; }

When such holdings become permanent it represents a partial monetization of our debt. Moreover, the Fed’s % of outstanding government debt is now projected to be 19% by 2032, 4% higher than the CBO was forecasting a couple of years ago.

The CBO doesn’t forecast MBS holdings, but virtually all these securities have an average life greater than ten years. Prepayments will knock this down, but MBS has also become a permanent item on the Fed’s balance sheet.

.avia-image-container.av-16s8v6p-b25fabee2f520068c6a70946e70f5c55 img.avia_image{ box-shadow:none; } .avia-image-container.av-16s8v6p-b25fabee2f520068c6a70946e70f5c55 .av-image-caption-overlay-center{ color:#ffffff; }

The CBO assumes real GDP growth of 2.0% pa. Recessions are usually unexpected and forecasting them is hard. But when the next one occurs, ample fiscal stimulus will be part of the solution and inevitably the Fed will feel compelled to start QE again.

The only good thing about our deteriorating fiscal outlook is that the perennially forecast day of reckoning hasn’t come. We’re still muddling along. We’re about to head up the steep path into unknown territory as shown in the last chart.

.avia-image-container.av-35o4ld-f8fbce1a41cf8d6625958c57970817fc img.avia_image{ box-shadow:none; } .avia-image-container.av-35o4ld-f8fbce1a41cf8d6625958c57970817fc .av-image-caption-overlay-center{ color:#ffffff; }

Federal debt held by the public will reach 99% this year and is headed higher. However, when adjusted by Federal financial assets and debt held by the Federal Reserve it’s 75%. Japan’s equivalent figure is 119%.

Japan’s defining economic challenge over the past couple of decades has been deflation. GDP growth averaged less than 0.5% pa over the past decade. Many economists blame this partly on their high levels of government debt.

It’s unlikely an extended period of anemic growth would be politically acceptable in the US. The depression of the 1930s defines American economic policy, in that every president is expected to preside over economic growth. Germany’s equivalent is avoiding a repeat of the inflation of the 1930s under the Weimar Republic that led to Hitler’s ascent.

Japanese voters have accepted mediocre GDP growth far longer than would be the case in the US. If excessive US debt led to Japanese-style deflation here, fiscal stimulus and QE would quickly follow.

How this issue resolves itself is of great importance to the long term investor. QE depresses long term yields and impedes the Fed in its ability to constrain growth when inflation is above target. Barry Knapp of Ironsides Macroeconomics regularly warns about the harm to profitability of all but the biggest US banks caused by the persistent inversion of the 3 Month/10 Year portion of the yield curve.  Loans priced off the long end of the treasury curve don’t yield enough to generate acceptable profits for banks whose marginal cost of wholesale funding is close to the Fed Funds rate.

And yet US economic growth remains strong with unemployment low. An unintended consequence of QE is the pressure the Fed’s bond holdings put on regional bank profitability by keeping yields low. It also probably means they need tighter monetary policy than would otherwise be the case at the short end, since long-term yields aren’t that restrictive.

Inflation expectations are the likely casualty rather than GDP growth. Eventually our excessive debt along with increasing debt monetization will cause slow but steady currency debasement, the time-honored refuge of profligate governments. We believe owning infrastructure and other real assets is how investors should position themselves.

We have three have funds that seek to profit from this environment:
Energy Mutual Fund

Energy ETF

Inflation Fund


LNG Pause Will Boost Asian Coal Consumption

Criticism of the White house pause on LNG approvals continues. Williams Companies’ CEO Alan Armstrong said it would cause some countries contemplating the construction of new LNG import facilities to hesitate. The clearest result will be increased coal consumption since it’s cheap and widely available across Asia.

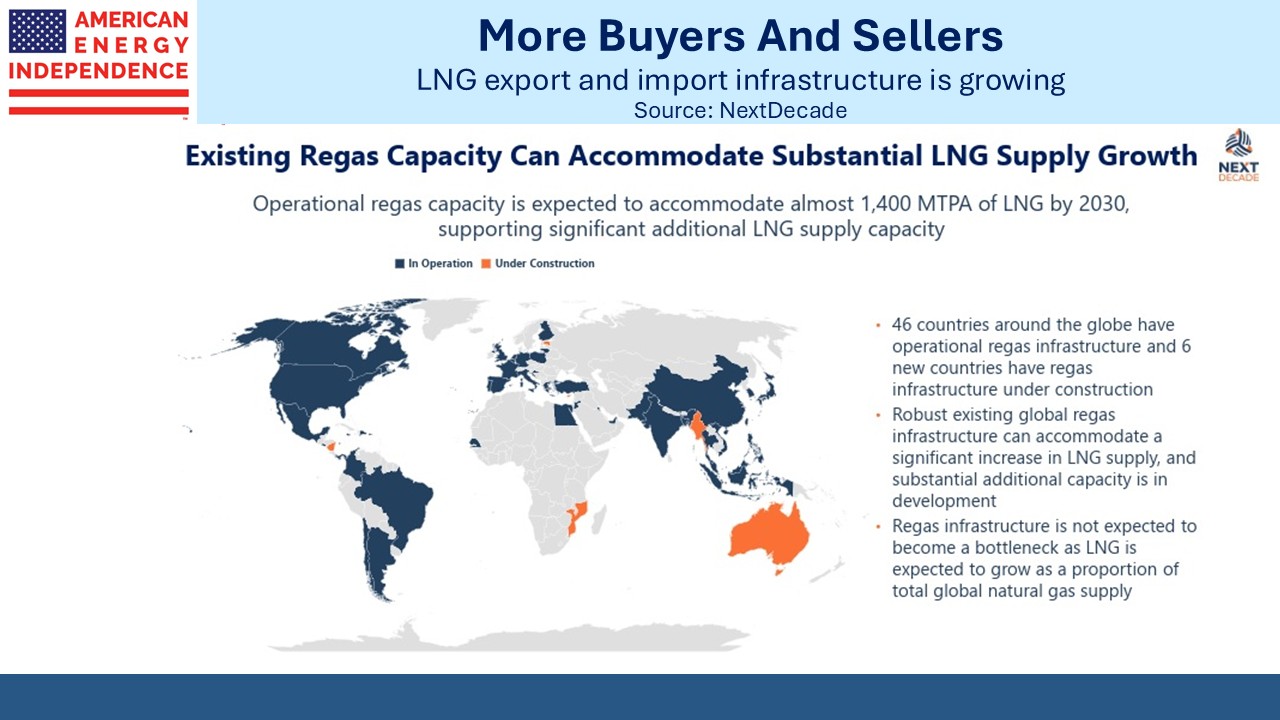
Shell expects LNG demand to increase by 50% through 2040. The biggest driver will be switching away from coal by China and other Asian countries. Even though Shell thinks overall natural gas demand could peak around then, they still expect LNG to continue growing.

The Energy Information Administration (EIA) provided one reason. They expect Indian consumption of natural gas to more than triple by 2050, with much of this increase coming from LNG imports.

Around half the gas consumed by India’s industrial sector is used to produce ammonia, which is then converted into urea, a fertilizer. Government policy is to produce more ammonia and therefore produce more urea domestically, thereby decreasing fertilizer imports.

Few climate extremists have given this much thought, but not every use of natural gas can be replaced with solar panels or windmills. Urea is produced from a series of chemical reactions at high temperatures. India’s population and per capita calorie consumption are growing. As living standards rise people eat higher quality food with more protein. If you’ve ever visited India, it’s unlikely you saw much obesity.

The EIA expects India’s primary consumption of energy to grow at a 3.9% annual rate through 2050, which means it’ll triple. They expect India’s economy to grow at 5% pa, more than 2X the global rate (China is 3.0% and the US 1.9%).

Even with annual growth in gas 2X China’s (4.4% vs 2.0% pa), by 2050 India will still be only around a third of China’s consumption and a quarter of the US. In other words, the EIA’s outlook for India doesn’t look excessively high.

It’s implausible that an emerging country like India will moderate its need for fertilizer just because US climate extremists think the world should phase out natural gas. If they’re unable to source enough gas elsewhere, they’re more likely to increase coal consumption in the power sector, freeing up more gas for urea production.

RBNEnergy published an interesting blog post reviewing the winners and losers from the Department of Energy pause on permits.

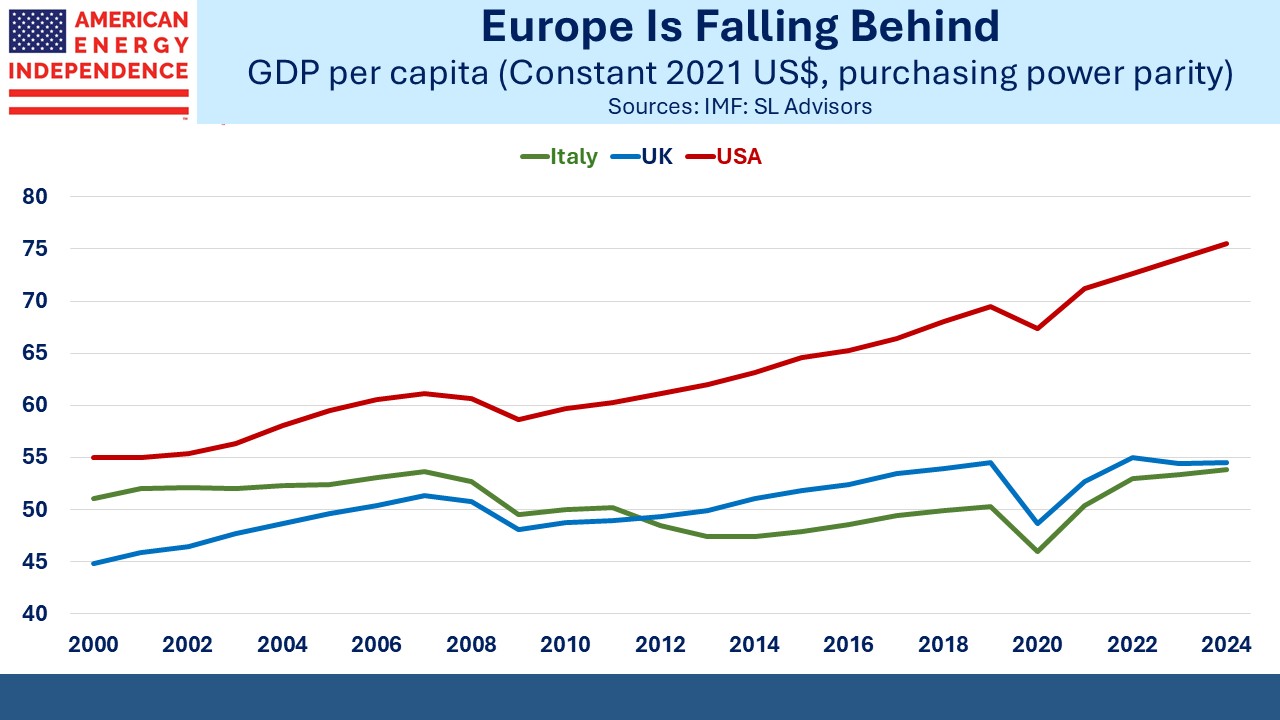
In other news, last week three of the G7 economies are now in recession. Japan reported -0.4% GDP for 4Q23 following a revised 3.3% decline in the previous three months. Their economy slipped to 4th biggest, replaced at third by Germany, even as they similarly reported two consecutive declines in GDP. The UK just did the same.

Japan has struggled with anemic growth for years hampered by the demographics of an aging population. But the other two are self-inflicted.

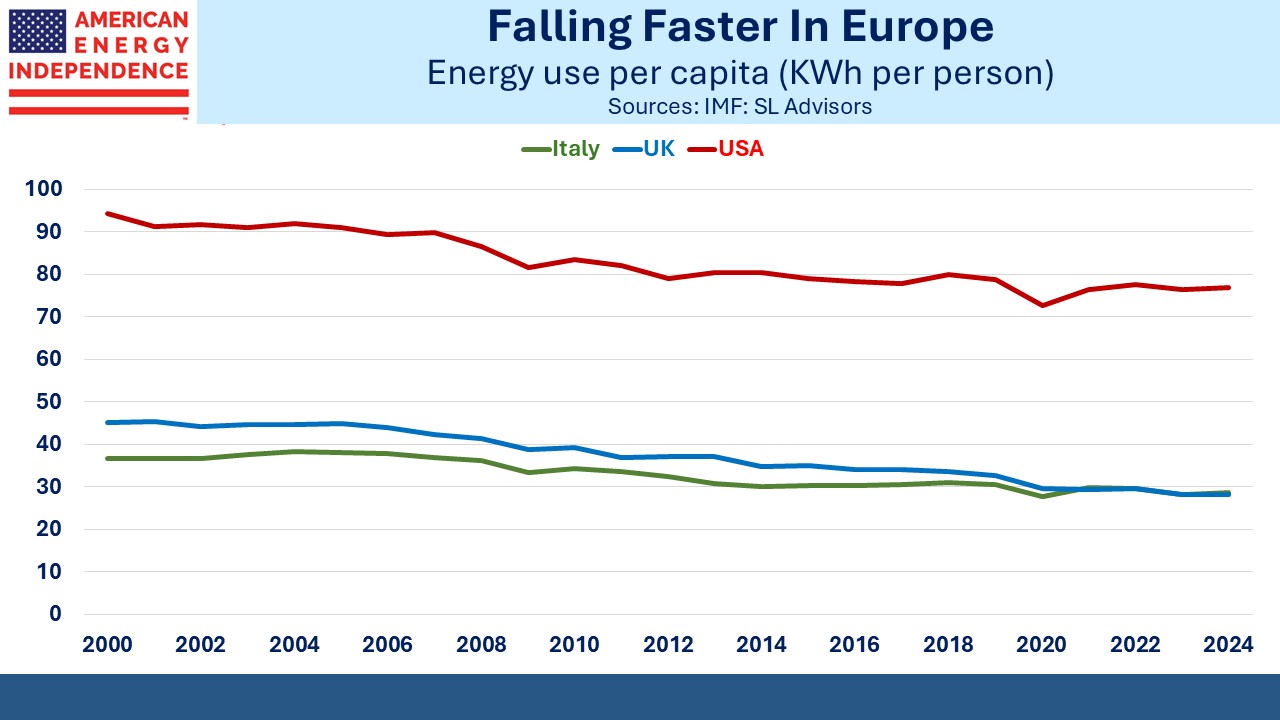
Germany has pursued economically ruinous energy policies even though at 2% of the world’s GreenHouse Gas (GHGs) emissions this effort is more about showing leadership than making a material change. Energy prices have become damagingly high for industry, prompting companies to cut back domestic production and relocate facilities elsewhere.

Last year Germany closed their last three remaining nuclear plants under a plan introduced by former chancellor Angela Merkel. The loss of Russian natural gas caused them to scramble for LNG imports as well as restart coal-burning power plants.

Germany’s emissions fell to their lowest since the 1950s last year, although this was driven in part by slower economic growth. The government wants to achieve a 65% reduction compared to 1990 within six years.

Few countries will find voters enthused about following Germany’s example, which is nonetheless rated “Insufficient” by Climate Action Tracker.

UK growth is being held back by Brexit, which has made it harder to trade with the rest of the EU. This won’t surprise the minority who voted against Brexit. Polls show most Britons now think Brexit was a mistake. The Conservative Party is struggling to show it was a good decision.

Both Germany and the UK are suffering the consequences of policy choices that were poorly advised, albeit ones that reflected the popular will. Democracies don’t always make good decisions.

.avia-image-container.av-mi9ad4-7b3900c945d53a3443d28d7f69f32a9b img.avia_image{ box-shadow:none; } .avia-image-container.av-mi9ad4-7b3900c945d53a3443d28d7f69f32a9b .av-image-caption-overlay-center{ color:#ffffff; }

What a contrast with the US, where economic growth is barreling along at 3.3% and the 3.7% unemployment rate shows there are jobs for anyone who seriously wants one. And we’re reducing our GHG emissions, just without creating a recession.

US energy policy has been broadly right, albeit the White House’s recent pause on LNG export permits is wrongheaded. A few European countries would benefit from following the US example.

We have three have funds that seek to profit from this environment:
Energy Mutual Fund

Energy ETF

Inflation Fund


America’s Still Increasing The Right Energy

The US Energy Information Administration (EIA) released its Short Term Energy Outlook (STEO) last week. It confirmed the current trends of increased production, improving mix and declining CO2 emissions.

Most notable is that coal production is continuing to fall. This year should see output 20% below 2022, at 470 Million Short Tons (MSTs). We use most of it at home but will still export 94 MSTs this year. Opponents of LNG exports should take note – this is where they should be focusing their attention.

.avia-image-container.av-2gtrnbh-8bf1fe1729743f04ccb17ab872342f43 img.avia_image{ box-shadow:none; } .avia-image-container.av-2gtrnbh-8bf1fe1729743f04ccb17ab872342f43 .av-image-caption-overlay-center{ color:#ffffff; }

Natural gas and crude oil output are both edging up. We averaged 12.9 Million Barrels per Day (MMB/D) of crude output last year, which the EIA forecasts will increase to 13.1 MMB/D this year and 13.5 MMB/d in 2025.

.avia-image-container.av-22lxajx-1185f8ef3b4e3ef3249f5fc444a00d65 img.avia_image{ box-shadow:none; } .avia-image-container.av-22lxajx-1185f8ef3b4e3ef3249f5fc444a00d65 .av-image-caption-overlay-center{ color:#ffffff; }

Overall petroleum products consumption is stable at around 18 MMB/D. The link between crude prices and pipeline cashflows continues to weaken (see Pipelines Shed Their Oil Sensitivity) because of stronger balance sheets. But volumes are more stable than prices. US liquids consumption grew at 0.9% per annum in the decade to 2022 according to the Energy Institute’s 2023 Statistical Review of World Energy (formerly published by BP). This stability is an under-appreciated feature of midstream infrastructure.

US gasoline demand is peaking at around 8.9 MMB/D. Increased Electric Vehicle (EV) penetration is a factor, along with improved mileage on conventional cars. EV sales have slowed recently, and the EIA doesn’t disclose its assumptions on future growth. Your blogger remains unconvinced that an EV purchase would meaningfully improve household happiness.

Consumption of aviation fuel is growing, and not just thanks to Taylor Swift. This is especially true in developing countries as a result of rising living standards. Jet fuel consumption was growing at 3% pa until the pandemic struck. Volumes are still recovering.

Use of hydrocarbon gas liquids (also known as Natural Gas Liquids) including propane (heating/cooking) and ethane (plastics and other petrochemical uses) is also growing.

.avia-image-container.av-5blrnx-fe9563eedc79e041542d50c56708e8a7 img.avia_image{ box-shadow:none; } .avia-image-container.av-5blrnx-fe9563eedc79e041542d50c56708e8a7 .av-image-caption-overlay-center{ color:#ffffff; }

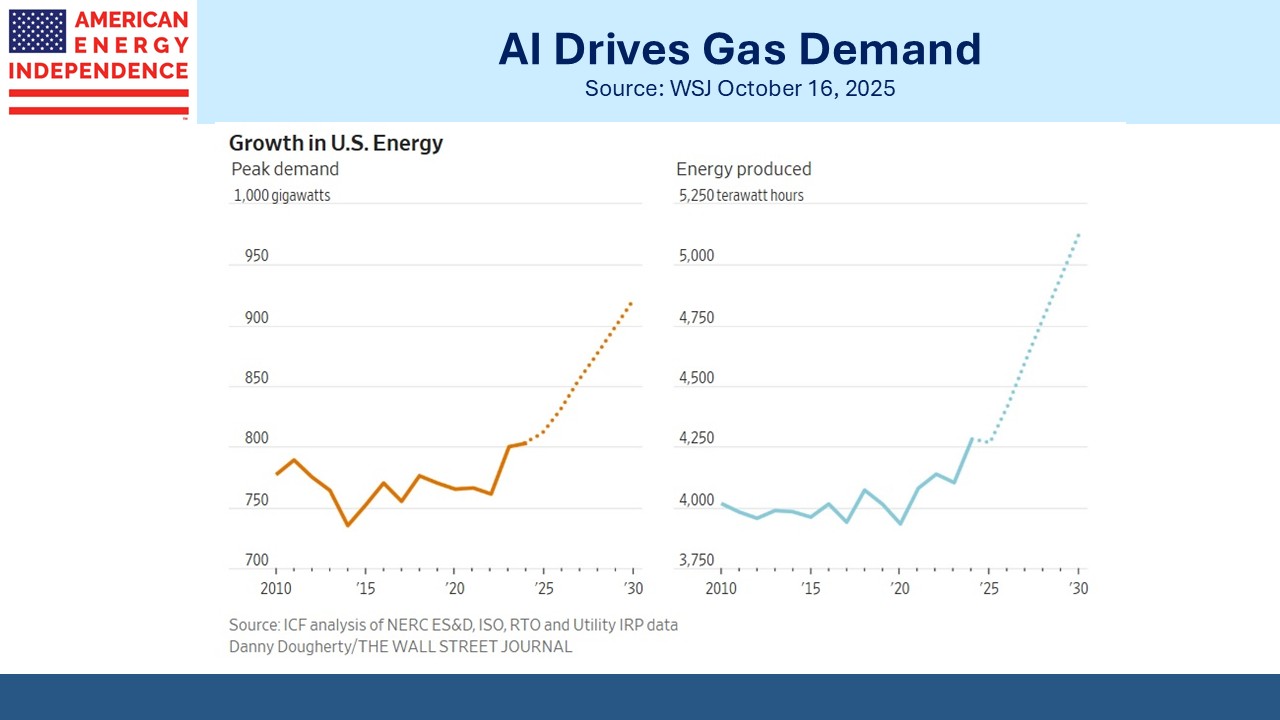
Power generation continues to deliver good news. Coal’s share of electricity generation will drop to 14% by 2025, from 21% in 2022. Natural gas reached 42% last year but is expected to slip to 41% by 2025 as non-hydro renewables grow from 15% to 19%. Our electricity is getting both bluer and greener.

Windpower currently provides almost twice as much electricity as solar. However, from 2022-2025 solar capacity is set to more than double, which will bring them roughly in line. Many will be surprised to learn that windpower output will grow at less than 3% pa 2022-25.

.avia-image-container.av-144ki99-d23fc3a290ec5fd74ce8d24381bdb293 img.avia_image{ box-shadow:none; } .avia-image-container.av-144ki99-d23fc3a290ec5fd74ce8d24381bdb293 .av-image-caption-overlay-center{ color:#ffffff; }

The net result is that we’re becoming better able to export energy security to our trade partners while also reducing our own CO2 emissions, which will fall from 4.9 billion metric tonnes to 4.7 (2022-25).

A pragmatic energy transition is unfolding. Patrick Pouyanné, CEO of France’s TotalEnergies, was interviewed recently in the Financial Times. He rejects the notion that renewables will lead to cheaper electricity, noting that, “renewable intermittency is less efficient.” He feels the prospect of permanently higher prices makes power an interesting sector in which to invest. Total has also been active in signing LNG deals, including with US-based NextDecade, whose planned Rio Grande export terminal is not affected by the recent White House pause on new approvals.

.avia-image-container.av-w5puzx-54b1ec76dd8fe2a7b55a29629795aee6 img.avia_image{ box-shadow:none; } .avia-image-container.av-w5puzx-54b1ec76dd8fe2a7b55a29629795aee6 .av-image-caption-overlay-center{ color:#ffffff; }

China convinced outgoing climate czar John Kerry that they’re striving hard to reduce their CO2 emissions. They burn over half the world’s coal which is the main source of electricity for their EV market, as this blog often points out. They’re adding coal-burning power plants at more than one a month.

China is also adding substantial solar and wind capacity. It’s often seemed to us that energy security is the driver of China’s choices, rather than the energy transition. If they’re anticipating conflict over Taiwan in the next few years, it makes sense to reduce their need for oil imports as much as possible.

The WSJ recently noted the huge growth in China’s renewables capacity (see China’s Carbon Emissions Are Set to Decline Years Earlier Than Expected). The 300 Gigawatts of solar and wind China added last year is more than total US capacity. China installed over 500 million solar panels.

The photo showing a vast area of solar panels dotted with wind turbines is unlike anything you see in America. Climate Action Tracker now thinks China’s emissions could peak next year but doesn’t expect them to immediately decline.

There are many examples of progress in reducing emissions, and US natural gas production continues to grow because it’s part of the solution.

We have three have funds that seek to profit from this environment:
Energy Mutual Fund

Energy ETF

Inflation Fund


Struggling To Justify The Pause

We’ve received a lot of questions recently about the White House pause on approving new Liquefied Natural Gas (LNG) export terminals. Several projects are already under way, and the pause does not rescind approvals that have already been issued. So for example construction of NextDecade’s Rio Grande terminal is continuing, with permits already in hand.

It immediately looked to use like a politically motivated decision (see White House Adopts An Energy Policy Where Everyone Loses). It’s easy to be dismissive of choices intended to gain votes. Democracies allow that even if the result is poor policy.

The pause is intended to allow the Department of Energy (DOE) to examine the climate impact of US LNG exports – obviously this study could be carried out without pausing new approvals. The immigration policy catastrophe is causing the White House to pivot away from progressives on that issue – hence the need to provide left wing voters an alternate reason to vote in November.

A handful of Democrat congressmen have been critical, worried that it will cost them votes of energy workers in their districts.  Senator Joe Manchin (D-WVa) is holding hearings on the issue.

An official at the DOE said that they were concerned about the harm LNG exports might cause to nascent plans to develop green hydrogen among potential LNG buyers. Those countries will decide for themselves what energy mix suits them. No country, including the US, has much ability to influence the energy choices other countries make. China is the world’s biggest importer of LNG and consumes over half the world’s coal. India burns coal for three quarters of its power and plans to sharply increase its imports of LNG. Making energy prices higher for these buyers isn’t the solution.

The DOE official’s response is so implausible it shows they’re struggling to come up with coherent justifications. The pause is about November’s election not thoughtful climate policy.

Wealthy opponents of US LNG exports include members of the Rockefeller family and Michael Bloomberg. It’s always the people who fly in private jets and and have never bothered to register for TSA Pre-check that cynically push restrictive energy policies they can afford to avoid.

Taylor Swift will be jetting in from Tokyo to Las Vegas just in time to see Travis Kelce play in the Superbowl. Anticipating criticism of the CO2 emissions from her global concert tour, she bought 2X the carbon credits her private jet will generate as an offset. The effectiveness of such credits varies. She has many talents but wouldn’t make a credible proponent on climate issues.

Nonetheless the impact on stock prices has been muted. Energy Transfer (ET), whose proposed Lake Charles LNG export terminal is affected by the pause, closed up on the day of the announcement (January 26th) and on the following trading day as well.

Cheniere’s Midscale trains 8-9 aren’t yet permitted. Wells Fargo estimated that if the project is never completed that would reduce their “sum-of-the-parts” valuation of Cheniere by around 4%.

Woodside Energy, itself Australia’s leading natural gas producer, is in talks with ET about buying LNG from their Lake Charles terminal assuming it gets built.

LNG infrastructure takes years to build, and the consensus is that following the election Trump or Biden will restore the approval process. The pause has gained the attention of energy investors but hasn’t done much else.

.avia-image-container.av-pye5z0-aa8c2f3bda4ccb241d0b2a0645ddc51d img.avia_image{ box-shadow:none; } .avia-image-container.av-pye5z0-aa8c2f3bda4ccb241d0b2a0645ddc51d .av-image-caption-overlay-center{ color:#ffffff; }

The EU’s seven biggest gas consuming countries have seen consumption drop 21% over the past two years. The loss of Russian supply has exposed them to high global LNG prices, depressing growth. Many German industrialists regard domestic energy policy with its rush towards renewables as ruinous to their manufacturing base. One business chief recently complained that it was impossible for companies to make investment decisions when they can’t be certain what their energy supply will be or what it will cost. He called current policies “toxic”.

Germany’s economy didn’t grow last year, and probably won’t this year. They could use more cheap US LNG, which Biden promised would be coming in the wake of Russia’s invasion of Ukraine in March 2022.

Alex Epstein, author of Fossil Future and The Moral Case for Fossil Fuels, calls it “a deadly fraud”. His talking points are here. Epstein argues that civilization is much safer today from extreme weather because of fossil fuels. He believes emerging economies should focus on raising living standards over the next several decades by which time new technologies and their increased wealth will make tackling the problem much easier than it is now.

Given how relentlessly coal consumption is growing among developing countries led by China, it looks as if they have embraced Epstein’s philosophy.

Smart climate policy will see the pause lifted within a year. We think that’s what will happen.

We have three have funds that seek to profit from this environment:
Energy Mutual Fund

Energy ETF

Inflation Fund


Is Energy Becoming Less Cyclical?

It’s a question posed at every mid-cycle. Observers of commodity markets will often advise that the cure for low prices is low prices. Meagre profits reduce production, eventually curbing supply and driving prices higher.

2014 was the last cycle peak for energy. The shale revolution brought new US supplies of oil and gas onto the market, which upset the prior equilibrium. The downturn that followed had run its course by 2019 when the pandemic caused another leg down. But the industry embraced financial discipline, reducing capex and improving returns.

An essay by Veriten’s Arjun Murti makes the case that the current cycle of positive returns has many years left.

Murti’s favored metric is Return On Capital Employed (ROCE), and he notes that high ROCE generally corresponds with a high weight in the S&P500. Today energy remains at an historically low 4% market weighting, while returns are the best in over three decades. Murti believes that we’re a couple of years into a 10-15 year bullish cycle.

.avia-image-container.av-149e48h-1b3c2f9d240671358859ef888138e2db img.avia_image{ box-shadow:none; } .avia-image-container.av-149e48h-1b3c2f9d240671358859ef888138e2db .av-image-caption-overlay-center{ color:#ffffff; }

This theory will please energy investors. But another possible explanation is that energy companies are eschewing the normal boom/bust capex spending cycle that has long pervaded their industry. High ROCE would normally draw additional capital, but continued capital parsimony generally prevails.

Adjusted for inflation, energy capex is still less than half of the 2014 peak.

Uncertainty about the path of the energy transition has added to the caution practiced by many CFOs. Climate extremists stand ready to criticize the big publicly traded energy companies and file lawsuits to impede their activities.

The other day I was in a discussion sponsored by the Naples Council on World Affairs. One participant bitterly criticized Exxon Mobil for withholding internal research decades ago that showed the potential for fossil fuel combustion to lead to global warming. I reminded him that climate extremists have been at least as disingenuous. Many have preached that the world can run entirely on solar and wind, in willful disregard of science and the facts.

If energy companies have presented facts to suit them, the Sierra Club and wretched little Greta have routinely offered policy prescriptions grounded in fantasy. Alex Haraus and his anti-LNG TikTok crowd belong in the same gang of socialists trying to impose poverty and starvation on billions of people (see White House Adopts An Energy Policy Where Everyone Loses).

The coincidence of a high industry ROCE with low market weight could have another possible explanation – that we’re in a profitable equilibrium where high returns aren’t drawing dilutive capex because the reasons for financial caution are likely to persist.

.avia-image-container.av-sy1c4x-51d5edc77fad06e77108f16b8bab8cc4 img.avia_image{ box-shadow:none; } .avia-image-container.av-sy1c4x-51d5edc77fad06e77108f16b8bab8cc4 .av-image-caption-overlay-center{ color:#ffffff; }

This is illustrated in the “Quadrilateral of Death” which shows low returns leading to higher oil followed by higher returns, then lower returns caused by inferior capex and finally lower prices, returning to the starting point. But today we’re sitting in the middle of the quadrilateral, with decent returns and moderate prices. Perhaps it’s the sector’s Goldilocks moment – neither too hot nor too cold. The market has found a balancing point where excess returns aren’t self-destroying because of the continued uncertainty about the energy transition.

Oil and gas projects often require a decade or more to generate adequate returns. Forecasting demand and prices over such a long period is harder than in the past. Perhaps we are at the point of Happy Equilibrium.

If you read Murti’s research paper you’ll find it informative, and perhaps like me be mildly amused at the pretentious use of plural first person pronouns. For example, at SL Advisors we are bullish on energy infrastructure. But we can’t emulate Murti when he says “we … moved to Goldman Sachs in 1999” (emphasis added) or refers to “our career.” Smile and look beyond the misused pronouns.

In other news, the White House’s moratorium on new LNG approvals has drawn criticism from moderate Democrats in Texas, Alaska and California. They’re worried that there aren’t enough progressives in their districts to offset those employed in the energy sector or perhaps don’t see this as an effective way to lower emissions.

Germany’s extreme climate policies are part of the political discourse. Siegfried Russwurm, head of Germany’s main industry association BDI, criticized the government’s approach as “dogmatic” and “absolutely toxic.” The country is facing a recession driven by high energy prices. There’s no place for nuclear power and they want to derive 80% of their electricity from solar and wind by 2030, up from 41% in 2021.

Germany’s recent progress on reduced emissions has largely come from lower industrial output. China and other developing countries will easily make up for it.

We have three have funds that seek to profit from this environment:
Energy Mutual Fund

Energy ETF

Inflation Fund


Why Is Oil Still Cheap?

Investors often ask us why crude oil prices aren’t higher. The industry has maintained capex on new production too low to sustain current production for years, without any apparent impact on prices. More recently, the Middle East has generated a plethora of  incidents which might be expected to cause consternation about the reliability of supplies from the region. Oil tankers are avoiding the Red Sea, taking the long route around southern Africa. One of Iran’s terrorist proxies just killed three US servicemen. And yet, there’s little discernible risk premium.

One reason is US supply has surprised to the upside, reaching 13.4 Million Barrels per Day (MMB/D) at the end of last year. US E&P firms have remained cautious about spending on production growth but have still managed to raise productivity with longer laterals in their horizontal drilling.

.avia-image-container.av-1vtn50f-132617e6566359b7c83cf6c58d1f28b3 img.avia_image{ box-shadow:none; } .avia-image-container.av-1vtn50f-132617e6566359b7c83cf6c58d1f28b3 .av-image-caption-overlay-center{ color:#ffffff; }

Another is that China’s recovery has been slow. Although they imported record volumes of oil last year, the rebound from the pandemic has been slow. The prevailing trend to 2019 would put them probably 3 MMB/D higher if not for Covid.

Sanctions imposed on Russia by the US and EU have been ineffective. Virtually all of their crude exports have been redirected to China and India, who are happy to buy oil at a discount to global prices. This has enabled Russia to maintain its earnings from the energy sector.

.avia-image-container.av-1tyq0m7-9d777d198251ad2bf644f9783927d4af img.avia_image{ box-shadow:none; } .avia-image-container.av-1tyq0m7-9d777d198251ad2bf644f9783927d4af .av-image-caption-overlay-center{ color:#ffffff; }

The IMF recently upgraded its 2024 GDP forecast for Russia, to 2.6%. This follows 3% last year and is double the IMF’s prior 2024 forecast. War expenditures are part of the reason, along with robust oil exports.

Russia has found other new buyers. Brazilian imports of diesel from Russia last year soared 4,600 per cent while purchases of fuel oil rose by almost 400 per cent.

Even NATO member Turkey is helping. Their Dörtyol terminal on the southern coast has seen a huge jump in shipments of Russian refined products which are then rerouted to Europe, in spite of EU sanctions. Some Russian fuel is reported to be in US warships operating in the region.

This has led some to argue that oil prices will never exceed $100 again. The FT notes that adjusted for inflation crude prices are roughly in the middle of the range that’s prevailed for over two decades.

The Biden Administration has pursued an ambiguous policy on crude prices. High oil enhances the competitiveness of EVs and should be welcomed by climate extremists. However, the White House also knows that millions of voters have more prosaic concerns such as the cost of their daily commute in a traditional car. Few dislike cheap gasoline.

One consequence is that Saudi Arabia directed Aramco to shelve plans to add 1 MMB/D to capacity, opting instead to keep output at 12 MMB/D. Almost a decade ago, when growing US shale production ate into Saudi market share, they responded by flooding the market in a desire to bankrupt the US E&P firms that were fracking. The Saudis were a year or two late, and although the US energy sector turned down, a renewed focus on innovation and capital discipline turned things around.

Today much of that US production is from bigger, well capitalized US majors following years of M&A. The Saudis don’t have the same option to harm them with lower prices. Their government deficit ballooned to $9.5BN in the most recent quarter. They need higher prices to balance the books.

.avia-image-container.av-zvsoe7-32d534efaf499af18565bbce17c8d932 img.avia_image{ box-shadow:none; } .avia-image-container.av-zvsoe7-32d534efaf499af18565bbce17c8d932 .av-image-caption-overlay-center{ color:#ffffff; }

Last week the CFA Society Naples held its annual forecast dinner. SL Advisors was a sponsor, and we invited some guests. The highlight of the evening was a panel discussion involving Tom Lee, Managing Partner of Fundstrat Global Advisors and Meghan Shue, Head of Investment Strategy at Wilmington Trust. It was ably moderated by CFA Naples board member Tyler Hardt.

An interesting discussion followed, with some useful points of disagreement. Tom Lee spent many years at JPMorgan and chatting with him afterwards we know some of the same people (I left in 2009).

.avia-image-container.av-ju5xa7-4b1594d07b9bffcbd77badf48ba38ad5 img.avia_image{ box-shadow:none; } .avia-image-container.av-ju5xa7-4b1594d07b9bffcbd77badf48ba38ad5 .av-image-caption-overlay-center{ color:#ffffff; }

During the Q&A, I asked how the panelists thought about climate change. Climate extremists rarely consider this issue, but equity markets don’t seem as worried as the more extreme progressives think they should be. Lee and Shue both felt that the impacts are too far away and uncertain to be a consideration in constructing portfolios. More relevant are government policies on taxes and spending related to the energy transition.

Another attendee asked where the panelists thought AI would have its biggest impact. Tom Lee offered health care as a sector likely to be significantly impacted. It’s occurred to me and no doubt many others that a doctor’s diagnosis, itself the result of a professional lifetime’s experience, can be supplemented by AI’s ability to analyze all the relevant data for an individual patient’s condition. Insurance companies may in time favor the AI diagnosis over the human professional. Lee suggested that over ten years or more, the AI impact on reducing healthcare spending may turn out to be an important factor in resolving our dire fiscal outlook, given the growing portion of government spending dedicated to Medicare.

I thought this was an intriguing perspective.

We have three have funds that seek to profit from this environment:

Energy Mutual Fund

Energy ETF

Inflation Fund