Still Fearing Another Financial Crisis

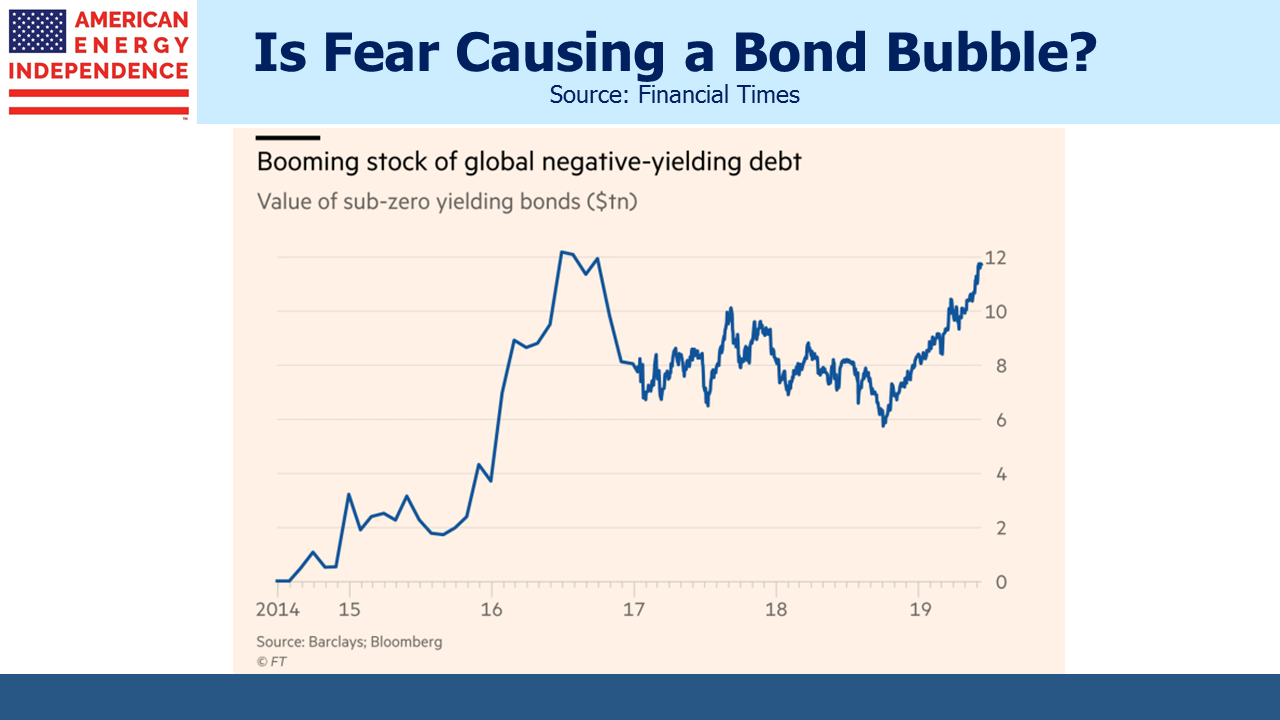
“Concerns about trade and Gulf tensions spur rush towards sovereign debt.” warned the Financial Times last week. Almost $12 trillion in bonds trades at a negative yield.  According to Tim Winstone, fixed income portfolio manager at Janus Henderson, “Investment grade is nuts. About 24% of my benchmark yields less than zero.” Even a dozen European junk bond issues trade with negative yields.

The comments by Tim Winstone reveal much about investor risk appetites today. As a fixed income manager, his job is to pick bonds and stay invested. His clients have already made their asset allocation choice. While he might rationally choose to shun junk bonds in favor of equities, which at least have the potential of a positive return, his mandate doesn’t offer such flexibility.

Colin Purdy, Chief Investment Officer at Aviva Investors, explained, “For some investors, there is an acceptance that it’s not about absolute returns, but relative returns.” This is true to a point, but most investors would add that positive nominal returns are a priority.

Firms that invest in bonds for clients are grappling with an excess of demand versus supply. Rigid fixed income allocations that are insensitive to return reflect extreme risk aversion.

.avia-image-container.av-wy8bgv-bb302609df3698f41b718d5701b61e40 img.avia_image{ box-shadow:none; } .avia-image-container.av-wy8bgv-bb302609df3698f41b718d5701b61e40 .av-image-caption-overlay-center{ color:#ffffff; }

Market participants are drawing different conclusions from this. A common misconception is that bonds reflect looming trouble for stocks. Someone once explained to me that bond buyers are naturally a dour bunch because we just want our money back, while equity buyers can dream of unlimited upside. But just because fixed income investors look more closely at balance sheets doesn’t mean that they’re always right.

If yields reflect extreme risk aversion, so do P/Es. While there’s no shortage of observers warning that stocks are over-priced, a lot of money that could buy equities is scared, preferring to own negative-yielding bonds instead. The conclusion must be that fear of another financial crisis runs wide and deep.

Infrastructure offers the stability of bonds with the upside of equities. This is especially true of midstream energy infrastructure (see The Coming Pipeline Cash Gusher). Valuations reflect the expectation of equity volatility with bond-like returns, but every quarter balance sheets strengthen, cash flows increase. Current holders are benefiting.

Last week, in Real Returns On Bonds Are Gone, we showed how much equities could appreciate before becoming historically expensive versus bonds. The quotes above from fixed income managers reflect widespread institutional risk aversion. At some level you might think firms would turn money away rather than invest it for negative returns. But they don’t, and it therefore falls to clients to impose more discriminating criteria.

What seems clear is that if stocks fall 25%, many investors will be comfortably positioned in fixed income. Their equity exposure was already set for that possibility.

But if none of the bad things people fear happen, and bonds fall, poor returns will be exacerbated by negative starting yields. The stock market continues to climb the wall of worry. Surprises will cause a drop, but the plausible negative events are priced in.

SL Advisors is the sub-advisor to the Catalyst MLP & Infrastructure Fund.  To learn more about the Fund,  please click here.

SL Advisors is also the advisor to an ETF (USAIETF.com).


Real Returns On Bonds Are Gone

A recent short term strategy outlook from a large buyside firm walked through market expectations for Fed policy, S&P earnings, the election and drew conclusions about the likely direction of stocks over the next six months. Such analysis is endlessly fascinating even if trading profits are unreliable.

The essay touched on, but didn’t examine, what must be the biggest force driving markets – persistently low interest rates.

The real return on ten year treasury notes going back almost a century is 2%. Given 2% inflation, a neutral Fed should cause long term yields to drift up towards 4%. The Fed has been manipulating rates lower for most of the past decade since the 2008-9 financial crisis, but last year the bond buying ended and short term rates began moving higher. Yet ten year note yields peaked at 3.3% in November before descending to 2% recently.

Clearly, the historic relationship has changed. The balance between demand for and supply of safe, long term assets has shifted. Bond investors collectively have accepted lower future returns. There is plenty of interesting academic research to explain why. Real interest rates have been in decline for thirty years, as shown in this chart from the Federal Reserve Bank of Minneapolis. They now appear to be negative, as defined by the average short term rate over the past decade.

.avia-image-container.av-nnt4wr-1f739620bb86586fc085b60a6b3eabed img.avia_image{ box-shadow:none; } .avia-image-container.av-nnt4wr-1f739620bb86586fc085b60a6b3eabed .av-image-caption-overlay-center{ color:#ffffff; }

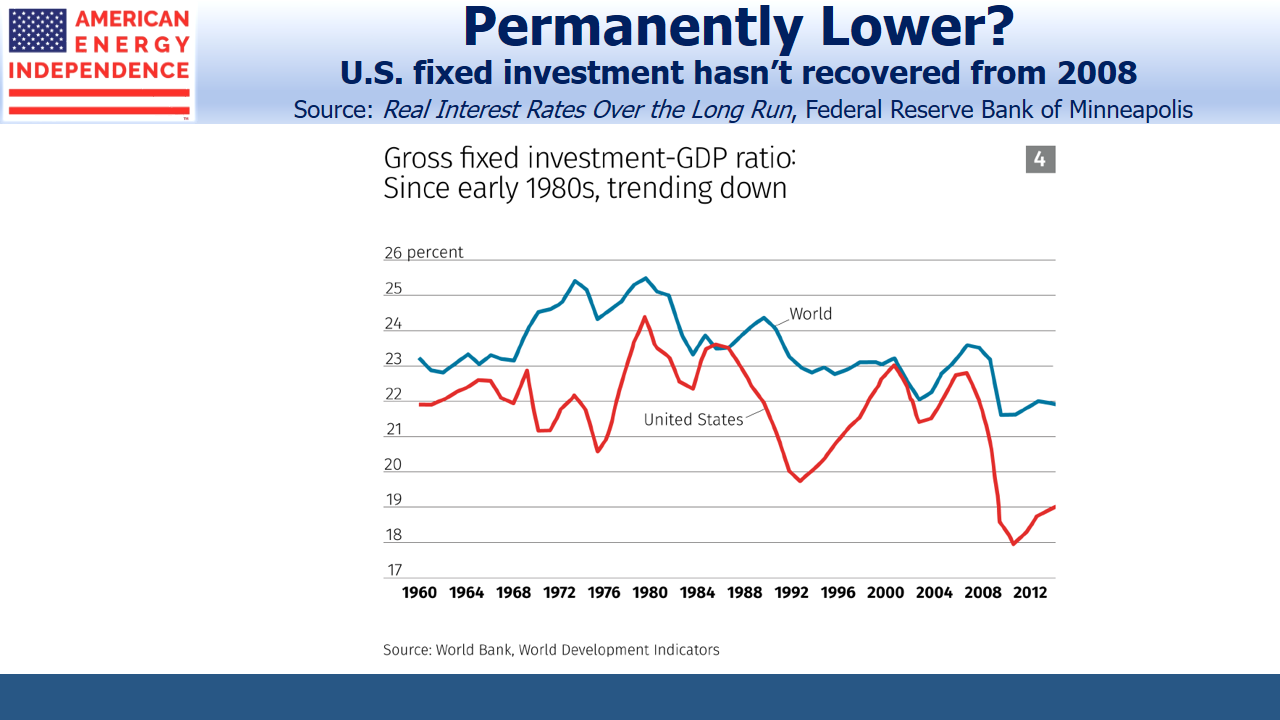
Although many commentators fret over what they perceive as unsustainably high stock prices, the plausible explanations for low interest rates largely reflect reduced risk tolerance by investors. While the decline in real rates has been steady, gross fixed investment fell sharply in the U.S. during the financial crisis and has barely recovered. This implies companies have remained cautious, dampening the issuance of long term corporate debt.

.avia-image-container.av-1h1derf-4f1100e59569b03afb1c2ba4c262bc37 img.avia_image{ box-shadow:none; } .avia-image-container.av-1h1derf-4f1100e59569b03afb1c2ba4c262bc37 .av-image-caption-overlay-center{ color:#ffffff; }

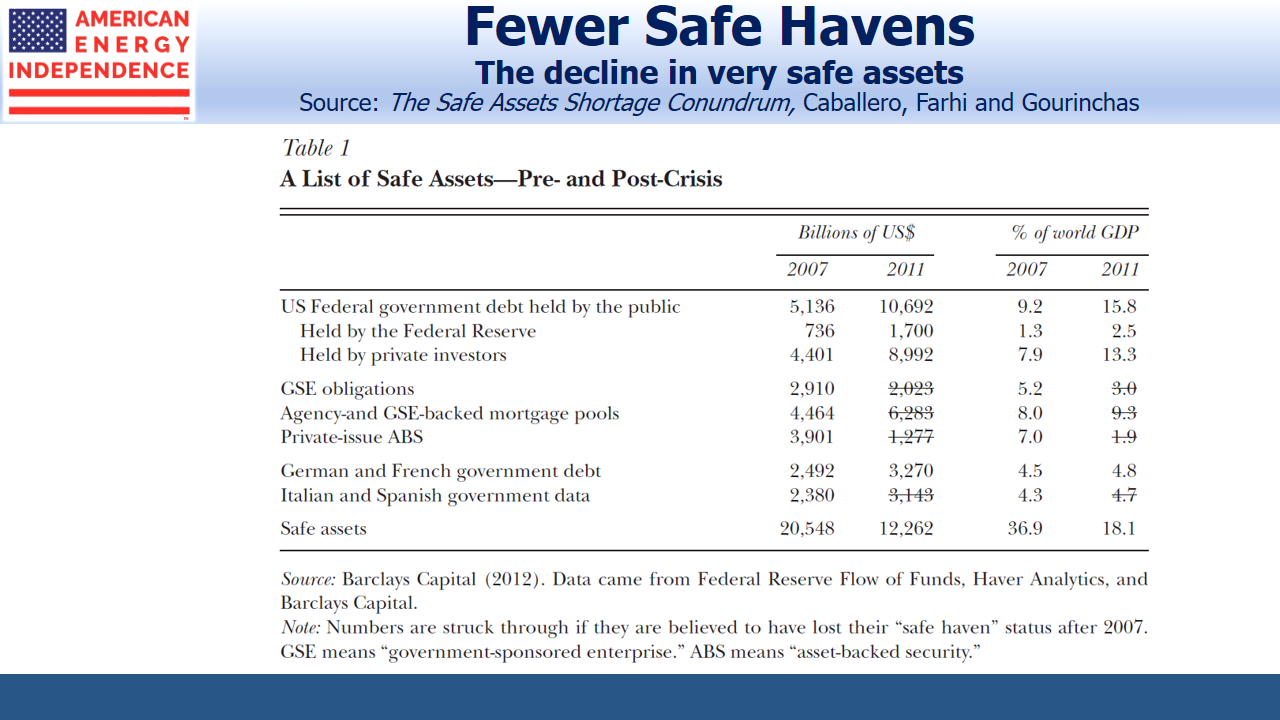
Another factor, highlighted in The Safe Asset Shortage (Caballero et al), notes that the financial crisis and subsequent Eurozone crisis led to a reassessment of which assets really were safe. Debt issued by FNMA and FHMC was assumed to be more risky following their conservatorship by the U.S. Unsatisfied demand for AAA debt instruments led Wall Street to produce Collateralized Debt Obligations (CDOs), which sought to pool riskier debt and repackage it into tranches of varying risk. But it turned out that the AAA tranche of a CDO retained some tail risk that sovereign debt did not. This perspective blames the 2008 crisis on unmet demand for safe assets.

.avia-image-container.av-1510f97-8f55a025659f33984c6aadea073345a5 img.avia_image{ box-shadow:none; } .avia-image-container.av-1510f97-8f55a025659f33984c6aadea073345a5 .av-image-caption-overlay-center{ color:#ffffff; }

Safe Assets Pre_Post_Crisis

Oddly, Caballero concludes that German and French sovereign debt similarly lost their allure. However, their yields are more than 2% lower than U.S. equivalents and solidly negative, which suggests ample holders willing to pay for what they perceive as highly safe investments.

Although memories of the financial crisis are receding, it seems to have permanently lowered risk tolerance. This, combined with a reduced supply of safe assets and perhaps the demographics of aging populations in wealthy countries have moved equilibrium long term rates lower. In recognition of this, the Fed has been adjusting their own long term equilibrium rate down in recent years.

A compelling solution is for a substantial increase in government funded infrastructure investment. This would take advantage of demand for long term debt and, assuming better infrastructure raised productivity, would not increase debt:GDP.

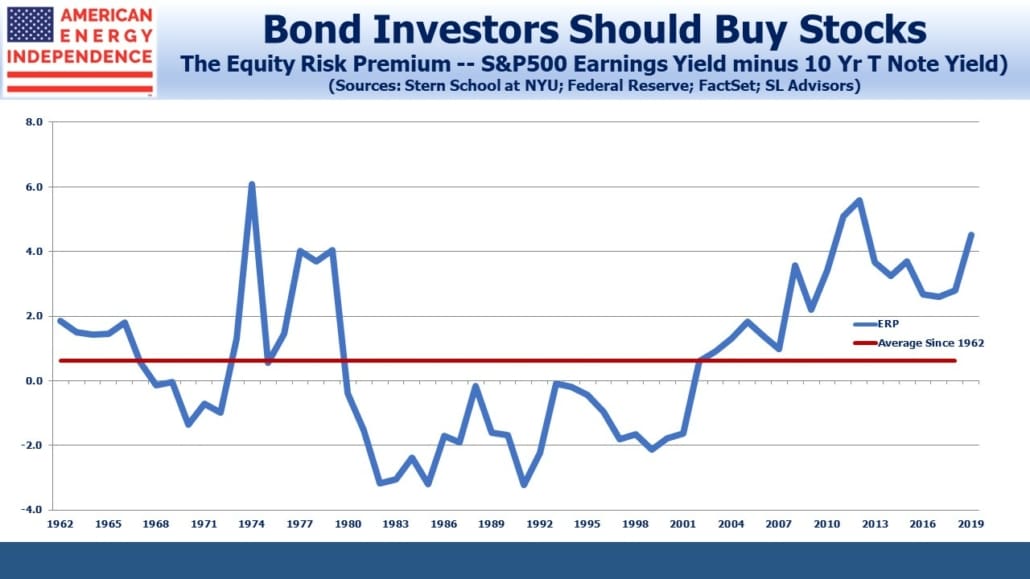
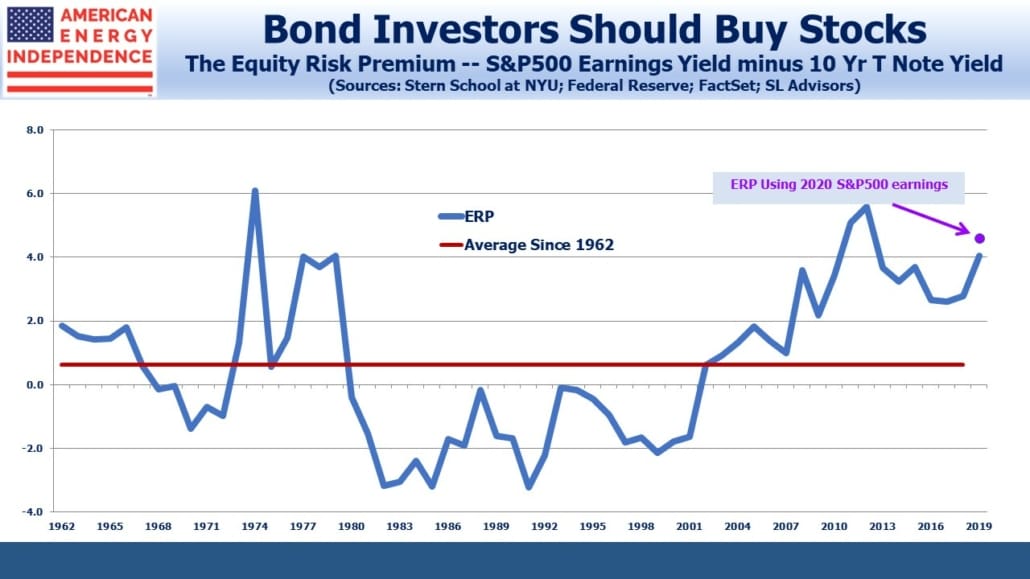
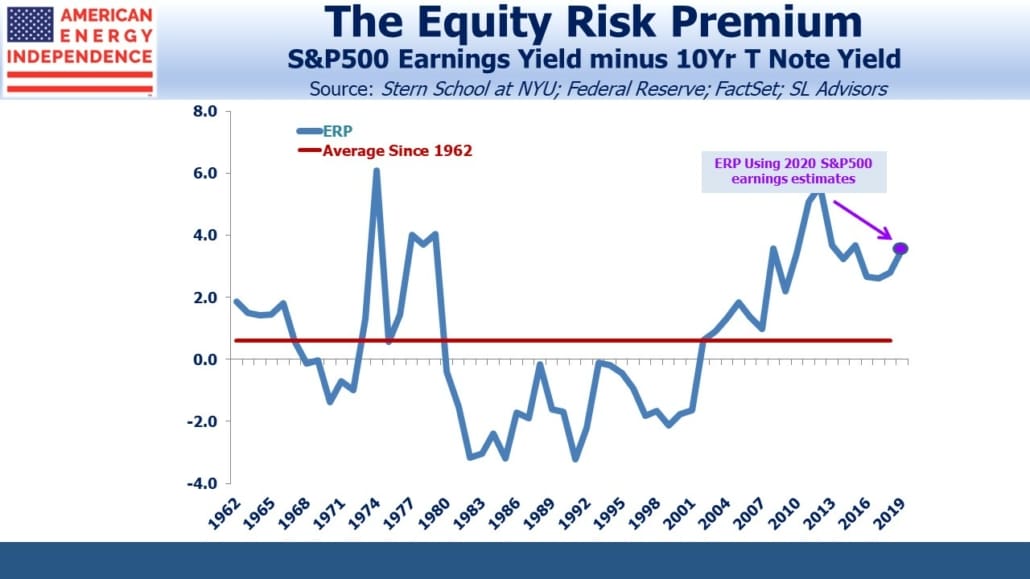
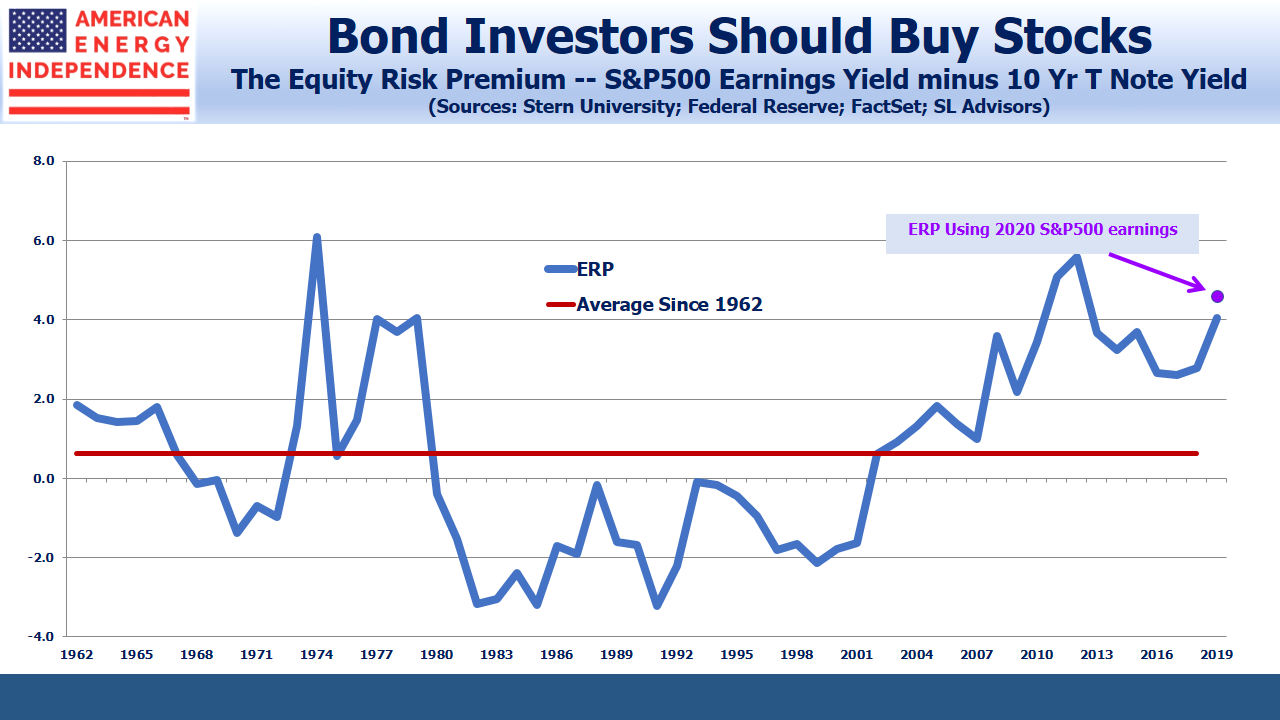
The shortage of safe assets is also reflected in the Equity Risk Premium (ERP), the difference between the earnings yield on the S&P500 and ten year treasury yields. It shows that stocks are cheap relative to bonds.

.avia-image-container.av-u0o5uj-ef5be190ec0c3f4d5844cbb54674316b img.avia_image{ box-shadow:none; } .avia-image-container.av-u0o5uj-ef5be190ec0c3f4d5844cbb54674316b .av-image-caption-overlay-center{ color:#ffffff; }

Since any investment is worth the net present value of its future cashflows, discounted at an appropriate interest rate, this has profound implications for stocks. Bond yields that are permanently lower suggest that stocks need to adjust substantially higher before fixed income can offer a competitive return.

The historically wide ERP underpins an investor’s choice to overweight equities. A return to its 50-year average of 0.6 (versus 3.6 today) isn’t imminent. But if next year it narrows halfway, to 2.1, and earnings grow by the 11% Factset bottom-up forecast, the S&P500 will be at around 4,400, nearly 50% higher than today.

U.S. energy infrastructure is an even better bet than the broader equity market. The shortage of high quality long term assets makes this sector especially attractive, as private equity funds seem to appreciate more readily than public markets.

Whatever the causes of permanently low interest rates, they strengthen the case for owning equities.

Join us on Thursday, July 11th at 1pm EST for a webinar. We’ll discuss the pipeline sector’s growing Free Cash Flow. To register, please click here.

SL Advisors is the sub-advisor to the Catalyst MLP & Infrastructure Fund.  To learn more about the Fund,  please click here.

SL Advisors is also the advisor to an ETF (USAIETF.com).


Can Trump Manage the Economic Cycle?

The current economic recovery, launched out of the cauldron of the 2008-09 financial crisis, continues to percolate. Directly following the 2016 presidential election, many stunned observers forecast numerous types of disaster. So far, those dire predictions have been wrong, although the future always provides lots to worry about

The cancellation of tariffs with Mexico fits the Trumpian pattern of seizing what’s on offer and declaring victory – not difficult when no lines had been publicly drawn in the sand. The president’s 2020 re-election campaign remains an important element in U.S. economic policy (see The Trump Put).

Tariffs on Mexican imports would have been disruptive to sectors such as autos, given the integrated supply chains made possible by NAFTA. Republicans in Congress were considering blocking them. The protracted dispute with China has dampened growth somewhat, but the consequent political pressure has, oddly, fallen more on the Fed than the White House.

Six months ago, Fed chair Jerome Powell carelessly allowed that multiple rate hikes might be coming: “Maybe we’ll be raising our estimate of the neutral rate and we’ll just go to that, or maybe we’ll keep our neutral rate here and then go one or two rate increases beyond it.” (see Bond Market Looks Past Fed).

Those hawkish comments were quickly walked back, while Trump has continued to call for lower rates.  Some view this as challenging the Fed’s independence. Ironically, much of the justification for lower rates lies with the constraints being placed on trade with China, policies implemented by the White House. Last week Powell said, “We do not know how or when these issues will be resolved.” He continued, “We are closely monitoring the implications of these developments for the US economic outlook.”

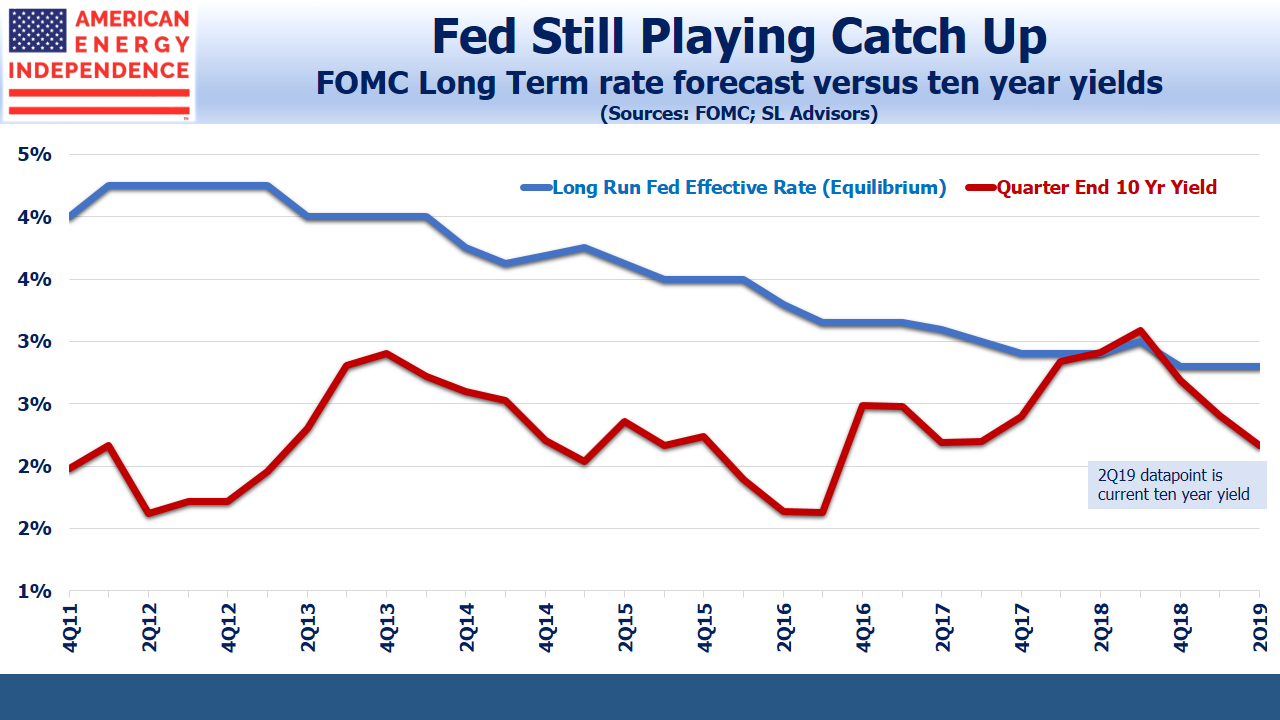
Once again, the Federal Open Market Committee’s (FOMC) “blue dots” are exposing how far behind the market they are. The FOMC’s long run equilibrium rate for the Fed Funds rate remains at 2.8%. Ten year treasury yields, a decent proxy for the average expected short term rate over the next decade, are much lower, at 2.17%.

.avia-image-container.av-p8sbbo-71222ca01fedc38dab97b68b9b36c1ab img.avia_image{ box-shadow:none; } .avia-image-container.av-p8sbbo-71222ca01fedc38dab97b68b9b36c1ab .av-image-caption-overlay-center{ color:#ffffff; }

FOMC Forecast vs 10YT Yield

For years the Fed has been lowering their policy guidance, lagging a process well anticipated by bond investors. Futures markets are predicting almost three rate cuts over the next year, while FOMC projections are for unchanged policy.

On current form, it’s likely the Fed will “independently” grant Trump’s desired rate cuts. Don’t be surprised if Chinese trade tensions are then resolved in time for the election. It seems to be how things work nowadays.

SL Advisors is the sub-advisor to the Catalyst MLP & Infrastructure Fund.  To learn more about the Fund,  please click here.

SL Advisors is also the advisor to an ETF (USAIETF.com).


Stocks Will Trump Tariffs

A couple of months ago we noted in Blinded By The Bonds the paltry yields available on long term debt. Since the 2008 financial crisis, the main driver of returns has been capital appreciation, since current income has been so low. Sure enough, over the last couple of months ten year treasuries have dipped another 0.3%, to around 2.1%. German ten year bunds now “yield” -0.20%. For an institution, the alternative is to hold currency in a vault. The cost of physical safekeeping of cash explains why investors are paying the German government to look after their assets.

The fall in long term yields reflects growing expectations that the Fed will cut short term rates. JPMorgan is forecasting two reductions in the Fed Funds rate by year-end. Yield curve historians fret that the inverted curve warns of a pending recession. It depends on the Fed. The bond market is telling them they have the wrong short term rate. The Federal Open Market Committee’s (FOMC) transparent process has removed all mystique.  Who remembers William Greider’s 1989 Secrets of the Temple: How the Federal Reserve Runs the Country? Or Bob Woodward’s 2000 volume Maestro: Greenspan’s Fed And The American Boom. The transition from deity to technocrat in FOMC leadership is complete.

We now see a bunch of government economists with no more information than the better private sector economists trying to figure it out. The mental dexterity to switch from raising rates (the FOMC’s posture through 4Q18) to cutting may take a year. The odds of a recession depend on the FOMC’s humble acceptance that they have little unique insight. Crowdsourcing monetary policy, relying on the signal from bond yields is the logical evolution. The FOMC faces a Behavioral Finance problem – over confidence, combined with anchoring to their previously held beliefs. The economy’s growth path will turn on how well they adapt their behavior.

Trade friction is a growing cause of concern. On this, we’d simply note that when President Trump moves into re-election mode, China’s then-current proposal will be seized and another victory for America claimed. Trump can’t control the market, but a president who Tweets the Dow’s milestones (even when they’re a return to old highs) is unlikely to let policy get in the way of boosting stocks (see The Trump Put). Tariffs are only an issue for 2019. The way bonds are moving, Trump may claim further credit for persuading the Fed to lower rates.

Falling bond yields and stock market weakness once again highlight the Equity Risk Premium (ERP), which is the difference between the earnings yield on the S&P500 and ten year treasuries. This starkly reveals the superior choice stocks offer versus bonds. At just over 4.0, the ERP is at a level reached only three times since 1962 (in 1979, 2011 and 2012). In each case, subsequent equity returns were quite satisfactory. Moreover, Factset is forecasting 11% S&P500 earnings growth, so the 2020 ERP looks even more compelling.

.avia-image-container.av-kiv77o-165ce2710c41d5402b4782b853b9bf50 img.avia_image{ box-shadow:none; } .avia-image-container.av-kiv77o-165ce2710c41d5402b4782b853b9bf50 .av-image-caption-overlay-center{ color:#ffffff; }

Equity Risk Premium

There will always be surprises. The biggest potential problem we see is Iran, where U.S. policy seems to have an undefined objective while steadily denying Iran access to sell its oil. It resembles U.S. policy towards Japan prior to World War II, when we denied them access to oil imports. As tensions rise in the Gulf, a military miscalculation is possible. Iran’s options are unclear. Although there are many more compelling reasons to be invested in midstream energy infrastructure, holding U.S. energy assets during a Middle East war would be a better bet than many.

SL Advisors is the sub-advisor to the Catalyst MLP & Infrastructure Fund.  To learn more about the Fund,  please click here.

SL Advisors is also the advisor to an ETF (USAIETF.com).


A Reactive Federal Reserve

The other morning a CNBC guest was able to share an insight not normally found on TV. The need for ten-second ideas greatly limits the ability of otherwise intelligent people to share much wisdom. R.J.  Gallo, whose Christian names are apparently only initials, trades municipal bonds for Federated Investors. He suggested that rates can rise slowly because people expect no worse.

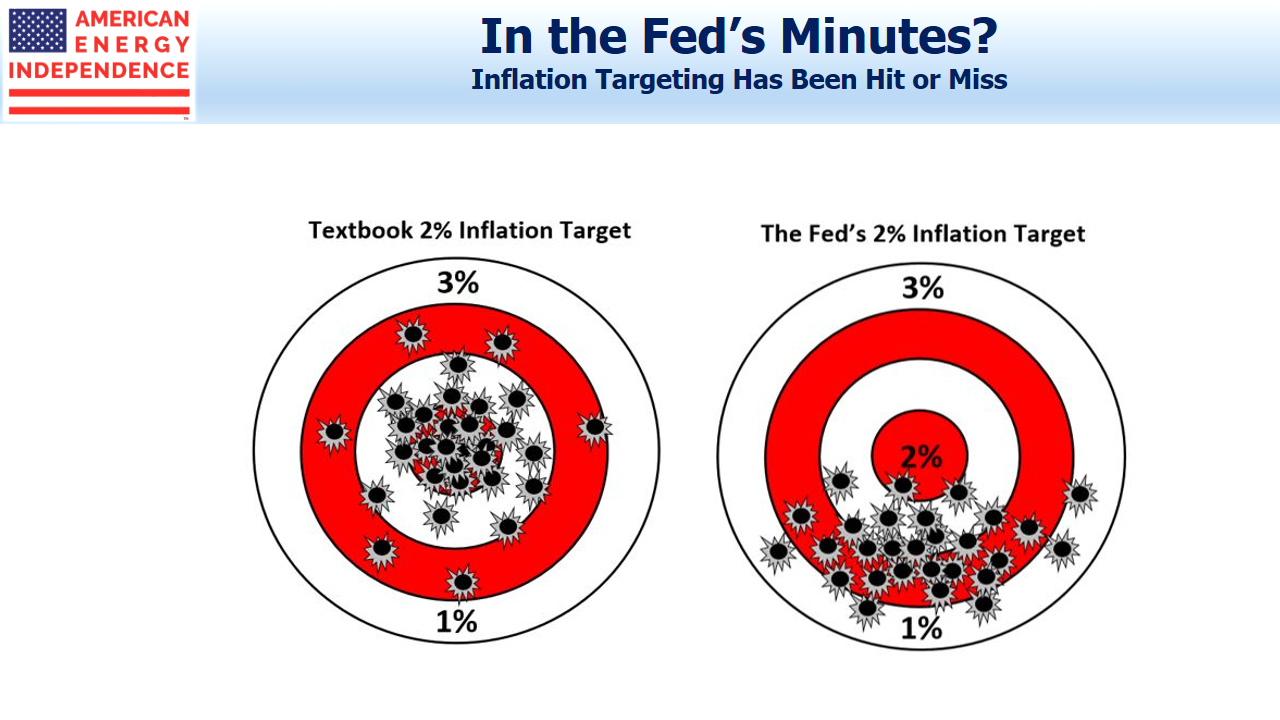
More precisely, Gallo said that because inflation expectations are so well anchored at around 2%, the Fed can wait until actual inflation rises. Gallo noted that, “The Fed has been unable to structurally hit their inflation target for many years.” He went on, “The Fed is not totally sure how the inflation process works”

.avia-image-container.av-qqlw3q-649ce3debedca7585bc12cce1cb4149d img.avia_image{ box-shadow:none; } .avia-image-container.av-qqlw3q-649ce3debedca7585bc12cce1cb4149d .av-image-caption-overlay-center{ color:#ffffff; }

Federal Reserve Missing Targets

This makes a lot of sense. The reason the Fed has maintained a Fed Funds forecast that’s too high is because they’ve incorrectly expected rising inflation. They’ve struggled at times to even get the Personal Consumption Expenditure price index (their preferred measure) to reach their 2% target.

The high inflation of the 1980s, which afflicted most developed economies, is more history than a memory for most market participants. “Almost a generation of people… have seen very low inflation for (a) very long (time).”

Gallo therefore argues that we’re, “moving to an era where the Fed is allowed to be reactive.”

That would represent a substantial shift in thinking. Fed chair from 1951-70 William McChesney Martin famously said, “The job of central bankers is to take away the punch bowl just as the party gets going.”

Successive Fed chairs have ever since operated with the expectation that they were party poopers, although it’s probably a couple of decades since one acted that way.

Ten year treasury yields at 2.5% show there is little fear of rising inflation. This, combined with the Fed’s inability to identify the circumstances that will cause inflation, lead to the insight that the Fed is moving from proactive to reactive. They understand less than they used to. Or, given their more transparent decision making process, we now know that they always understood less than we thought (see Bond Market Looks Past Fed).

The conclusion for bond investors is that Fed policy on short term rates will follow bond yields, which is probably as it should be. Fed policy has been more accurately forecast by expectations embedded in the yield curve. Collective expectations of inflation are as good as the Fed’s best analysis, and perhaps better.

It’s a natural progression for short term rate policy to be increasingly set by bond investors. An inverted curve (as was briefly the case earlier this year) caused some fears that the Fed would cause a recession. The correct conclusion was that the path of policy rates was wrong. Fed chair Powell duly put this right (see Bond Market Corrects Fed).

Rising bond yields will be a necessary requirement for the Fed to push short term rates higher. Until that happens, investors can remain comfortable that the Fed is still on hold, which continues to favor stocks.

SL Advisors is the sub-advisor to the Catalyst MLP & Infrastructure Fund.  To learn more about the Fund,  please click here.

SL Advisors is also the advisor to an ETF (USAIETF.com).


Blinded By The Bonds

.avia-image-container.av-o5hoxd-b5439a9a04335976beced74869fc41a7 img.avia_image{ box-shadow:none; } .avia-image-container.av-o5hoxd-b5439a9a04335976beced74869fc41a7 .av-image-caption-overlay-center{ color:#ffffff; }

German 30 year bunds yield 0.6%. Investors are inured to insultingly low yields, but somehow this still shocks. The ECB defines price stability as inflation “…below, but close to, 2% over the medium term.” Assuming it averages 1.5%, investors are accepting a negative real return virtually in perpetuity.

French energy company Total (TOT) issued perpetual bonds at 1.75%, to buyers who are apparently satisfied with never earning a real return on a corporate credit.

Germany’s ten year yields are -0.05%. Could their 30 year bonds one day join them in negative territory? Japan’s ten year yield is -0.08%. U.S. ten year treasury yields of 2.4% are profligate by global standards.

There is some logic to accepting negative returns over the short term. You can only stuff so much currency under the mattress. But the point of investing is to preserve purchasing power. Somehow, bond investors have become trapped by inflexible thinking into self-destructive actions on a vast scale.

Asset allocations that rely on a split between equities and fixed income persist in maintaining some bond exposure even while loss of purchasing power is guaranteed. Clearly, tens of billions of dollars in assets has accepted this. The stewards of this capital retain a rigid adherence to portfolio diversification. Since falling yields have supported positive returns on bonds through capital appreciation, maintaining bond exposure hasn’t caused visible losses, for now.

Perhaps there’s a principal-agent problem here. The certain knowledge that an investment will lose money should cause an investor to change her selection. Self-evidently, if the purpose of saving is to consume tomorrow, when you know your purchasing power will be lower, perhaps you should consume more today and not save as much. If your career is buying bonds for clients, you’re unlikely to promote radical thinking.

The Equity Risk Premium favors stocks over bonds. This is true even though S&P500 2019 consensus earnings forecasts are being revised down. The current $168 forecast is down $10 since October, and puts the market’s P/E at around 17. But bond yields have also fallen, which has maintained equities’ relative attraction.

.avia-image-container.av-mp9z69-af0504a6afe016d05b8d37efcf220ca1 img.avia_image{ box-shadow:none; } .avia-image-container.av-mp9z69-af0504a6afe016d05b8d37efcf220ca1 .av-image-caption-overlay-center{ color:#ffffff; }

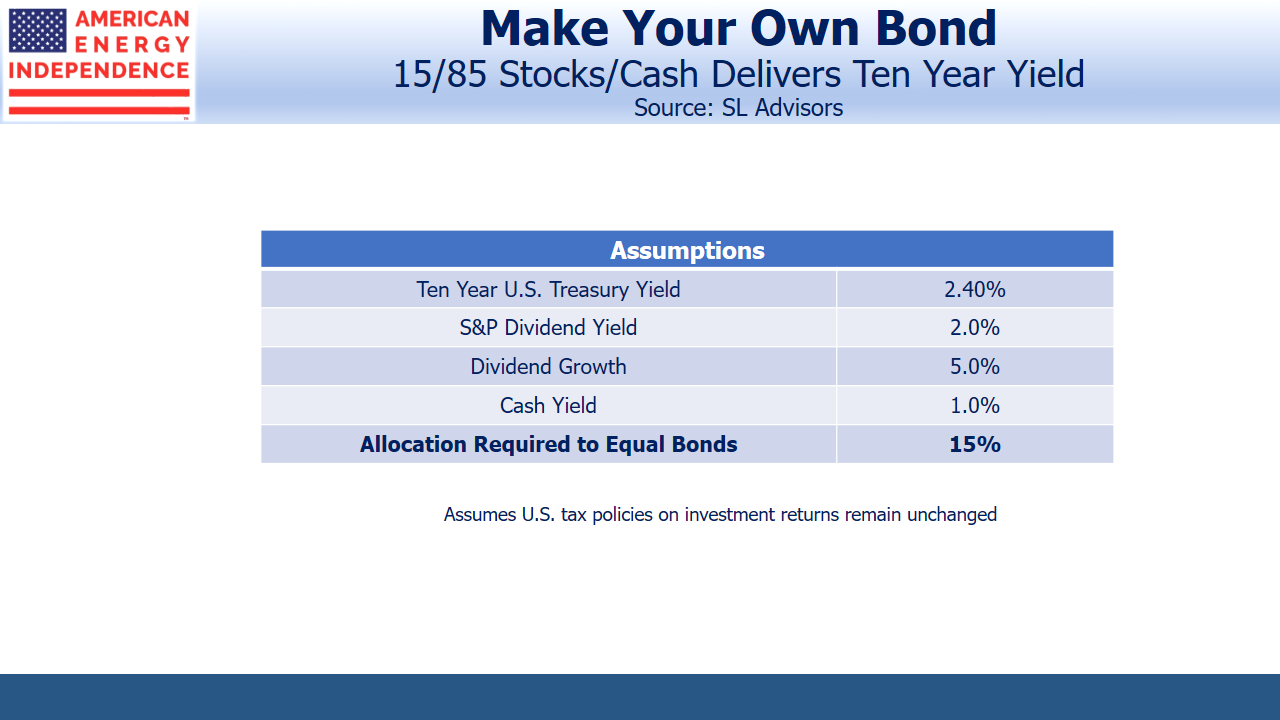
We’ve often illustrated the wide spread between the earnings yield on the S&P500 and bond yields by showing how little money invested in stocks could generate the same return as $100 in ten year treasury securities. Today, only $15 in the S&P500 would match the return on $100 invested in ten year treasuries at 2.4%, assuming (1) 5% dividend growth (which is the long-term historical average), (2) an unchanged S&P500 yield in ten years, (3) unchanged tax policies, and (4) that the other $85 is invested in a money market fund at an average yield of 1%.

.avia-image-container.av-1837qoh-0708daf1d9dd8c62f1457d13a9abc222 img.avia_image{ box-shadow:none; } .avia-image-container.av-1837qoh-0708daf1d9dd8c62f1457d13a9abc222 .av-image-caption-overlay-center{ color:#ffffff; }

Make your Own Bond Cash and Equity

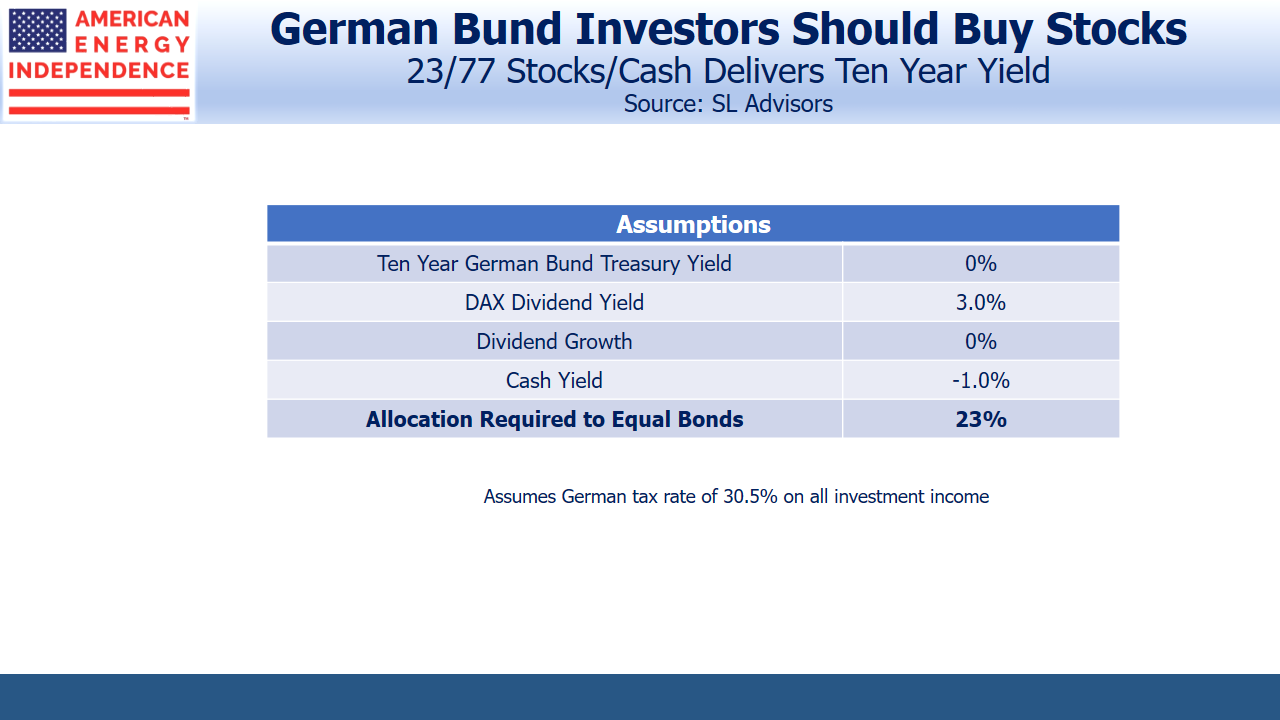
A German investor fleeing the tyranny of low domestic rates for the U.S. would have to hedge the currency risk, which thanks to the magic of interest rate parity would precisely eliminate the yield advantage. But German stocks yield 3%, a substantial advantage over ten year Bunds.

Bund yields are negative because short term securities are even more negative. Two year German bunds yield  -0.63%. To some degree, investors in long term bunds are fleeing even worse short term yields. The example above using equities and cash to achieve the return on ten year bunds still works though. Assuming cash rates of -1.0% for ten years, a 23/77 split between German stocks and cash would achieve the ten year Bund return of approximately 0%. This assumes no dividend growth, which is a highly conservative assumption and would suggest the DAX finish the decade where it started. Just 2% dividend growth improves equity returns and lowers the split to 14/86.

.avia-image-container.av-p0zitt-6c8fd5fa9c044f892f19f6f3c034f1e0 img.avia_image{ box-shadow:none; } .avia-image-container.av-p0zitt-6c8fd5fa9c044f892f19f6f3c034f1e0 .av-image-caption-overlay-center{ color:#ffffff; }

German Bund Investors

Returning to Total and their perpetual bonds – energy has been a miserable sector and is cheap, as regular readers know. Energy infrastructure offers dividend yields of 6% or more, with distributable cash flow yields above 10%. The buyers of Total’s 1.75% perpetual bonds prefer this to the 5.2% dividend yield on its stock. There’s too much money in bonds struggling to find an adequate return.

Although central banks have been substantial participants in global bond markets since the 2008 financial crisis, plenty of commercial buyers are also investing at current yields. They’re exhibiting a remarkable lack of intellectual flexibility. When returns are certain to leave you poorer, it’s time for some fundamental questions about the purpose of investing. Bond investors will probably have to endure a couple of years of steep losses before making that assessment. By then, the folly of investing in debt at today’s yields will be completely obvious and too late to correct.

SL Advisors is the sub-advisor to the Catalyst MLP & Infrastructure Fund.  To learn more about the Fund,  please click here.

SL Advisors is also the advisor to an ETF (USAIETF.com).


Bond Market Corrects Fed

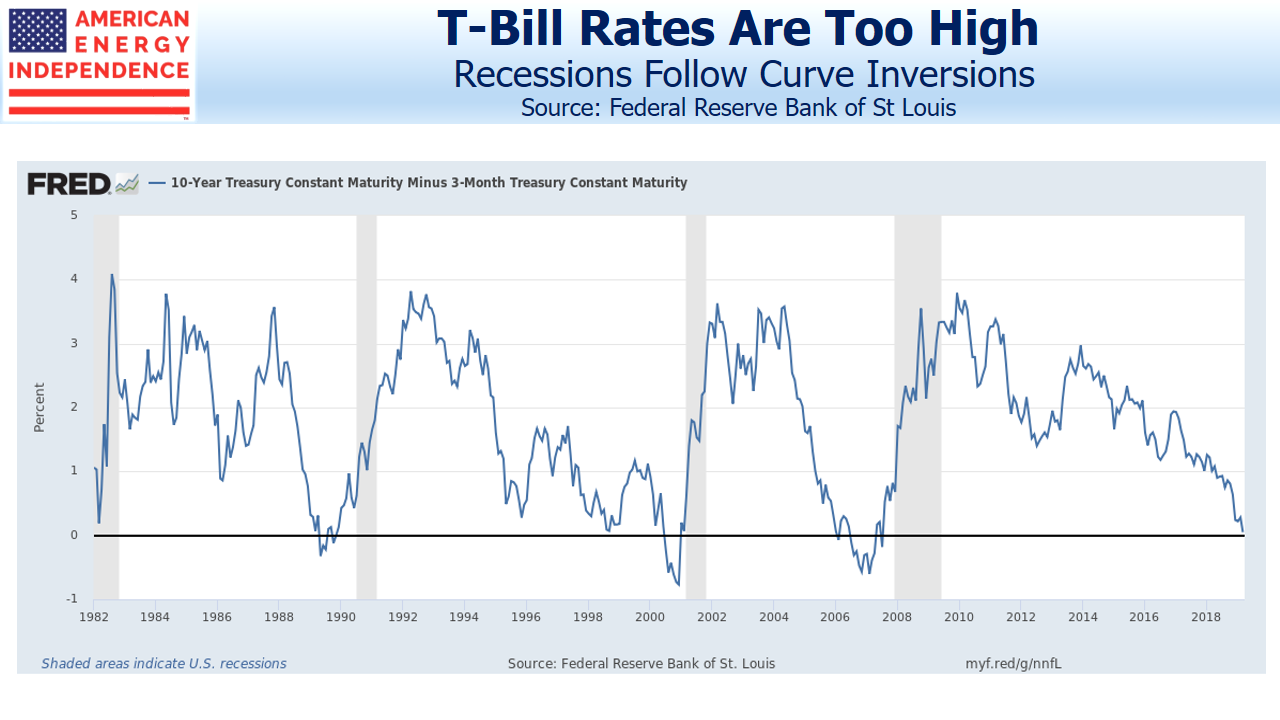
Last week stocks shuddered as ten year yields dipped below treasury bills, reminding investors that yield curve inversions eerily precede recessions. A Cleveland Fed model using the yield curve gives a 30% probability of a recession within a year, up from 24% in December. Nonetheless, the S&P500 is within 5% of its all-time high, reflecting only modest concern.

.avia-image-container.av-va9y3c-f50ce11b946fb27b38ba3ccfdcd643e9 img.avia_image{ box-shadow:none; } .avia-image-container.av-va9y3c-f50ce11b946fb27b38ba3ccfdcd643e9 .av-image-caption-overlay-center{ color:#ffffff; }

Recessions Follow Curve Inversions

A reliable point of agreement with any 15+ year market veteran is surprise at consistently low long term interest rates. We’ve all spent our entire careers fretting over the Federal deficit and the possibility that it could drive borrowing costs higher. Now it looks as if the peak in ten year yields for this cycle of 3.2% is lower than the prevailing yield prior to the 2008 recession.

Explanations include foreign central bank buying, even while the Fed unwinds its quantitative easing by allowing its balance sheet to shrink. And U.S. yields of 2.4% remain rich by comparison with other G-7 nations. Germany’s recently turned negative, along with $10TN of government debt globally.

There’s been a fundamental shift in the demand for long term bonds. Foreign buyers hold $6 TN of treasuries, around 39% of what’s publicly held. Japan and China each hold over $1 TN. Even though foreign central banks are regarded as price-insensitive buyers of bonds, that still leaves a lot of commercially driven holders who have accepted today’s low yields by choice.

Historically, the long term real return on ten year notes is 2%. The Fed’s inflation target has never wavered from 2%, and there’s been little reason for investors to anticipate anything less. 2% inflation plus a 2% historic real return implies 4% as neutral, a level never broached in the past decade.

Since the ten year treasury yield reflects the market’s forecast of short term rates over the next decade, the conclusion is that the Fed’s equilibrium short term rate is lower than in the past.

The FOMC has turned out to be very poor at predicting the near term path of short term rates, even though they control them (see Bond Market Looks Past Fed). Short term treasury yields have consistently been below the “blue dots” in the FOMC projection materials. Forecasting the Fed’s moves by looking at the yield curve has been more reliable than listening to the Fed.

The central tendency of the Fed Funds rate (i.e. long term neutral rate) in the latest FOMC projection materials is 2.5-3.0%. Their target for next year is 2.9-3.4%. These are both too high and likely to be wrong again. Rather than the inverted yield curve forecasting a recession, it’s more likely that the market is correcting FOMC forecasts farther out along the curve. Maybe the FOMC should give up forecasting altogether, and simply set the Fed Funds rate at 0.25% below the ten year, allowing the market to determine the appropriate level of rates.

The curve inversion isn’t forecasting a recession, it simply means the FOMC has set the Fed Funds rate too high. The more it inverts, the more wrong they are. The best response is to alter the yield curve’s forecast, by lowering short term rates. That’s their likely next move, although for now they’re on hold.

The flat yield curve is good news for energy infrastructure. We’re often asked how we think the sector will perform in an environment of higher rates. While we typically note the inflation-plus pricing built into many pipeline contracts, falling long term yields can only make MLPs and energy infrastructure corporations’ dividend yields even more attractive. There’s one less thing to worry about.

SL Advisors is the sub-advisor to the Catalyst MLP & Infrastructure Fund.  To learn more about the Fund, please click here.

SL Advisors is also the advisor to an ETF (USAIETF.com)


U.S. National Debt: The Bond Market Doesn’t Care

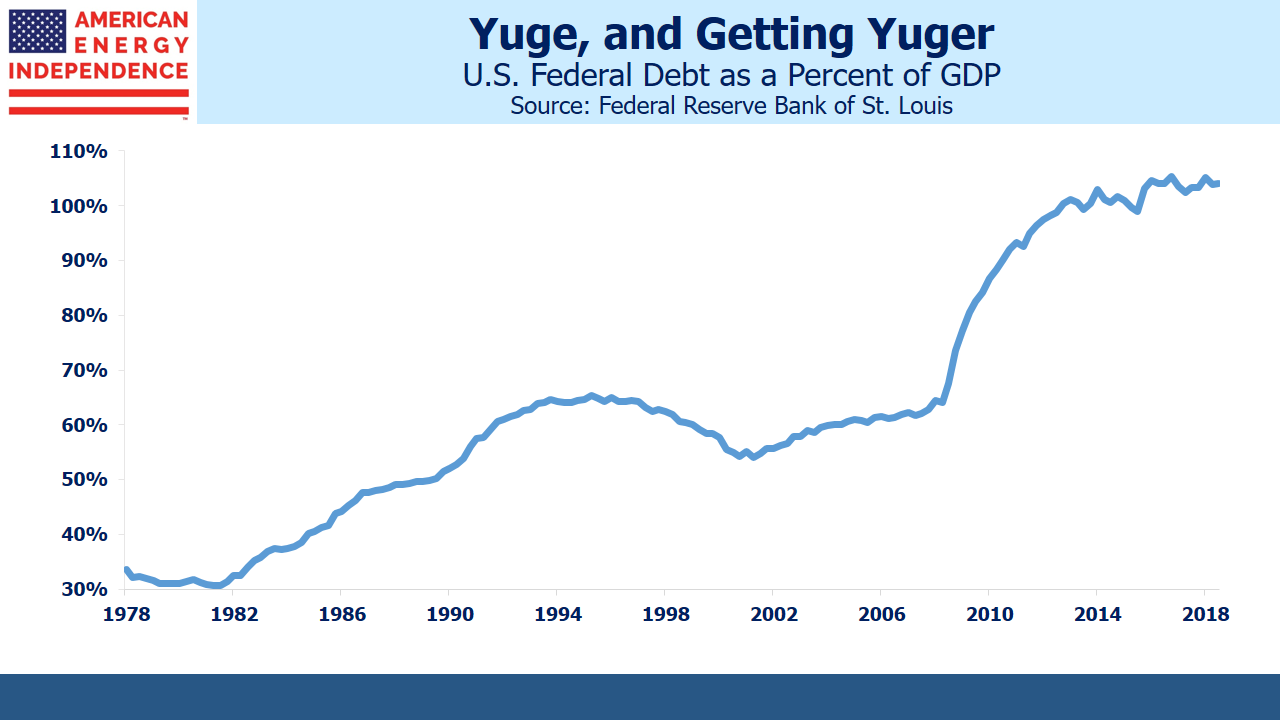
For almost my entire 38 year career in Finance, we’ve worried about the U.S. Federal deficit. Someone recently asked me if we should still be worried. You’d think that it should have been a problem by now, but it’s not. Thirty year treasury bonds yielding 3% don’t look enticing, but evidently a lot of investors feel differently. Low as they are, U.S. yields are substantially higher than Germany, whose 30 year bonds yield a paltry 0.73%.

.avia-image-container.av-rqibie-14f276c6e9bcfaea1a8751b081150c90 img.avia_image{ box-shadow:none; } .avia-image-container.av-rqibie-14f276c6e9bcfaea1a8751b081150c90 .av-image-caption-overlay-center{ color:#ffffff; }

Federal Debt as a Percentage of GDP

U.S. publicly-held Federal debt to GDP rose sharply following the 2008 financial crisis. Circumstances justified a temporary spike to provide fiscal stimulus, but instead it’s continued to grow. Nonetheless, rates just can’t rise — even though the Fed has stopped buying bonds, others have stepped in. Short term rates might even have peaked, following Fed chairman Jay Powell’s communication missteps in December.

The deficit doesn’t seem to matter. As President Reagan joked, “I am not worried about the deficit. It is big enough to take care of itself.”

This view is easily criticized as needlessly reckless with our country’s future. Markets are forward-looking, and most observers are pessimistic about our long-term fiscal outlook. But yields don’t reflect that. Since our current indebtedness is clearly manageable, it’s worth considering alternative outcomes.

Excessive debt was part of the reason for the 2008 crash. As the economy recovered, the U.S. pursued a stealth devaluation by maintaining negative real interest rates. It’s a well-worn path, and while Ben Bernanke didn’t articulate it as such, treasury yields were so low that buyers suffered a loss of purchasing power after taxes and inflation. Even today there’s hardly any return, although a large proportion of the holders aren’t taxable.

Populism adds an interesting dimension. Let’s suppose that U.S. bond yields rise to more fully reflect the sorry state of fiscal policy. Increased interest expense crowds out other expenditure. The Congressional Budget Office forecasts that net interest expense will double by 2024 and almost triple by 2029. They assume ten year yields rise to around 3.7%. The U.S. Debt Clock has some interesting figures.

If the buyers of our debt demand higher rates as compensation for the outlook, interest expense will rise even more. This will crowd out other priorities and add further to the deficit. Stocks would weaken; growth would slow. We can all imagine how a populist-leaning president, like Trump, would respond. Rather than focus on cutting domestic spending, foreign buyers would be warned to keep investing. The U.S. might threaten a withholding tax on foreign holdings of our debt, effectively lowering the rate. It would constitute a default. Who seriously thinks Trump would blink at the prospect?

It needn’t be a Republican. Early Democrat presidential contenders are similarly populist. How would a president in the mold of AOC (gulp) react to foreign creditors slowing the Green New Deal’s hugely expensive re-engineering of America’s economy?

The moral requirement to repay debt has been steadily weakening for years. Federal debt represents an obligation passed down from one generation to the next. It’s easy to see the political appeal in questioning why the country should repay money that was spent on entitlements by a cohort long gone. The bond buyers should have known better. In 2013, in Bonds Are Not Forever; The Crisis Facing Fixed Income Investors, I expanded on this line of thinking. It’s no less relevant today.

Such problems are in the future, but should be well within the time frame of a thirty year bond investor. Today’s yield curve suggests they’re not worried at the prospect. They should be. Publicly held U.S. Federal debt is $16TN. Another $6TN is owed to other agencies, half of which is Social Security. When you owe $16TN it’s their problem too.

Join us on Friday, February 22nd at 2pm EST for a webinar. We’ll be discussing the outlook for U.S. energy infrastructure. The sector has frustrated investors for the past two years, but there are reasons to believe improved returns are ahead. We’ll explain why. To register please click here.

SL Advisors is the sub-advisor to the Catalyst MLP & Infrastructure Fund.  To learn more about the Fund, please click here.

SL Advisors is also the advisor to an ETF (USAIETF.com)


Bond Market Looks Past Fed

Last week Fed chairman Jay Powell walked back his earlier, clumsy comments which had implied several additional rate hikes in 2019. His words at the press conference following their December 19 meeting were poorly considered, “Maybe we’ll be raising our estimate of the neutral rate and we’ll just go to that, or maybe we’ll keep our neutral rate here and then go one or two rate increases beyond it.” That sounded as if rates could move 1% higher.

Many analysts focus on the “blue dots”, a graphical representation of individual FOMC members’ rate forecasts. The Fed’s been publishing these for seven years now, and the increased transparency of which they are part is most welcome. But it’s important not to confuse what the FOMC says they’ll do with what actually happens. The bond market is far more accurate at forecasting Fed policy than the Fed itself.

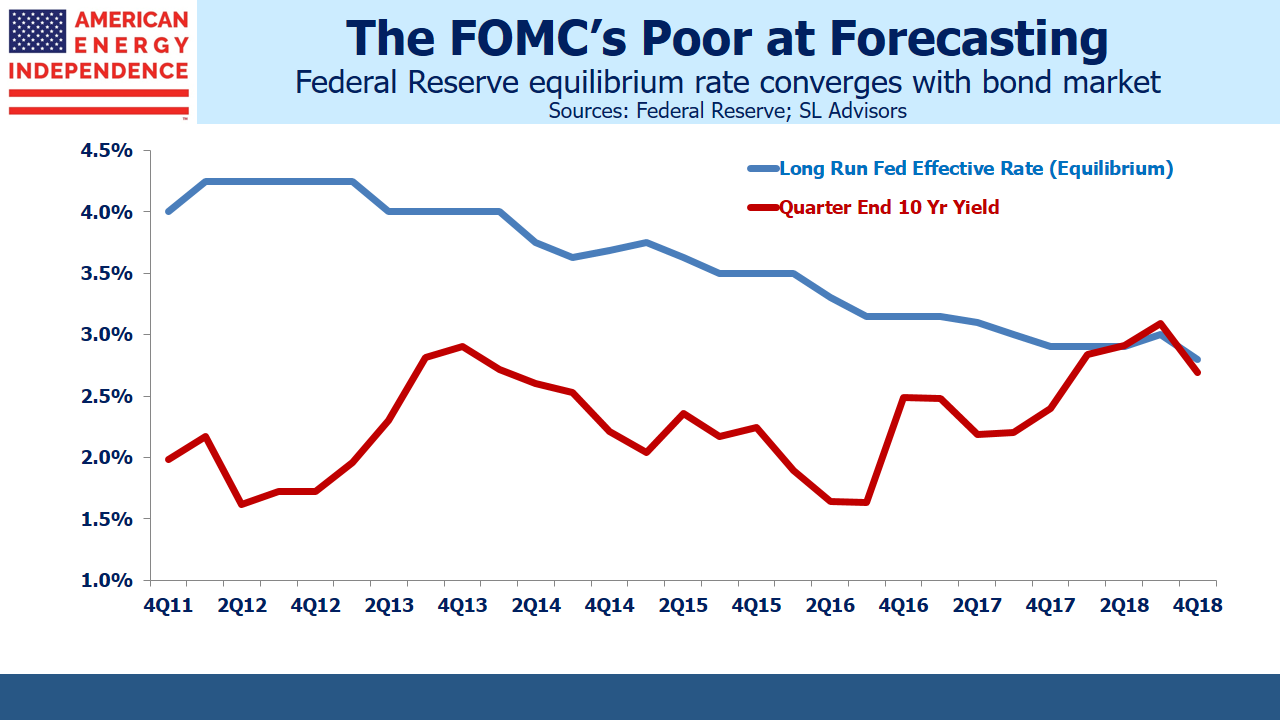
The long-run equilibrium rate, or neutral Fed funds rate, has been sliding lower for years. Bond investors never believed that the Fed would eventually increase short term rates to 4.25% back in 2012 when the first blue dots appeared. The yield on ten year treasury notes represents the average short term rate likely to prevail over the next decade, and it hasn’t been above 4% since the 2008 financial crisis. The market has maintained its disbelief, and FOMC rate forecasts have been steadily revised down to converge.

.avia-image-container.av-17omlyt-2a599c53c5d7d39ed9878d262803a266 img.avia_image{ box-shadow:none; } .avia-image-container.av-17omlyt-2a599c53c5d7d39ed9878d262803a266 .av-image-caption-overlay-center{ color:#ffffff; }

FOMC Evolving Rate Forecasts

December was a particularly bad month for equity investors everywhere, and Powell’s comments provided another reason for sellers to act. Press reports suggested that the softening global growth and market turmoil weren’t factors in their deliberations.

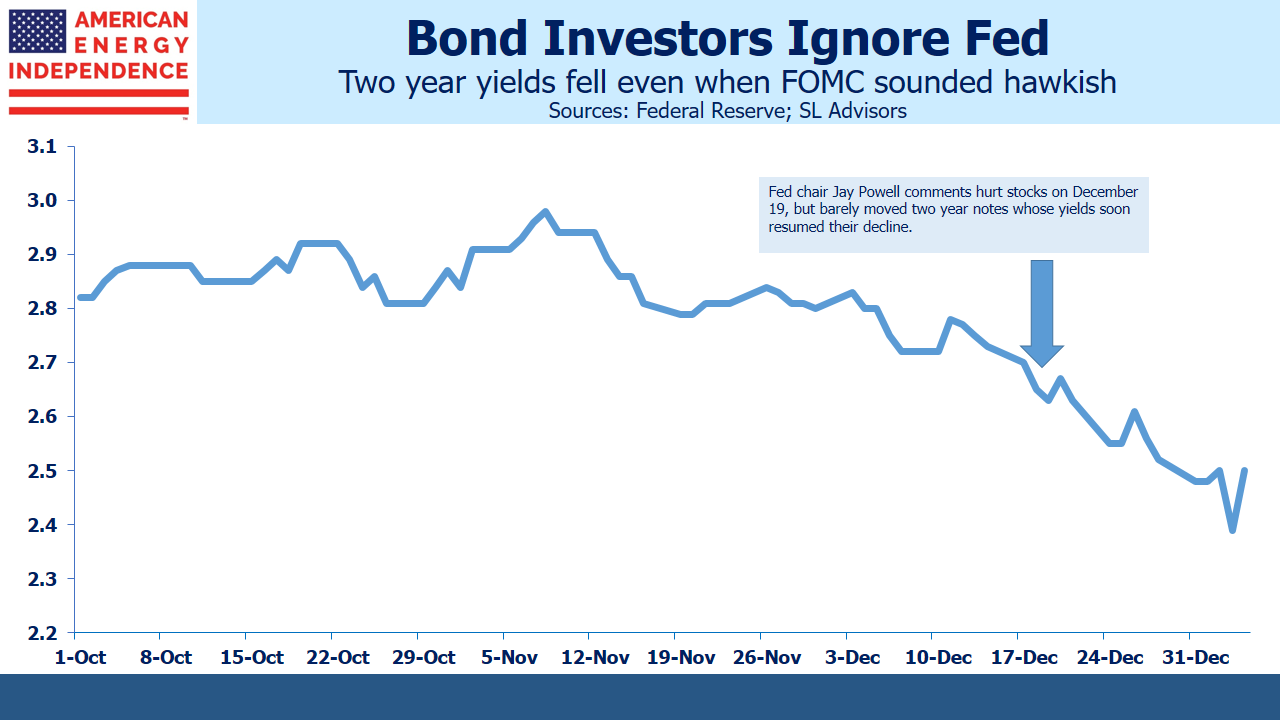
However, two year treasury yields, a good indicator of market expectations for near term Fed policy, barely rose on the day of the press conference before resuming their downward trend. So the Fed chair bowed to the inevitable, and moderated his public position to reflect what the bond market already knew, “We’re listening carefully with – sensitivity to the message that the markets are sending and we’ll be taking those downside risks into account as we make policy going forward,”

.avia-image-container.av-q7bfjp-9cd989039dfaae3f17632ba6763efac7 img.avia_image{ box-shadow:none; } .avia-image-container.av-q7bfjp-9cd989039dfaae3f17632ba6763efac7 .av-image-caption-overlay-center{ color:#ffffff; }

2 Yr Treasury Yields Fall Despite Hawkish Fed

The point here is that equity investors seem to be more scared of the Fed than bond investors. Fixed income markets never priced in Powell’s clumsy comments, even while stocks dropped at the time. The growing history of the blue dots reveal a welcome insight into FOMC member thinking.

Years ago, when Alan Greenspan personified the mysterious Fed chairman as oracle, speaking but rarely providing much information, markets believed the Fed knew more than anyone. Their superior access to data on current economic performance meant that Fed comments on growth were likely informed by data unavailable to others. The truth is that JPMorgan Chase and Amazon probably have better real-time data on the U.S. consumer than the Fed.

It’s helpful to know what policymakers expect to do, which is why the blue dots, or “dot plot” are interesting. Although Jay Powell has argued that they’re individual forecasts and not meant to represent a consensus, it’s hard to interpret them any other way. The median of fourteen individual estimates clearly reflects group consensus, no matter how much he may try to downplay it.

What we’ve learned over the seven years of blue dots is that the Fed’s consensus is terrible as a forecast. The bond market is better at predicting Fed policy than the Fed. With the two year treasury yield at 2.5%, the market is expecting little change in Fed policy this year. And with ten year yields at 2.7%, below the FOMC’s equilibrium rate, the peak in the rate cycle isn’t far away.

With the Fed likely on hold for a while, the Equity Risk Premium continues to show stocks are cheap (see Stocks Are the Cheapest Since 2012). Energy Infrastructure, in spite of its strong start to the year, is still lower than where it was a year ago even while every financial metric (EBITDA, leverage, volumes) is improving.

Comments from Fed officials shouldn’t be confused with policy actions. Equities remain very attractive.

SL Advisors is the sub-advisor to the Catalyst MLP & Infrastructure Fund.  To learn more about the Fund,  please click here.

SL Advisors is also the advisor to an ETF (USAIETF.com).


Stocks Are the Cheapest Since 2012

Christmas couldn’t come soon enough for investors – at least the market can’t fall when it’s closed. Record outflows from equity funds accompanied one of the worst Decembers on record (so far). So sharing traditional fare on Christmas Eve (fish) and Christmas Day (turkey) with family and close friends was especially enjoyable. We have much to be thankful for. Insignificantly low on that list but gratifying nonetheless is my children’s disdain for Christmas pudding (also known as plum pudding). Years ago I tried to impart to them my love for this very English Christmas dessert of dark, rich fruit cake with heavy cream – but since portions are finite, I didn’t press the issue. I now face little competition for a second slice. Appetite well sated, the convivial holiday period reminds that, in spite of falling stocks, long term optimism about America and our economic outlook remains overwhelmingly the only sensible posture.

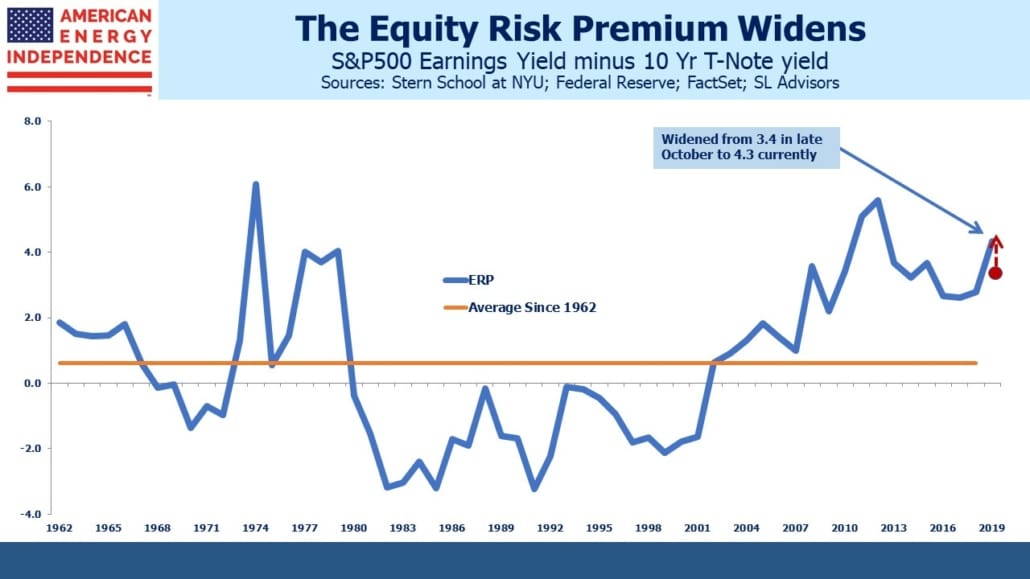
In October we noted that the Equity Risk Premium (ERP) was still historically wide, meaning that the earnings yield on stocks is sufficiently high relative to bond yields that investors should favor equities (see Bonds Still Can’t Compete with Stocks). Since then, stock prices and bond yields have both fallen. 2019 consensus earnings forecasts for the S&P500 have moderated somewhat, with growth of 8.8% versus 10.1% in October. As a result, the ERP has jumped, from 3.4 to 4.3. Stocks are now the cheapest they’ve been in six years, compared with bonds. In 2012 the ERP was 5.6, and the following year stocks rose +30%.

.avia-image-container.av-116peal-5666f6830020ce152ba45b7a442e318e img.avia_image{ box-shadow:none; } .avia-image-container.av-116peal-5666f6830020ce152ba45b7a442e318e .av-image-caption-overlay-center{ color:#ffffff; }

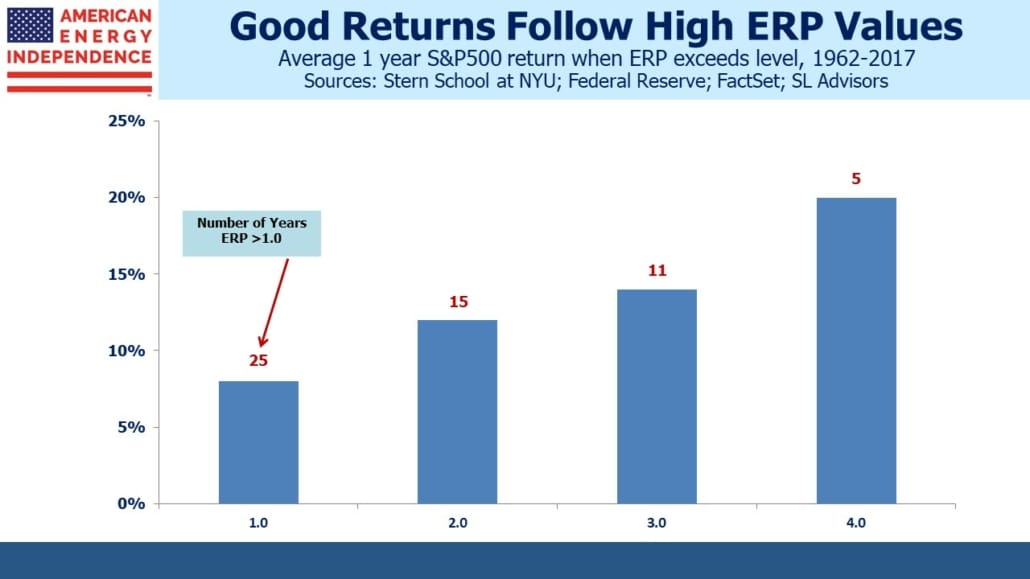
History shows that a relatively wide ERP is associated with above average subsequent equity returns, and the more extreme the ERP the better stocks do. Today, bonds offer little value compared with stocks.

.avia-image-container.av-kky6xp-87a02447fde4515ede279cd3d6a8d74f img.avia_image{ box-shadow:none; } .avia-image-container.av-kky6xp-87a02447fde4515ede279cd3d6a8d74f .av-image-caption-overlay-center{ color:#ffffff; }

The inputs are bond yields, along with the level and future earnings of the S&P500. Shifts in any of these will alter the ERP. 2019 S&P earnings are currently forecast at $176 by Factset, down from $178 in October. The decline in earnings growth (from 10.1% to 8.8%) reflects developing concerns around global growth, and it’s quite possible that downward revisions lag, meaning there’s farther to fall. Treasury Secretary Steve Mnuchin interrupting his golf vacation to assure us that he’d made a few calls and can confirm banks are liquid didn’t help either. However, stocks have fallen so far so fast that earnings forecasts would have to swing to negative to bring the ERP back to where it was in October.

Fed chairman Jay Powell’s press conference added to investor angst. Even though the FOMC’s central forecast of two further tightenings of policy in 2019 was down from three previously, his comments gave the impression that rates could go still higher: “Maybe we’ll be raising our estimate of the neutral rate and we’ll just go to that, or maybe we’ll keep our neutral rate here and then go one or two rate increases beyond it.” It was a clumsy communication to a market already worried about growth. The Fed has a dreadful record at forecasting the path of short term rates even though they set the Fed Funds rate (see Bond Investors Agree With the Fed…For Now). They’ve consistently overestimated the long run equilibrium rate, gradually lowering their forecast to meet that of bond investors (as reflected in ten year treasury yields). In spite of Powell’s comments suggesting several more steps higher in rates, current bond yields suggest the market doesn’t believe it’s likely.

The Economist recently published The perils of  trying to time the market. They noted shortcomings in relying on Cyclically-Adjusted Price-Earnings ratio (CAPE), which has wrongly been warning investors to sell stocks ever since it was first published. CAPE simply takes the average P/E over many years, to smooth out economic cycles. As my partner Henry Hoffman notes, because it doesn’t adjust for interest rates it’s of little use. CAPE says stocks are historically expensive, but overlooks that bonds are even more so. That’s what the ERP picks up, that CAPE doesn’t.

.avia-image-container.av-119mf5p-a6d75fb7d447f427a1e69db84f6651df img.avia_image{ box-shadow:none; } .avia-image-container.av-119mf5p-a6d75fb7d447f427a1e69db84f6651df .av-image-caption-overlay-center{ color:#ffffff; }

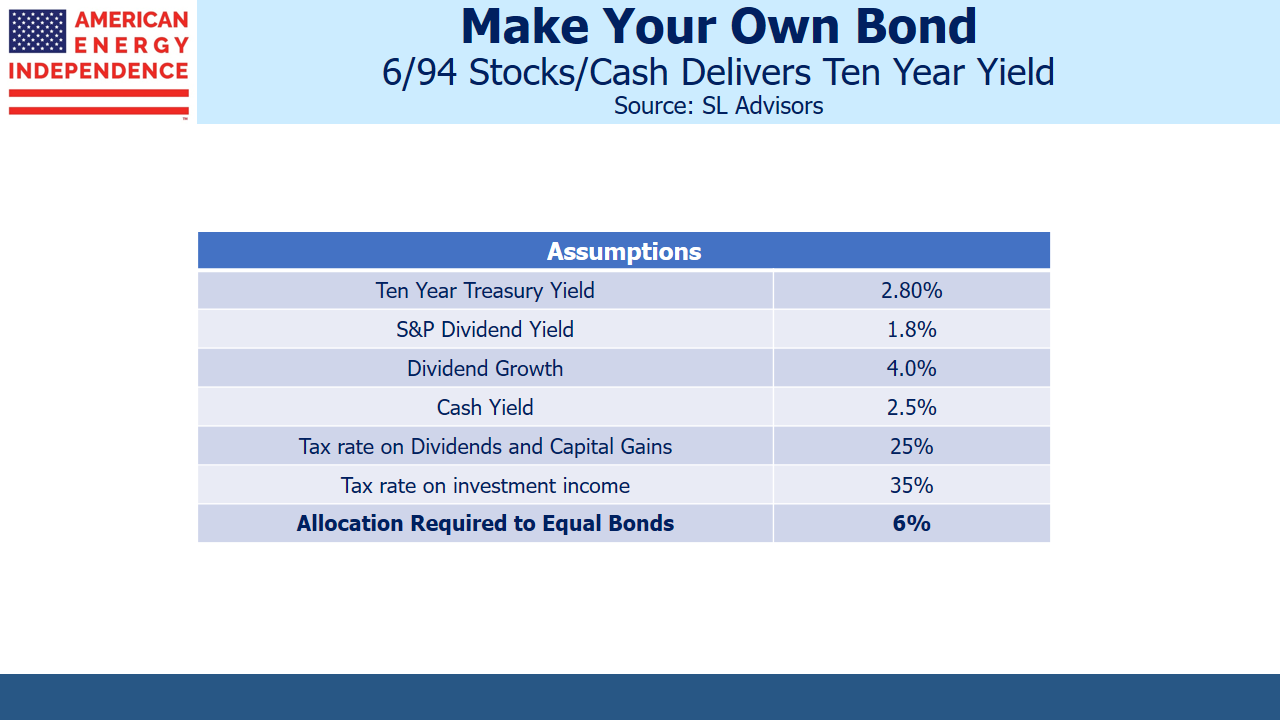
Make Your Own Bond 6_94

The attractiveness of stocks versus bonds can be illustrated by calculating what percentage of stocks in a simple stocks/cash barbell portfolio would deliver the same ten year return as bonds. It relies on some key assumptions: that the 1.8% dividend yield on the S&P500 prevails in ten years; that we know the growth rate of dividends, the return on cash, and that tax rates don’t change. Holding all these variables constant, it shows that a very small stock investment beats ten year treasuries. That’s because the yield curve is now so flat that there’s very little benefit to extending maturities. Even the most risk averse fixed income investor can surely tolerate switching out of bonds and putting 6% of the proceeds in stocks. Cash returns of around 2.5% are looking quite reasonable, so why risk longer maturities? That only makes sense if you think the Fed’s next move will be to lower rates.

.avia-image-container.av-s59v19-5e841503afd5f8080ca971cb4cfbde7c img.avia_image{ box-shadow:none; } .avia-image-container.av-s59v19-5e841503afd5f8080ca971cb4cfbde7c .av-image-caption-overlay-center{ color:#ffffff; }

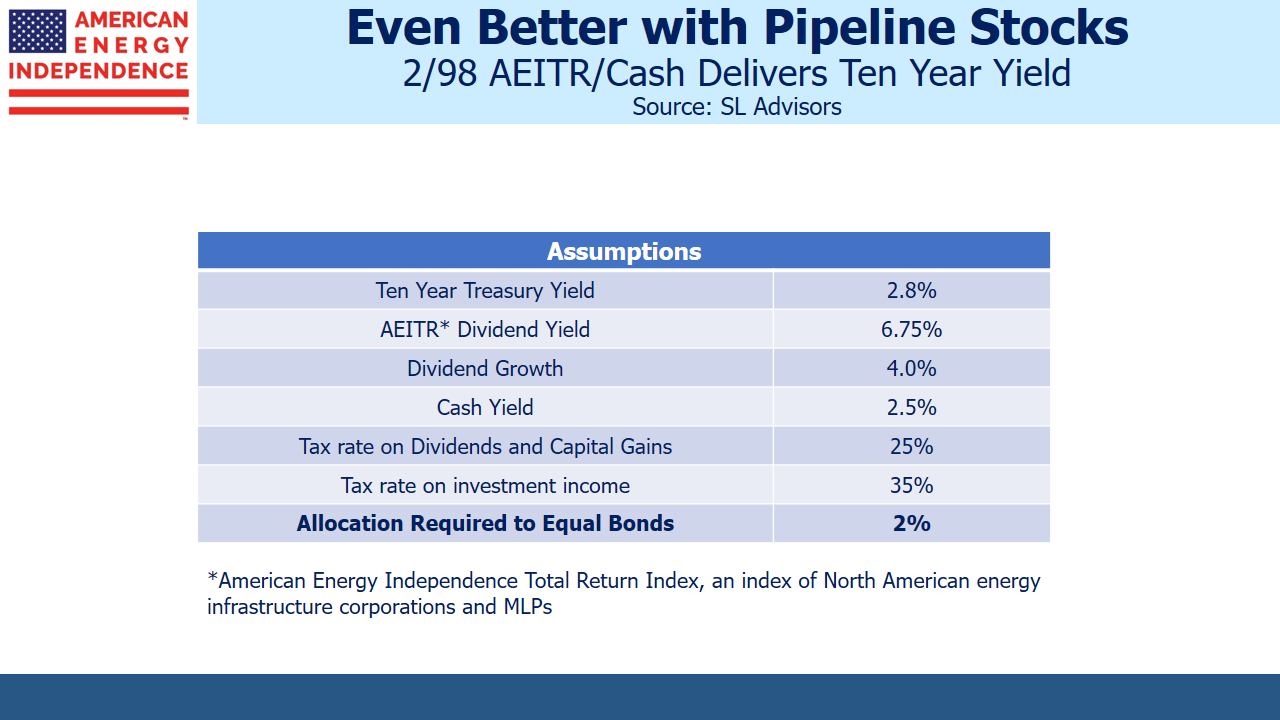
We’ve also illustrated the same portfolio but using the American Energy Independence Index (AEITR), which holds North America’s biggest pipeline stocks. It yields 6.7% and we expect dividends to grow high single digits in 2019. A mere 2% in AEITR, with 98% in cash, will deliver the equivalent of the ten year note’s 2.8% return, pre-tax.

Stocks (especially an allocation to pipeline stocks) remain a preferable long term investment over bonds. Recent moves in both markets make the case even more compelling today.

.avia-image-container.av-lcmukd-25339be3d63235b9464676b28225d764 img.avia_image{ box-shadow:none; } .avia-image-container.av-lcmukd-25339be3d63235b9464676b28225d764 .av-image-caption-overlay-center{ color:#ffffff; }

English Christmas Pudding

SL Advisors is the sub-advisor to the Catalyst MLP & Infrastructure Fund.  To learn more about the Fund,  please click here.

SL Advisors is also the advisor to an ETF (USAIETF.com).