Gulf Tensions Back in Play

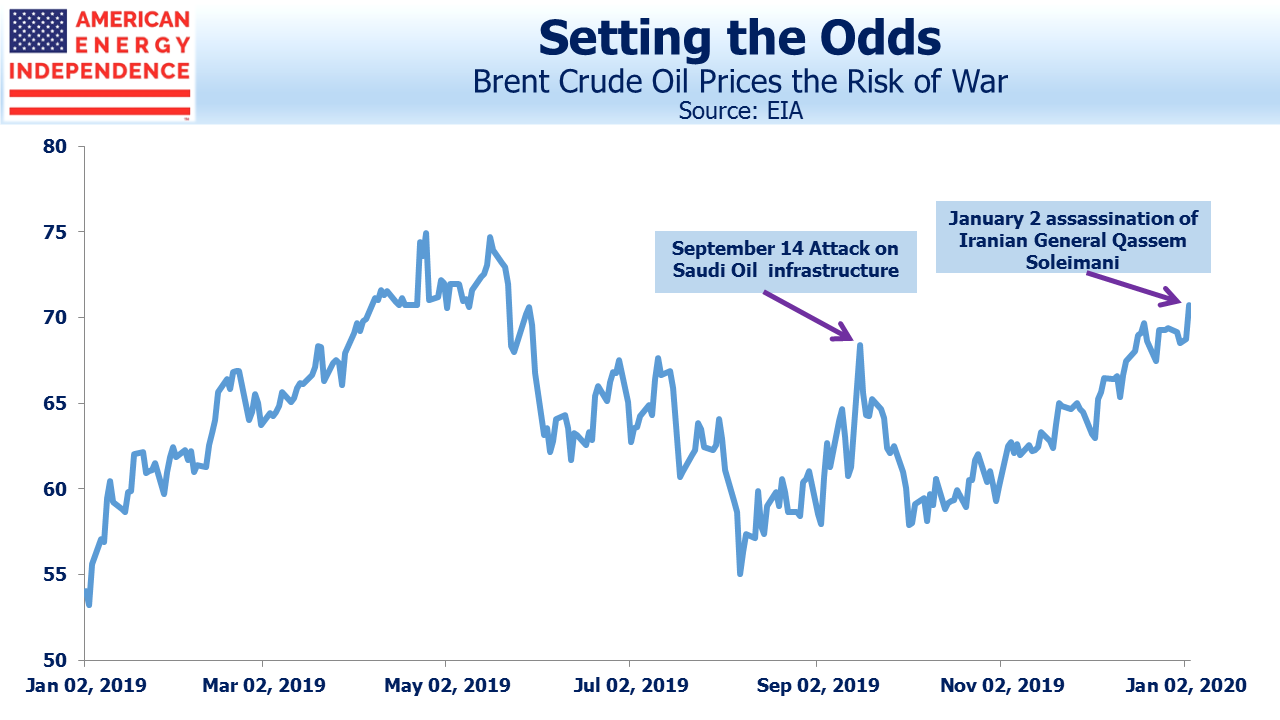
Just over three months ago, Saudi Arabian oil facilities were put out of action by a drone and missile strike. Oil prices jumped. It seemed indisputable than Iran was behind the attack – the sophistication was beyond that believed available to the Yemeni Houthi rebels who claimed responsibility. Saudi retaliation appeared inevitable, as half their oil production was taken offline.

Crude jumped, but the Saudis chose to ignore Iran’s provocation. Prices soon fell back as the market resumed its sanguine view of supply disruption.

.avia-image-container.av-29dnzca-20d3886a2e5e8e1458e9581fe227fbc0 img.avia_image{ box-shadow:none; } .avia-image-container.av-29dnzca-20d3886a2e5e8e1458e9581fe227fbc0 .av-image-caption-overlay-center{ color:#ffffff; }

So is it different this time? The assassination of Iran’s top military leader, General Qassem Soleimani, looks like a sharp escalation of tensions. Secretary of State Mike Pompeo justified it as preventing “an imminent” attack on U.S. citizens. Reportedly, both Presidents Bush Jr and Obama declined opportunities to kill Soleimani in the past, because they feared it would lead to war. Iran has so far pursued asymmetry, avoiding a hopeless direct military confrontation in favor of indirect responses under cover of plausible deniability. Will that strategy change?

.avia-image-container.av-islaru-2cb2c87fc061c38741f7f8f5757f2963 img.avia_image{ box-shadow:none; } .avia-image-container.av-islaru-2cb2c87fc061c38741f7f8f5757f2963 .av-image-caption-overlay-center{ color:#ffffff; }

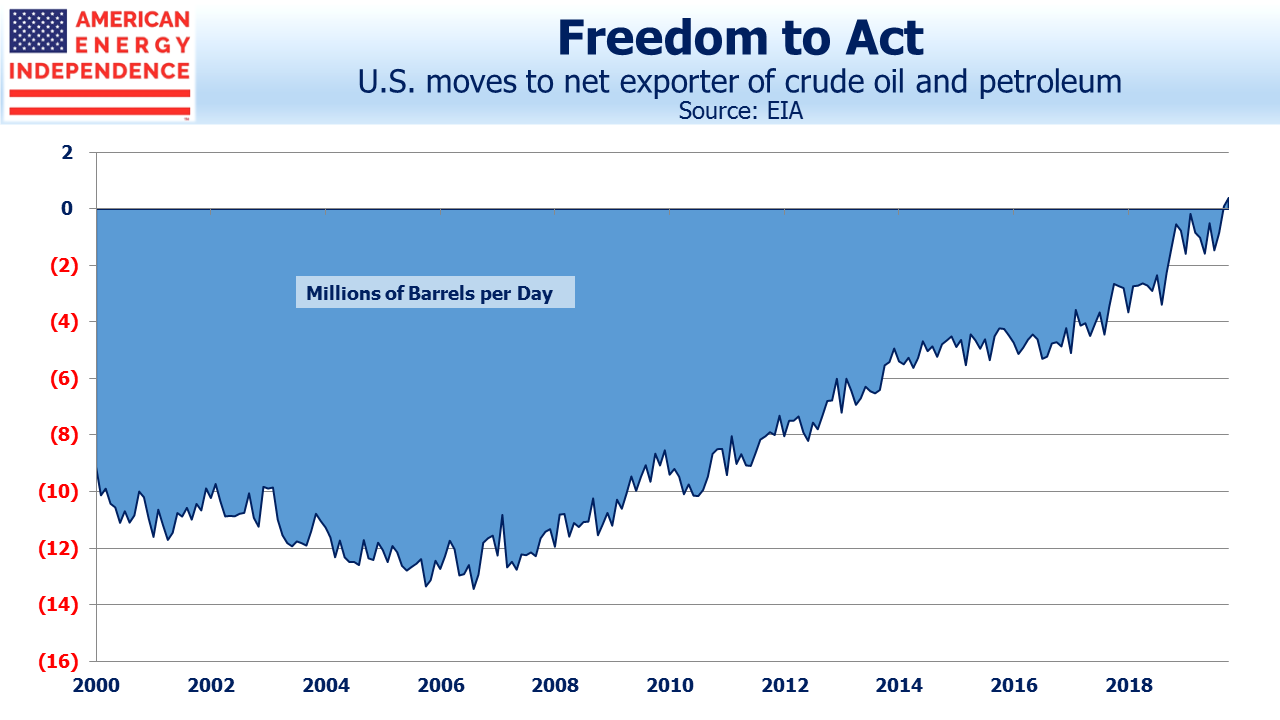
The Shale Revolution affords the U.S. far more foreign policy flexibility, now that OPEC can’t cause lines of cars at gas stations. Substantially higher domestic production of hydrocarbons made America a net exporter of crude oil and petroleum products late last year. Qassem Soleimani might be alive today if not for fracking.

Near term bets on crude oil or the energy sector will turn on how events play out, and it’s easy to have misplaced conviction with so many possible scenarios. Exxon Mobil (XOM) operates in 38 countries. Some of their infrastructure, which includes three JVs in Saudi Arabia, may be vulnerable, Geopolitical risk comes with complexity.

This is not the case for U.S. midstream energy infrastructure. For this sector, “international” is limited to Canada and in some cases Mexico. Pipelines are hard to damage because they’re underground, and while aboveground facilities are certainly more vulnerable, America is not an easy place for terrorist operations.

.avia-image-container.av-iczqq2-3c80a13b3cc21447e313926b2c6ff297 img.avia_image{ box-shadow:none; } .avia-image-container.av-iczqq2-3c80a13b3cc21447e313926b2c6ff297 .av-image-caption-overlay-center{ color:#ffffff; }

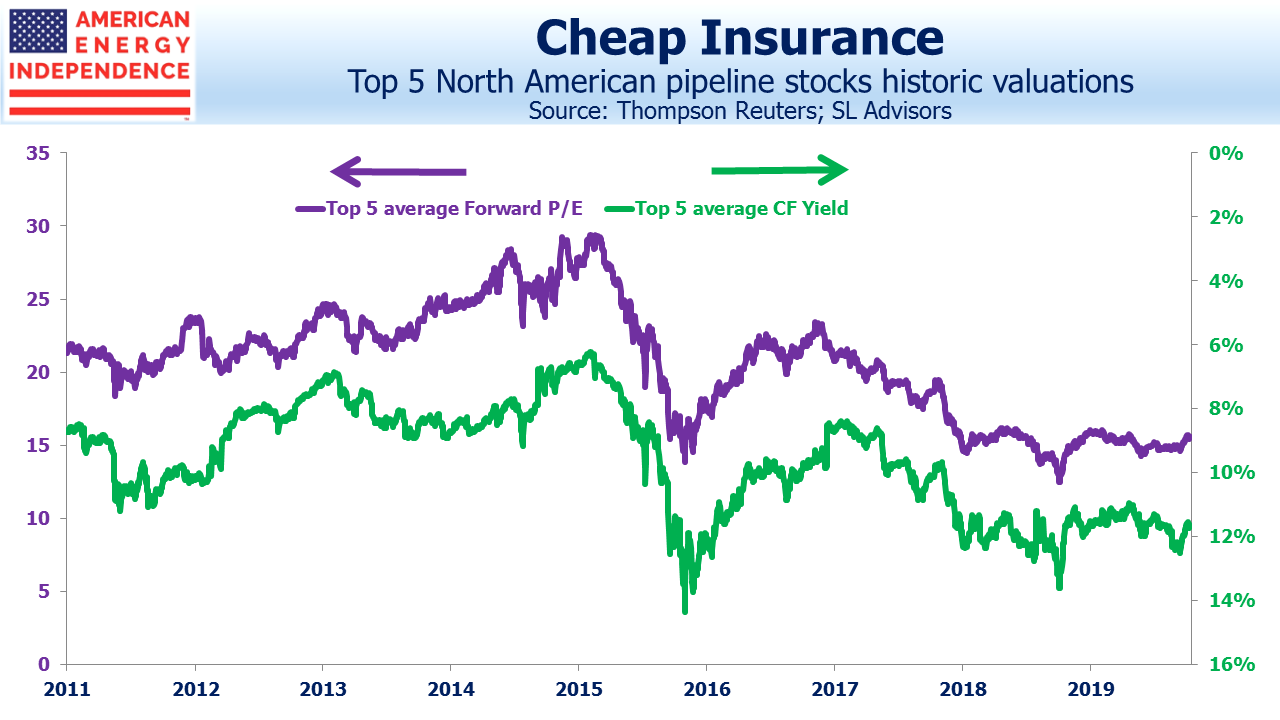
The sector is cheap enough that an investor can awaiting a re-pricing catalyst, which could be conflict in the Middle East or simply the market’s ultimate recognition of improving fundamentals.

Although S&P500 valuations are historically high, at over 18X 2020 earnings, the five biggest North American midstream infrastructure names trade at almost a 20% discount. All five of these companies are in the American Energy Independence Index.

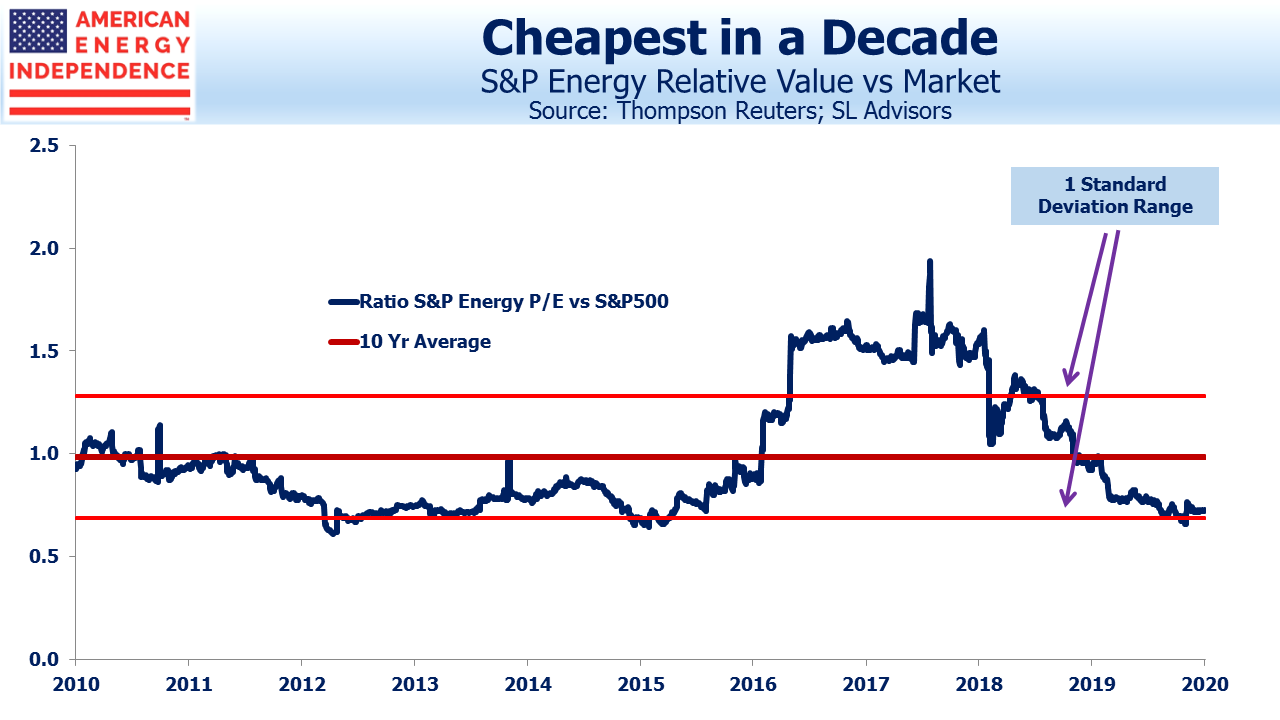
S&P Energy, having sunk to 4% of the S&P500, is at close to its cheapest relative multiple in a decade.

.avia-image-container.av-wzwd3e-bf23a671b8324306f347eee437e39eb5 img.avia_image{ box-shadow:none; } .avia-image-container.av-wzwd3e-bf23a671b8324306f347eee437e39eb5 .av-image-caption-overlay-center{ color:#ffffff; }

There’s no need to correctly forecast disruptive geopolitical events or react quickly to them. Pipeline stocks are cheap enough to provide holders with multiple potential ways to make money.

We are invested in all the names listed above.


News on our American Energy Independence ETF (USAI)

Last week shareholders of the American Energy Independence Fund (USAI) approved its reorganization into the Pacer American Energy Independence Fund. Today, Pacer took over from SL Advisors as the fund’s advisor.
We expect that this will allow Pacer Advisors to leverage its resources for and focus its marketing and distribution efforts on growing USAI’s AUM.
Please click here for more information.


Should Closed End Funds Use Leverage?

Closed end funds (CEFs) are an obscure sector of the market with a small but fiercely passionate following. Because they have a fixed share count, they can trade at a premium or discount to the value of their holdings, which are usually public equities or debt.  This creates appealing opportunities to buy at a discount to intrinsic value. Closed End Fund Advisors provides a lot of useful information on the sector.

Liquidity is always a problem, so the investors tend to be retail with a small handful of institutions. It can sometimes take several days to get into or out of positions. We occasionally run across financial advisors who invest in CEFs for their clients.

In theory, CEFs should generally trade at a discount to Net Asset Value (NAV), because of their relative illiquidity compared to the basket of underlying shares. MLP CEFS have an especially interesting history. We often note the terrible tax structure of the Alerian MLP ETF, AMLP (see MLP Funds Made for Uncle Sam). But MLP CEFS pre-date AMLP and provided some justification for its launch.

.avia-image-container.av-kiv8dr-789c6a5cd3ad85ca620d58b543858fa5 img.avia_image{ box-shadow:none; } .avia-image-container.av-kiv8dr-789c6a5cd3ad85ca620d58b543858fa5 .av-image-caption-overlay-center{ color:#ffffff; }

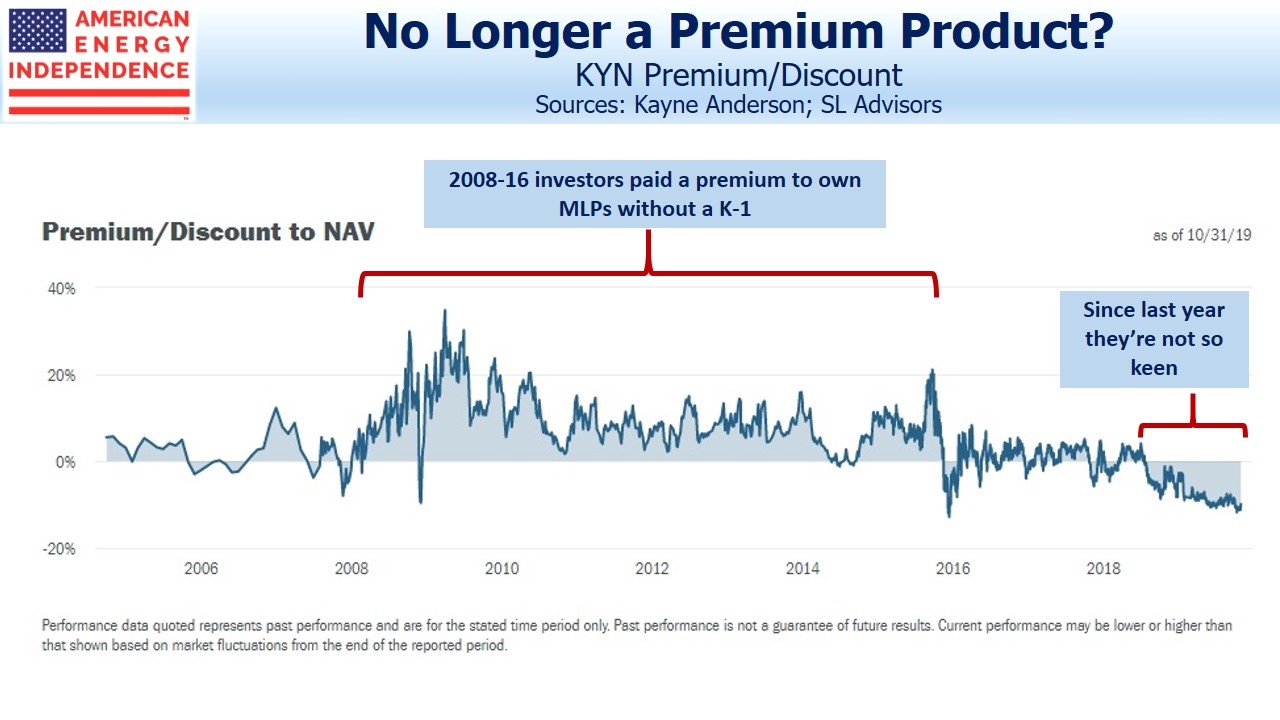
This is because for many years MLP CEFs consistently traded at a premium to NAV. The Kayne Anderson MLP/Midstream Investment Company (KYN) illustrates this point. For most of its history, KYN shares have traded at least 5% higher than NAV and at times over 30%. MLP CEFs possess the same tax inefficiencies as AMLP, in that they are liable for corporate taxes because they are more than 25% invested in MLPs.

The benefit of the tax drag is that KYN investors get exposure to MLPs without the tax hassle of K-1s for tax reporting. A decade ago, investors clearly placed a high value on this simplified tax reporting, as evidenced by the substantial premium to NAV at which KYN traded. AMLP’s 2010 launch took place against this backdrop of strong demand for the tax-burdened, 1099 structure.

Where KYN and other MLP CEFs differ from AMLP is in their use of leverage. This is common in CEFs and supports higher yields in exchange for increased NAV volatility. In addition, the interest expense lowers taxable income, which can lower the inherent inefficiency of an MLP CEF with its corporate tax obligation.

For the past year, KYN has traded at a discount to NAV averaging almost 10%. It’s another symptom of declining retail interest in the sector. The sharp 2014-16 drop with heightened volatility caused some damage.

It’s worth revisiting the use of leverage by MLP CEFs. To continue with KYN, in reviewing their past financials, they seek to stay close to “400% debt coverage”, meaning that their desired portfolio consists of $400 in investments funded with $100MM in debt and $300MM in equity. So $1 invested in KYN controls $1.33 in MLPs. The 400% debt coverage rises and falls with the market. Rebalancing back to their target requires selling after a market drop, and buying following a rally (i.e. buy high, sell low). KYN tends to move a little more than the market as a result.

The question is, whether such leverage continues to make sense. MLP balance sheets have come under a great deal of scrutiny in recent years. The industry has moved towards self-funding growth projects with less reliance on external financing; higher distribution coverage; less leverage. Investment grade companies now target around 4X Debt:EBITDA.

A portfolio of MLPs is pretty concentrated. An investor in KYN or other MLP CEF, by accepting leverage at the CEF level, is implicitly rejecting the industry’s 4X Debt:EBITDA target as needlessly conservative. Is this a smart decision? It might make sense to add leverage to a diversified portfolio, because the low correlations across pairs of individual names will keep the portfolio’s volatility below that of its average holding. But if you’re invested in a single sector, the average volatility of the holdings will come close to your portfolio’s volatility. Adding leverage to that portfolio increasingly looks like adding more debt to each individual holding. The practical result is that the investor is adding more risk than the company and credit rating agencies deem appropriate.

We don’t use leverage in our business. The sector has been volatile enough in recent years, and the periodic rebalancings that are required tend to force you to buy high/sell low.

In KYN’s most recent quarterly financials (August 31), they noted 401% debt coverage versus their target of 400%. Since August, the Alerian MLP index (AMZX) has dropped 10%, implying KYN’s coverage ratio has sunk to 360%. Restoring their 400% target coverage will have required selling over $110MM in securities, adding to the market’s recent selling pressure. Last year’s 4Q saw a 17% drop in AMZX which was almost certainly exacerbated by MLP CEFs delevering. The rebound earlier in the year would have seen MLP CEFs similarly increasing leverage back up.

MLP CEFs are constantly chasing the market to restore their desired leverage. Higher volatility increases the cost of such frequent portfolio rebalancings. We think it’s time their investors reassessed whether accessing the sector with leverage makes sense.

We have three funds that seek to profit from this environment:

Energy Mutual Fund

Energy ETF

Inflation Fund


When Will MLPs Recover?

Our blog topics are often informed by the subjects that come up in conversations with clients. October was a wrenching month, with the Alerian MLP index slumping to -6% versus +2% for the S&P500. MLPs have lagged equities by an astonishing 22% YTD. Over the last couple of weeks we have been busier than usual fielding calls from investors. By far the most common question in various forms is, when will MLPs recover?

So, for the benefit of those with whom we haven’t recently chatted but are wondering the same thing, below we summarize our thoughts:

  • Energy sector sentiment. This remains terrible. Investors would still prefer more disciplined capital allocation. Management teams too often seek dilutive growth, often because their compensation isn’t aligned with per-share metrics. .avia-image-container.av-mtzcdl-3aae4a3889715264767f4ea672ed74a6 img.avia_image{ box-shadow:none; } .avia-image-container.av-mtzcdl-3aae4a3889715264767f4ea672ed74a6 .av-image-caption-overlay-center{ color:#ffffff; }
    Midstream energy infrastructure has handily outperformed the E&P sector this year, and capital discipline is improving. But many of the people we talk to are weary, looking for reasons to remain invested and searching for confirmation in their original investment thesis that increasing production should benefit pipelines with their toll-like model. However, there are positive signs here, in that Free Cash Flow for midstream energy infrastructure is set to soar over the next couple of years (see The Coming Pipeline Cash Gusher). Growth capex peaked last year, and existing assets are generating more cash. These are both driving FCF to almost $10BN this year, $27BN next year and $43BN or so in 2021. Recent quarterly earnings generally provided confirmation of this positive trend. For example, Targa Resources (TRGP), one of the worst offenders, has 2020 investment spending plans of $1.2BN, half of this year’s. Former CEO Joe Bob Perkins flippantly talked about new projects as “capital blessings”. Investors won’t miss his self-serving arrogance.
  • Retail investors are selling. Approximately $3.6BN, roughly 7% of the total, has left MLP mutual funds, ETFs and related products in the past twelve months, which creates constant downward pressure on prices. Although our own products have seen net inflows this year, this is not the norm.
  • The MLP business model is probably dead. Pre-2012, pipeline companies organized as MLPs and paid out 90% or more of their cashflow. Back then, America obtained its oil and gas from roughly the same places in the same amounts year after year. Few new pipeline projects were needed, so with little need to retain cash MLPs offered high yields. These attracted income-seeking investors who, because of the K-1s that MLPs issue, tended to be wealthy. In other words, old, rich Americans. The Shale Revolution offered up oil and gas in places not traditionally served by infrastructure – for example, the Bakken in North Dakota and the Marcellus in Pennsylvania. The Permian in west Texas, although long a producing region, saw significant increases in volume. MLPs decided to invest in new pipelines, pressuring balance sheets and ultimately sacrificing distributions. Kinder Morgan was the first to slash its payout, before ultimately simplifying its structure as Kinder Morgan Inc (KMI) absorbed the assets of its MLP, Kinder Morgan Partners (KMP). The rationale for becoming a corporation was to access capital from the world’s institutional equity investors rather than just the old, rich Americans who buy MLPs (see Kinder Morgan: Still Paying for Broken Promises). Most institutions avoid publicly traded partnerships because of complex tax considerations. In the process, original KMP investors, who had invested for stable tax-deferred income, suffered two distribution cuts and a taxable transaction when their units were swapped for shares in KMI. Many thousands remain bitter to this day.  Rich Kinder’s promise of ever rising distributions fueled higher payouts back to his general partner via Incentive Distribution Rights (IDRs).
  • Prior to 2014, many investors viewed the distribution as sacred and assumed that Rich would honor his promise to continue paying them.  After realizing they’d been duped into essentially transferring their money to Rich Kinder through this IDR mechanism based on broken promises, they’ve understandably become disillusioned.  If you run into a former KMP investor, ask about their betrayal by Rich Kinder. It’ll be a colorful story.  Other MLPs followed KMI’s lead. MLPs shed their income seeking investor base in their desire to fund growth projects. More distribution cuts and unwelcome tax bills followed. This transition to institutional, total return investors has been far harder than they assumed. The legacy of betrayal continues to hang over the sector. KMI had a slide titled “Promises Made, Promises Kept”, boasting about their 13 years of distribution growth. .avia-image-container.av-vndiyx-dbdd505165c8dbee016b589c9b032359 img.avia_image{ box-shadow:none; } .avia-image-container.av-vndiyx-dbdd505165c8dbee016b589c9b032359 .av-image-caption-overlay-center{ color:#ffffff; }
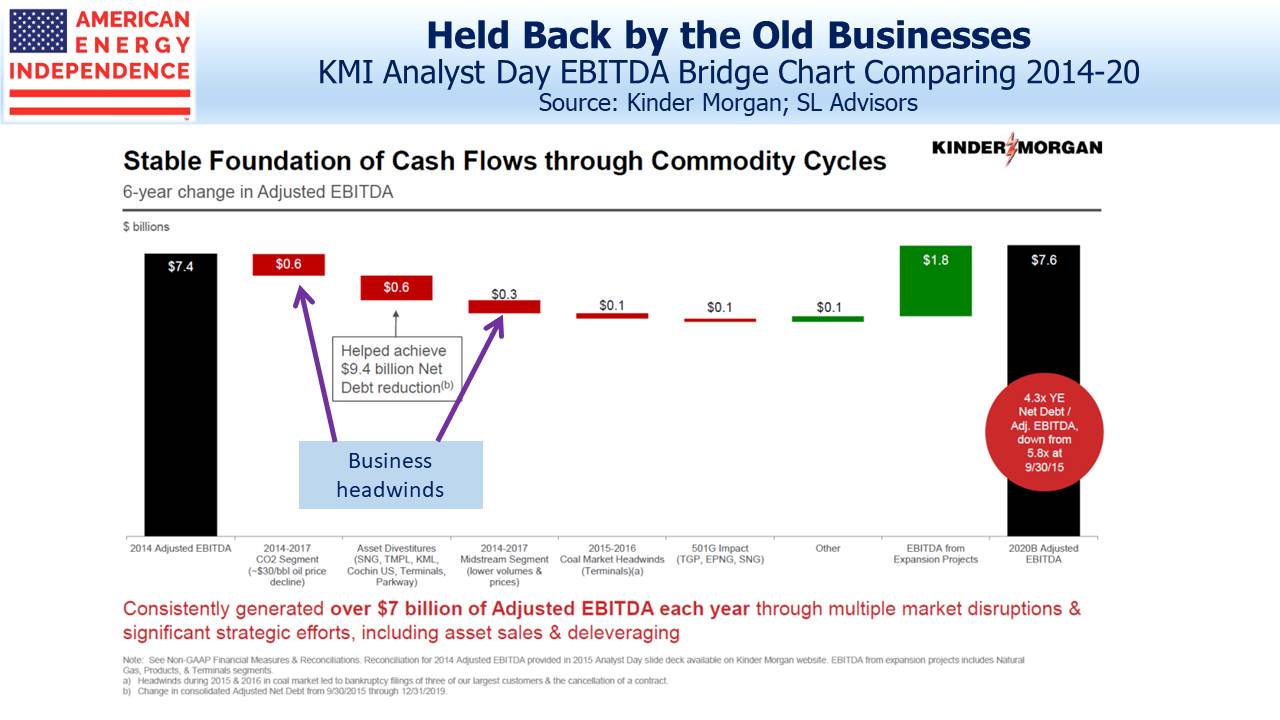
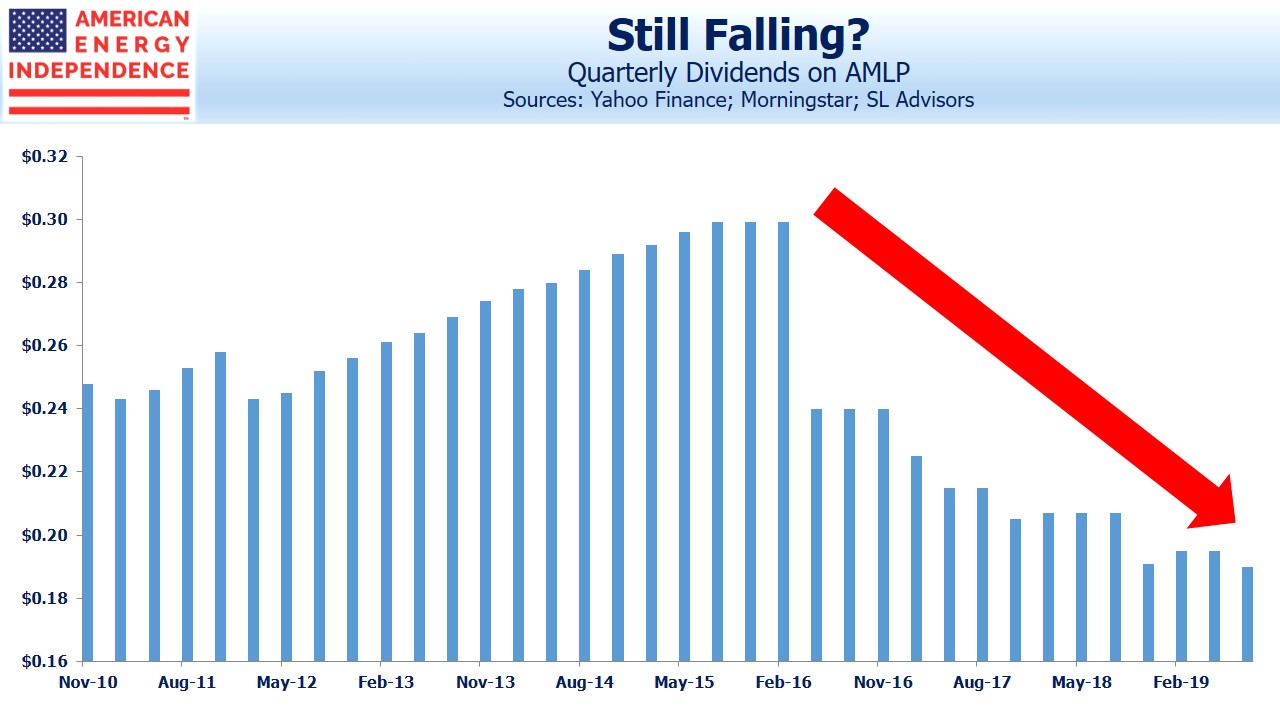
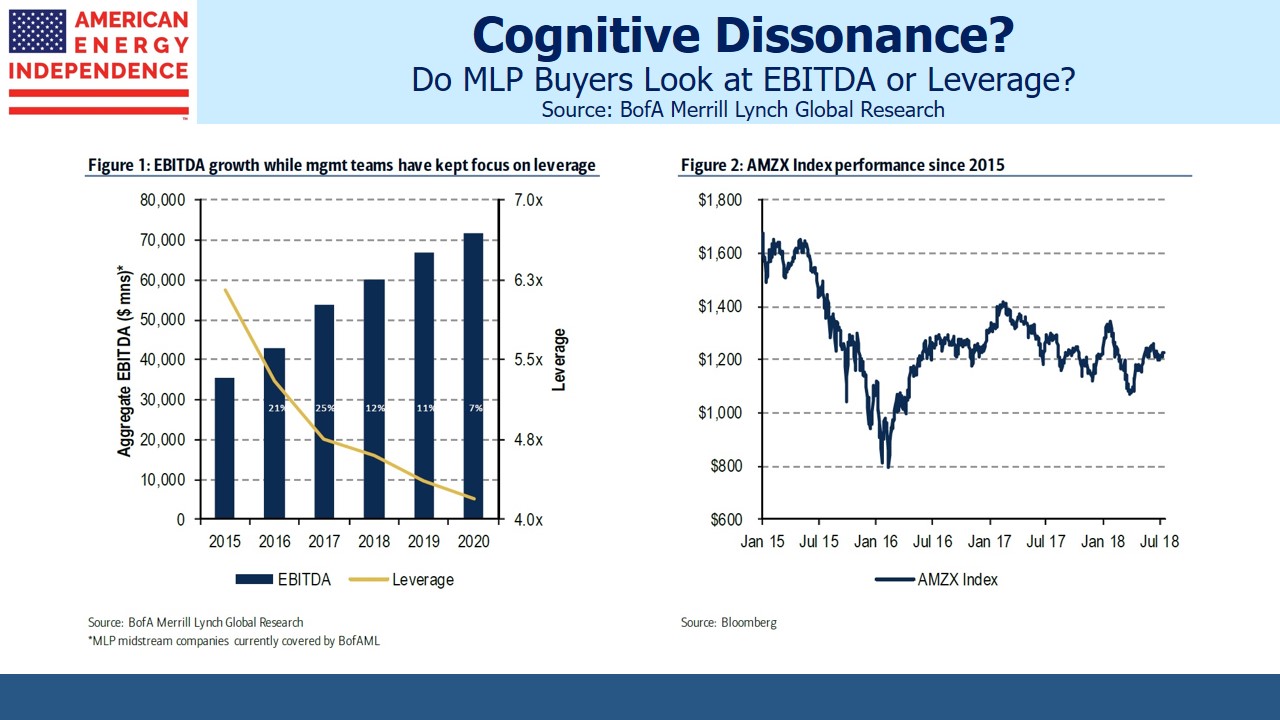
    The Alerian MLP ETF has cut its distributions by a third, reflecting similar cuts by its underlying components. This is the only time we’re aware of in which companies slashed distributions even while operating performance was fine, as shown by the growing EBITDA on the slide below. .avia-image-container.av-u096ll-9a9441580c35e1fb276b2961f175edf7 img.avia_image{ box-shadow:none; } .avia-image-container.av-u096ll-9a9441580c35e1fb276b2961f175edf7 .av-image-caption-overlay-center{ color:#ffffff; }
    EBITDA vs Leverage
    But if you’ve invested for the income and it’s cut, you’re let down and no mitigating circumstances will compensate. It’s why MLPs have shrunk to well under half the midstream energy infrastructure sector, with conventional corporations (“c-corps”) now dominant. .avia-image-container.av-10ksp8p-06b0e8b82337747bbd140b5320b32f0b img.avia_image{ box-shadow:none; } .avia-image-container.av-10ksp8p-06b0e8b82337747bbd140b5320b32f0b .av-image-caption-overlay-center{ color:#ffffff; }
    Investors in MLP funds or MLP-only portfolios can select from a couple of big MLPs and many very small ones while overlooking six of the ten biggest pipeline companies, since they’re corporations. AMLP, with its 100% MLP construction and disastrous tax structure, would never be created in today’s form. It is a slowly shrinking legacy to the past (see MLP Funds Made for Uncle Sam).
  • Election year concerns. A Warren victory is perceived as the most negative, due to her proposed ban on fracking. If applied to federal lands this would have some very modest impact on production. Most drilling takes place on private lands and is regulated by the states. An outright ban on fracking would require an act of Congress which, barring a complete Democrat sweep to include control of the senate, we believe is highly unlikely.
  • Tax loss selling. This seems to happen every year, but energy’s chronic underperformance has created opportunities for investors to pair gains elsewhere with losses in this sector.
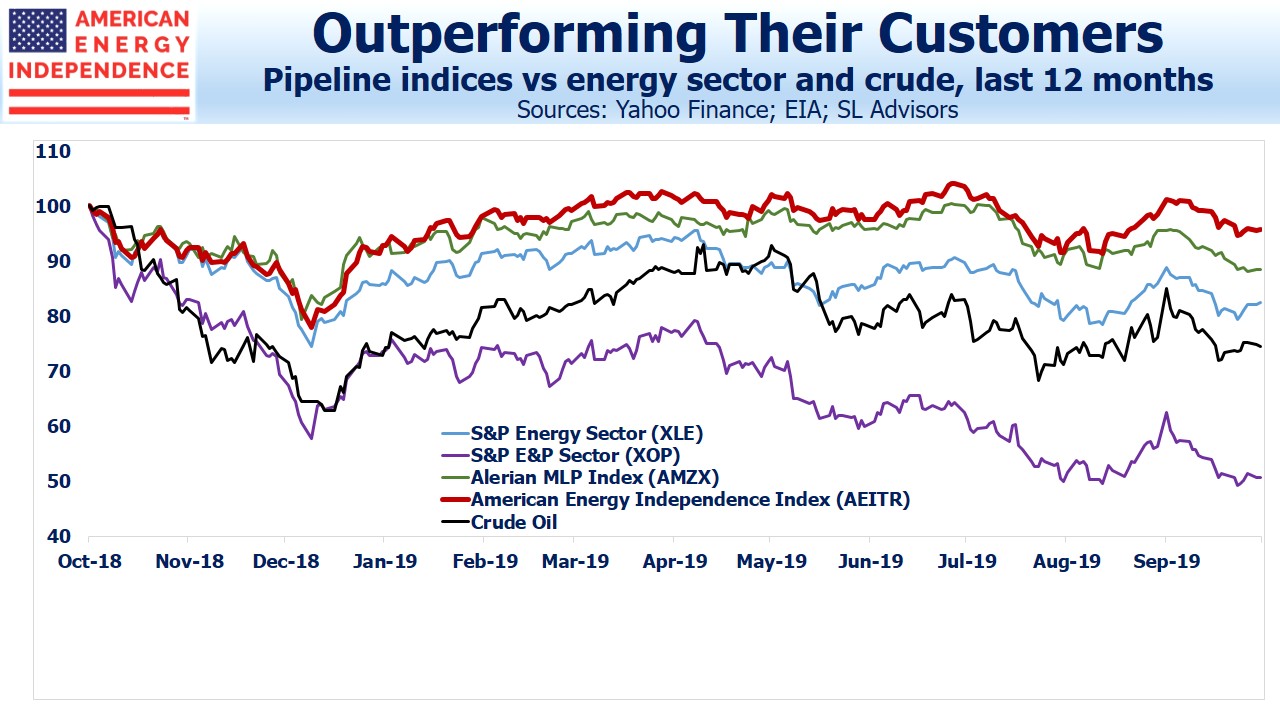
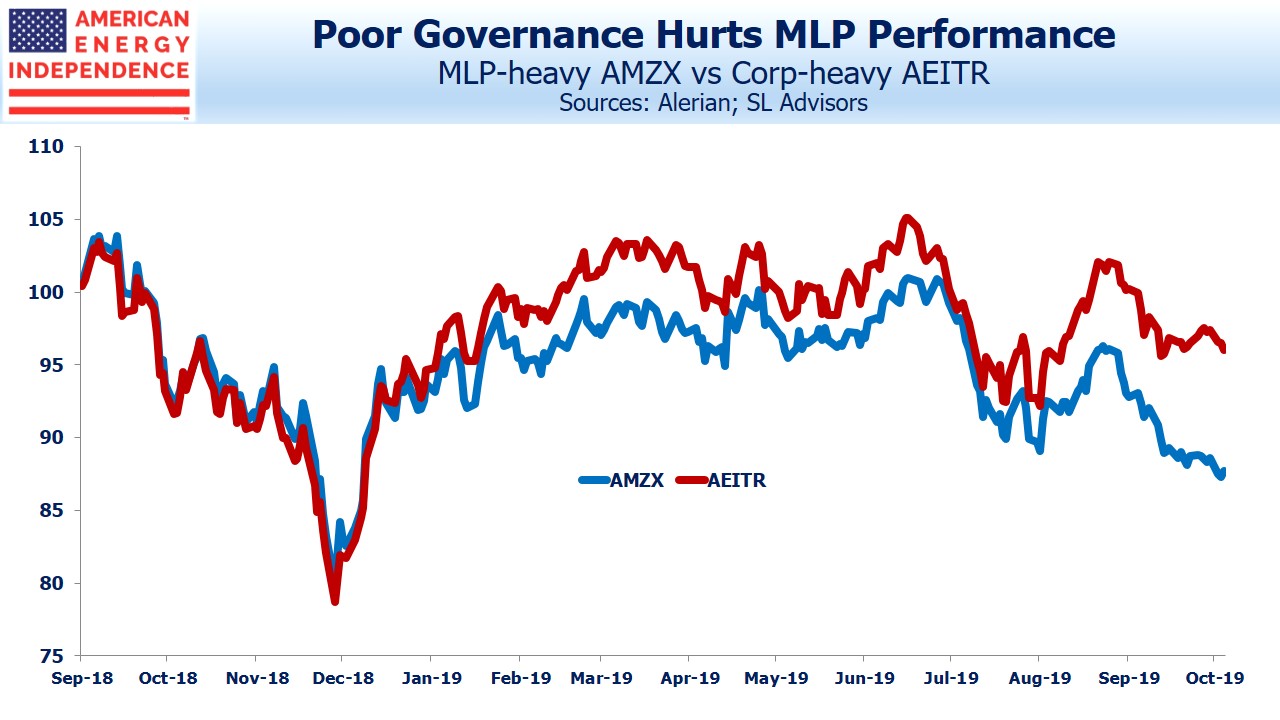
  • Climate Change. It’s hard to assess the impact of investors who might otherwise invest in energy declining to do so, either for ESG reasons or because they fear public policy will impose harsh limits on use of fossil fuels. ESG funds are notable investors in some of the biggest pipeline corporations but not in MLPs because governance (the “G” in ESG) provides weaker investor protections. Tallgrass recently demonstrated this (see Blackstone and Tallgrass Further Discredit the MLP Model). The result has been that the MLP-dominated Alerian MLP index has increasingly lagged our own American Energy Independence Index, which is 80% corporations. .avia-image-container.av-kqhkvd-78a38b90feaddf1f065c513f8571ced4 img.avia_image{ box-shadow:none; } .avia-image-container.av-kqhkvd-78a38b90feaddf1f065c513f8571ced4 .av-image-caption-overlay-center{ color:#ffffff; }

Our best bet is that tax loss selling will soon abate, and continuing evidence of capital discipline will draw generalist investors to invest. There’s certainly plenty of interest from other buyers (see Private Equity Sees Value in Unloved Pipelines). But the history of distribution cuts, some poor capital allocation decisions and episodes of investor abuse because of weak MLP governance have depressed sentiment for some time.

For many years November was the best time to buy, with the predominantly retail investor base making the January effect more pronounced than in the broader equity market. The effect has become more muted as companies have switched from MLP to corporation, but still remains a factor (see Give Your Loved One an MLP This Holiday Season) 

We are invested in KMI and TGE


Energy Transfer’s Weak Governance Costs Them

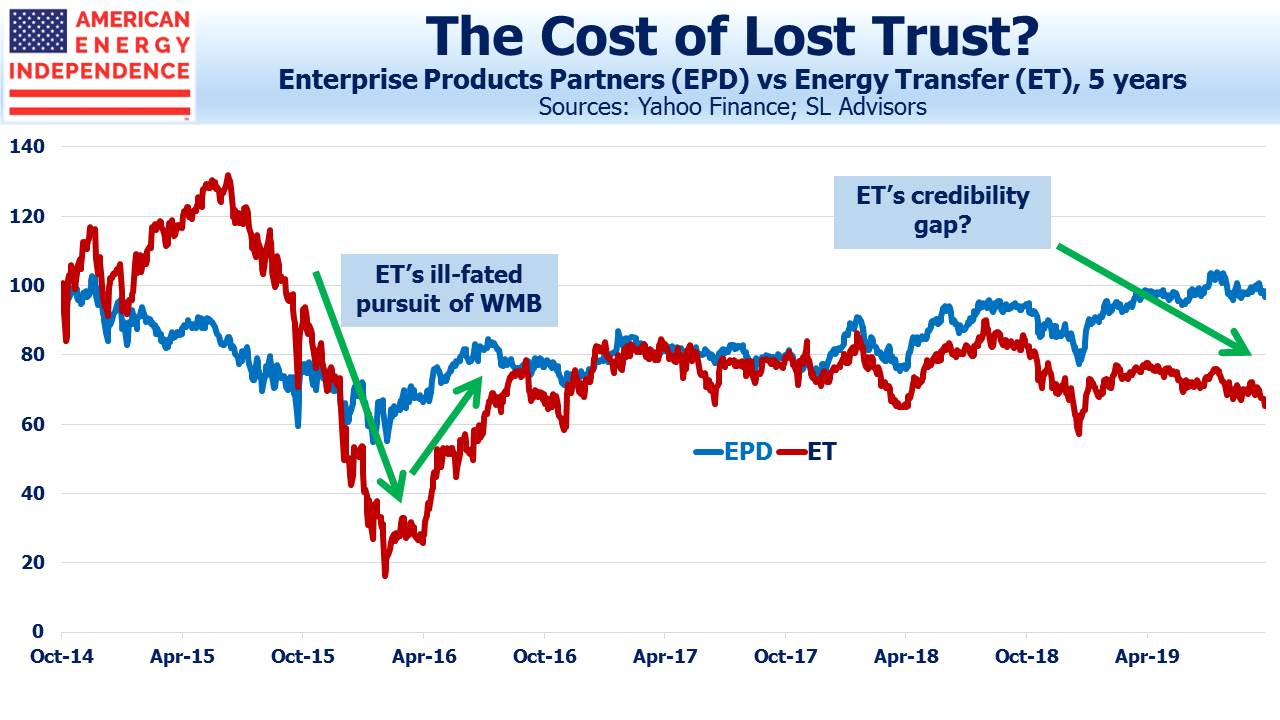
Three years ago, Energy Transfer Equity (then ETE, now ET following its 2018 simplification) cleverly extricated itself from a ruinous attempted acquisition of Williams Companies (WMB). Having relentlessly pursued his target, ETE CEO Kelcy Warren came to regret the terms he’d offered as rating agencies criticized the overly leveraged contemplated combined entity.

Having failed to renegotiate, ETE’s lawyers ingeniously devised a special issue of securities restricted to ETE management. By diluting the subsequent value of ETE units, it had the effect of lowering the value of the proposed combination to WMB shareholders while protecting ETE insiders against any dilution (see Is Energy Transfer Fleecing Its Investors?). Convertible preferred securities were issued to approximately 31% of ETE’s unitholders (that being the portion held by management), that allowed its dividend to be reinvested in new ETE units at a low price only briefly touched. Most ETE investors would likely have invested in such attractive securities had they been more widely offered. But WMB opposed their wider distribution, as they were allowed to under the terms of the merger proposal, predictably since they recognized the dilutive effect of their issuance.

.avia-image-container.av-2m2rxi-02b2d22c780ecc651fff2e40ba316846 img.avia_image{ box-shadow:none; } .avia-image-container.av-2m2rxi-02b2d22c780ecc651fff2e40ba316846 .av-image-caption-overlay-center{ color:#ffffff; }

Ultimately, ETE was able to extricate itself by noting unfavorable tax treatment that would diminish the transaction’s value. The convertible preferreds, originally believed by many to exist solely as a means of destroying the deal’s value to WMB shareholders, remained following its cancellation. Thus did Kelcy Warren cement his reputation as a CEO willing to unethically extract value from his fellow owners when such opportunities present themselves.

A class action lawsuit was filed, and ETE successfully defended itself. The law was on its side, even though many investors felt cheated.

It’s interesting to look back over the three years that have passed and assess whether Kelcy’s reputation for self-dealing remains a burden on Energy Transfer (now ET following its simplification).

Operating performance remains strong. ET regularly beats expectations for quarterly earnings but its stock remains stubbornly undervalued (see Why Energy Transfer Can’t Get Respect). Earnings calls often include questions on what ET can do to get the stock higher, with Kelcy lamenting the market’s lack of appreciation for his team’s value creation.

By most measures ET is attractive. It offers a 9.6% yield, almost 2X covered by Distributable Cash Flow (DCF). Leverage is coming down and their growth projects are self-funded, meaning there’s no additional sale of equity to raise cash.

Master Limited Partnerships (MLPs) offer weaker governance protections to investors than corporations. Tallgrass Equity (TGE) recently demonstrated this when Blackstone’s (BX) offer to acquire the 56% of the company they don’t already own drew attention to a sideletter providing a higher sale price of TGE stock held by management in such an eventuality (see Blackstone and Tallgrass Further Discredit the MLP Model). TGE CEO David Dehaemers showed that the acquisition of a publicly traded partnership doesn’t require a big control premium paid to all the owners – only to management.

It struck us, and ought to assault the sensibilities of every asset manager who owns TGE, that the CEOs of publicly traded partnerships are spectacularly unconstrained by the ethical standards  followed by the people who buy their stock. We invest alongside our clients like most CEOs, but the notion of selling our own shares in a jointly held position higher than our investors is unfathomable, and illegal. Evidently not so for TGE. Whether the BX deal is accepted or modified in some way to try and assuage the appalling optics, Dehaemers has joined Kelcy Warren in ignominy.

It’s become clear that weak governance is affecting the value of some MLPs. A few management teams are trusted to deal fairly, but ET may inadvertently be a casualty of TGE’s demonstration of who holds the high cards.

ET’s stock looks like a bond at the bottom of the capital structure. It pays a high yield easily supported by cash flow, but its holders (being equity investors) have no class of investor beneath them. The upside opportunity that usually compensates equity holders is denied ET investors, because in any sale of ET they should expect the control premium will somehow accrue only to management and not to all ET equity holders. TGE has shown how it can be done.

We calculated that ET insiders transferred over 1.3BN in unethical value to themselves through the convertible preferreds in 2016. However, given ET’s relative performance since then, it looks like a Faustian bargain. They’ve dissuaded investors whose purchases might have driven ET’s yield down by the 3% or so that would equate its valuation more closely with Enterprise Products Partners (EPD), another big MLP but without ET’s history. That would reprice ET stock 50% higher. The management’s team’s 13.5% stake (now lower, since the 2018 simplification resulted in a larger company) would be worth an additional $2.2BN, So the valuation haircut on management’s holdings is more than the 2016 transfer of value. Kelcy’s dubious ethics have burdened ET’s stock for the worse, costing everyone, including the people running the company.

We are invested in ET and EPD


MLPs No Longer Represent Pipelines

As recently as five years ago, the terms “MLPs” and “pipelines” were interchangeable. If you wanted to invest in pipelines for their steady growth and attractive tax-deferred yields, you had little choice but to be a K-1 tolerant, MLP investor. MLP-dedicated funds were developed to provide retail exposure to the sector, but the corporate tax burden has contributed to their disappointing performance (see MLP Funds Made for Uncle Sam).

A far bigger contributor to poor performance has been years of distribution cuts to fund growth (see It’s the Distributions, Stupid). Income generating businesses became growth-seeking, as the Shale Revolution drove the industry to reinvest more of its cash in infrastructure. America’s energy renaissance broke the MLP model.

This has led to a steady diminution of the importance of MLPs to the midstream energy infrastructure sector, since many of the biggest have converted to be corporations (“c-corps”). This makes them available to a far wider pool of investors than MLPs, which still generally struggle to attract significant institutional support.

.avia-image-container.av-2alb1d3-ee83632988bee990999f2a19bf8f3c47 img.avia_image{ box-shadow:none; } .avia-image-container.av-2alb1d3-ee83632988bee990999f2a19bf8f3c47 .av-image-caption-overlay-center{ color:#ffffff; }

One consequence is that the Alerian MLP Index (AMZX) is becoming steadily less representative of midstream. This is why two years ago we created the American Energy Independence Index (AEITR), recognizing that MLPs are only part of the story. AEITR limits partnerships to 20%, reflecting their diminshing importance and allowing investment products linked to it to be fully RIC-compliant with no corporate tax burden. AEITR also excludes MLPs that are controlled by a General Partner (GP), because of the weak rights such MLP investors have as well as the dilutive payments (called incentive distribution rights) from the MLP to the GP.

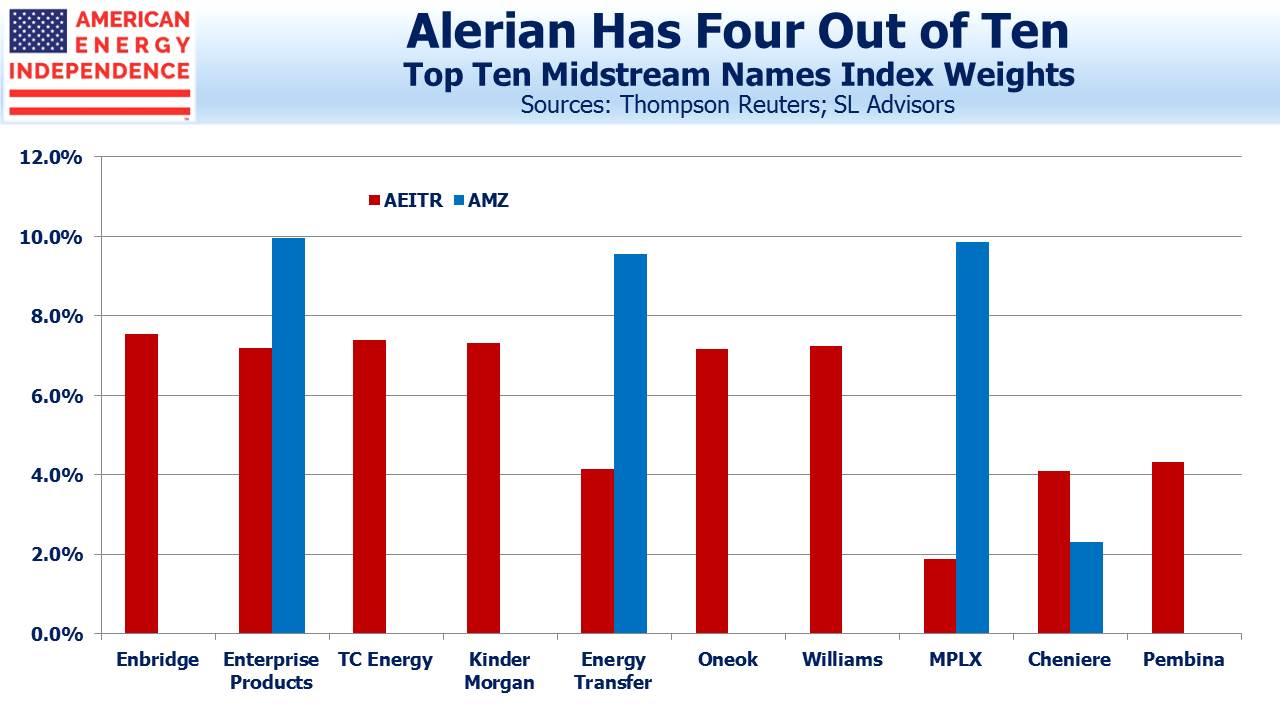
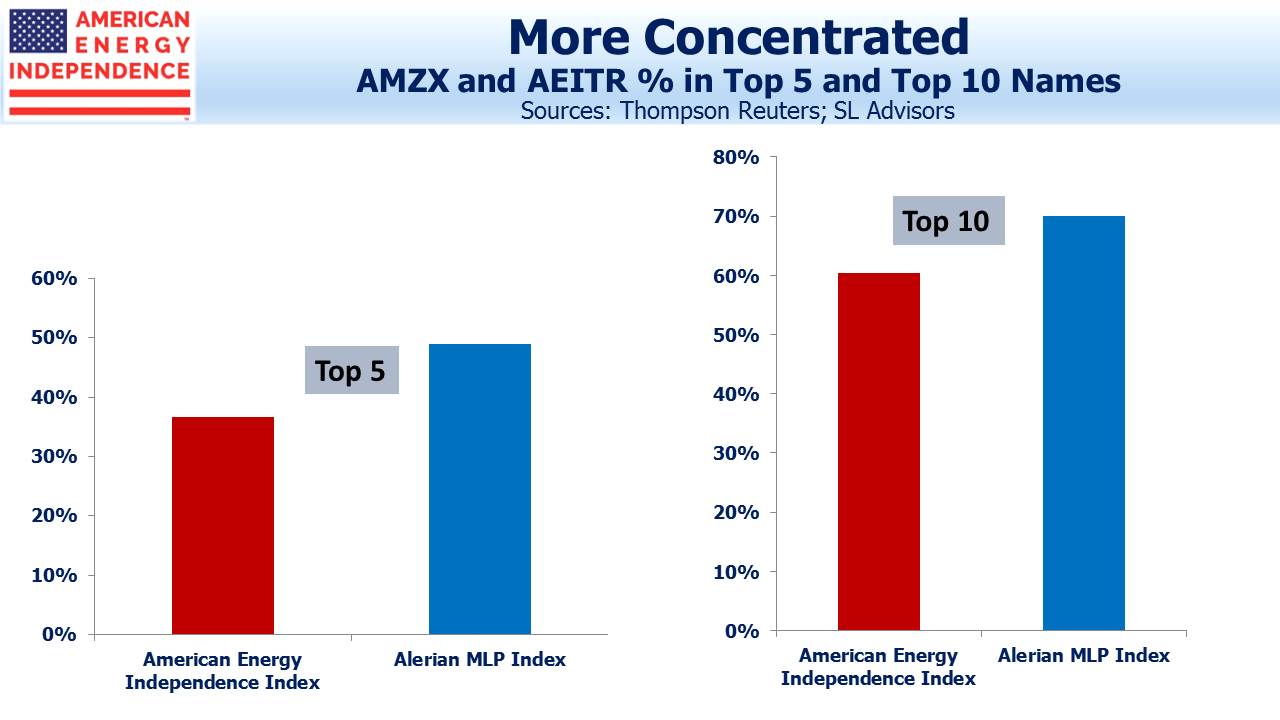
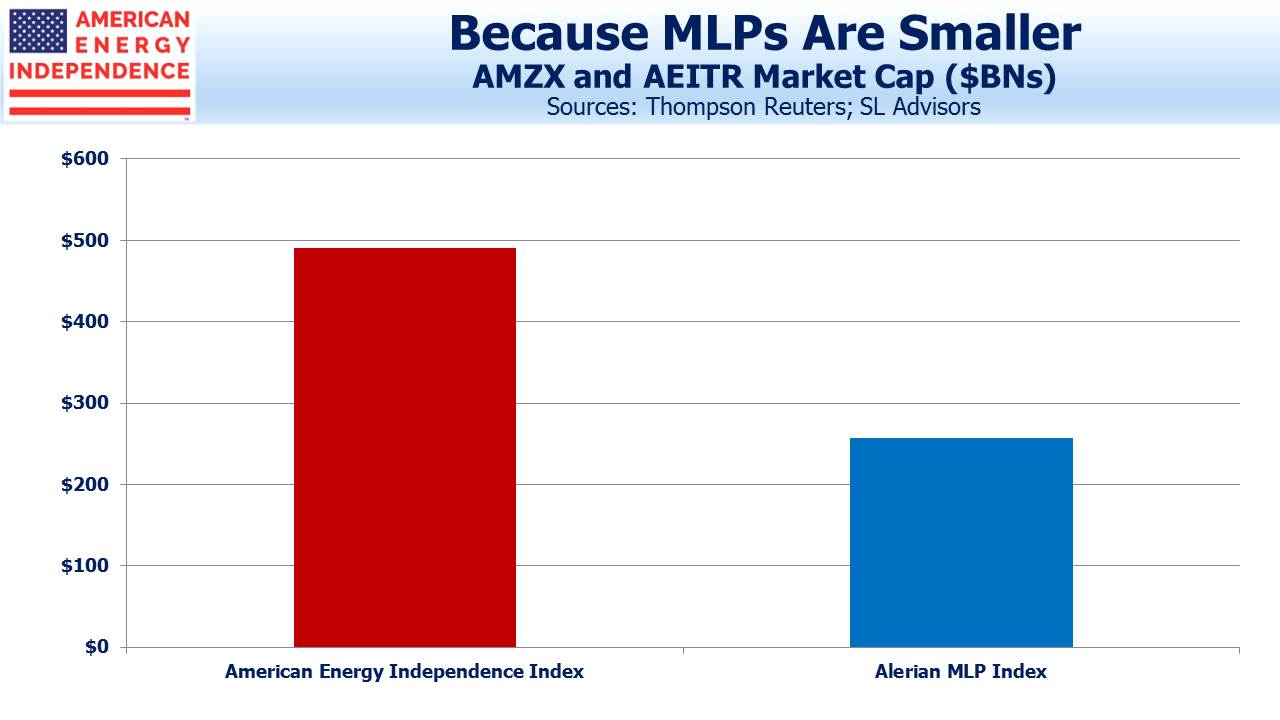
The shift to corporate form for the industry has left AMZX including only four of the ten biggest names in the sector in its index – because most of the giants are corporations. It’s also led to it being more concentrated – 70% of the index is in only ten names (versus 60% for AEITR) and 49% is in only five (versus 37%). And the market cap of the underlying names in AMZX is $257BN, only slightly more than half the AEITR’s $490BN.

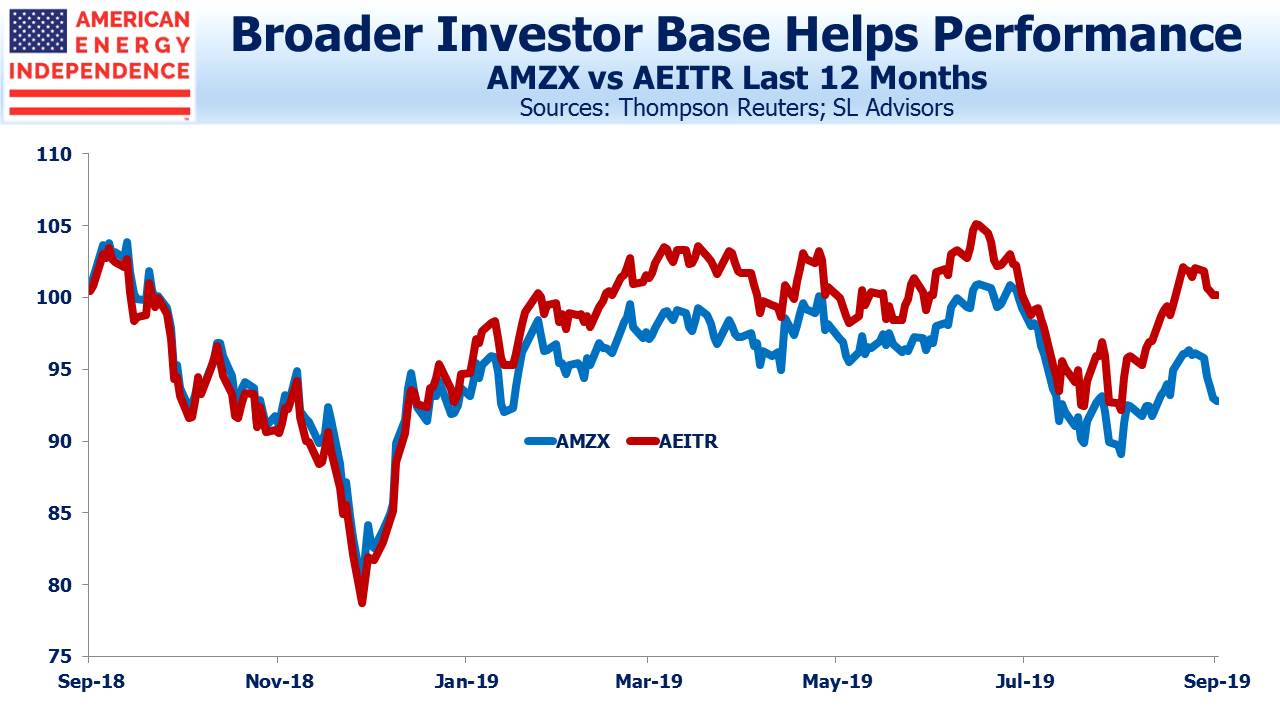
Investors are increasingly shifting to broader exposure, which is why corporations have been outperforming MLPs. This is illustrated by the AEITR (80% corporations) leading the AMZX (100% partnerships) by 7% over the past twelve months.

.avia-image-container.av-1myc6fb-d02ee36e02e3c7b5d20af6901de4a8e8 img.avia_image{ box-shadow:none; } .avia-image-container.av-1myc6fb-d02ee36e02e3c7b5d20af6901de4a8e8 .av-image-caption-overlay-center{ color:#ffffff; }

Partnerships provide weaker protections to investors, especially on issues of governance. It’s why Energy Transfer (ET) was able to award preferential securities to management three years ago (see Will Energy Transfer Act with Integrity, written when misplaced hope remained that they might). More recently, Tallgrass (TGE) showed that it’s not above self-dealing either, when it became apparent that Blackstone’s bid to acquire the 56% it doesn’t yet own would trigger a sale of management’s TGE units at a far higher price via a sideletter (see Blackstone and Tallgrass Further Discredit the MLP Model). Asset managers observe far higher ethical standards than some public companies.

Weak governance is why many institutions avoid partnerships. A research report from JPMorgan recently noted that, “…given the proliferation of corporate governance problems in the MLP space, many generalist investors will not entertain the notion of discussing MLPs in our investor conversations.”

In 2018 there were no MLP IPOs, compared with 20 in 2013 and 18 in 2014. This year Diamondback floated a minority interest in their midstream business as Rattler Midstream (RTLR), but that company elected to be taxed as a corporation, seeking to broaden its appeal by providing a 1099. However RTLR has a partnership governance structure, which means fewer rights for RTLR investors.

.avia-image-container.av-148o7fr-45d6444b24c4847d2f9a402870b4fabd img.avia_image{ box-shadow:none; } .avia-image-container.av-148o7fr-45d6444b24c4847d2f9a402870b4fabd .av-image-caption-overlay-center{ color:#ffffff; }

Over $50BN is invested in vehicles that track MLP indices, much of it in tax-burdened funds. JPMorgan reports $2.5BN in outflows over the past year. The shrinking pool of MLPs is making them less representative, and poor performance has led to outflows, which in turn weighs on pricing.

Changing to a more representative index would require these funds to dump MLPs, which would further depress MLP valuations. As a result, Alerian continues to talk up the MLP structure with blogs such as the sycophantic TGE: Take-Private Bid Highlights Continued Private Equity Interest in Midstream. There’s no mention of the controversial sideletter noted above.

.avia-image-container.av-312wbr-e689155ab3216ca8884939edaeef40ae img.avia_image{ box-shadow:none; } .avia-image-container.av-312wbr-e689155ab3216ca8884939edaeef40ae .av-image-caption-overlay-center{ color:#ffffff; }

There continue to be some good MLPs, such as Enterprise Products Partners (EPD), Magellan Midstream Partners (MMP) and Crestwood Equity Partners (CEQP). Some that are closely held see little value to incurring a corporate tax burden (see Pipeline Billionaires Cling to Partnership Model Others Shun).  ET is well run but undervalued, reflecting the perceived risk to investors of more questionable dealings by management. MLPs with a history of fair dealing receive a higher valuation than others. But poor governance remains a headwind to greater investor interest.

Surprisingly, ESG funds own several large midstream corporations including Kinder Morgan (KMI), Oneok (OKE) and Williams Companies (WMB) (see Improving disclosures is key to ESG investment in midstream, analysts say). Partnerships are not among the names held by ESG funds, because on “G” (Governance), they come up short.

Pipelines are no longer synonymous with MLPs, even though many funds behave as if they are. Fund flows and relative performance show investors are taking notice.

We are invested in CEQP, EPD, ET, KMI, MMP OKE, TGE and WMB


Saturday`s Attack Is A Game Changer

Early analysis of the twin attacks on Saudi Arabia’s oil infrastructure has focused on the length and severity of supply disruption. 5.7 Million Barrels per Day (MMB/D) of lost output is the biggest supply drop in history, although its impact will depend on how long it takes to repair the damage.

This misses two more important results: (1) the physical vulnerability of Middle Eastern energy infrastructure, and (2) the increasing odds of regional conflict.

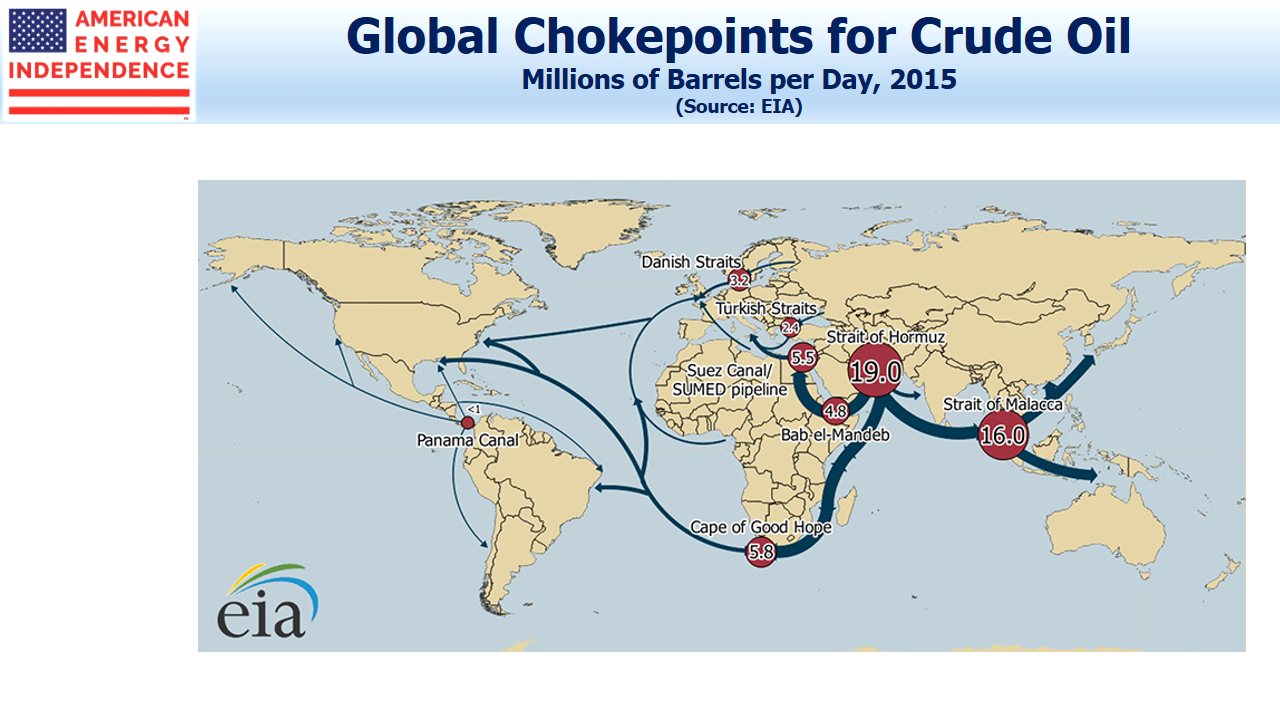
The attack laid bare Saudi Arabia’s inability to defend itself or even intercept enemy drones traveling through its airspace. This is an embarrassing failure of the Saudi military to protect the kingdom’s vital infrastructure. Buyers of crude oil will need to consider the ability of suppliers to deliver on their commitments. A substantial portion of the world’s energy comes from unstable regions, and Saturday’s attack showed that it’s possible to create significant disruption by targeting chokepoints in the supply chain (Investors Look Warily at the Persian Gulf).

It’s not just crude oil that’s at risk, although that is the current focus. Qatar is the world’s biggest exporter of Liquified Natural Gas (LNG), sending around 10 Billion Cubic Feet per Day (BCF/D) through the Straits of Hormuz,  25% of the global LNG market. The five biggest export markets are in Asia, where 75% of LNG trade takes place.

.avia-image-container.av-vo38ge-a14bf298073bcdcdd89c617f7b40b8bd img.avia_image{ box-shadow:none; } .avia-image-container.av-vo38ge-a14bf298073bcdcdd89c617f7b40b8bd .av-image-caption-overlay-center{ color:#ffffff; }

Global Chokepoints for Crude Oil

The risk of disruption to LNG and seaborne crude trade is now higher. At the margin this all makes Middle East sourced hydrocarbons more expensive and less reliable. Higher maritime insurance, additional storage in case of supply disruption and all the related risks of doing trade in a region sliding towards open conflict will require market adjustment.

By contrast, the U.S. energy sector is a clear winner. Its infrastructure is geographically dispersed and protected by the world’s military superpower as well as two oceans. The reliability of American supply suddenly seems a bit more important.  Added to that, Canada’s export pipelines  connect to the U.S. providing another reliable 3.5MMB/D of oil supply.

U.S. midstream energy infrastructure also has more global importance, since the growing role of the U.S. as an exporter makes world markets more reliant on a producer able to lift production when needed.

The Permian basin, which accounts for most of U.S production growth, is only expected to add about 0.6 MMB/D over the next year, so won’t suddenly produce an additional 1 MMB/D. Sustained higher prices will assuredly lift output over time, but even short cycle shale has its limitations.  Large multi-pad wells that are the most economic can take up to a year and a half to bring online.

Markets have not really repriced the odds of the regional conflict spreading to include Iran directly rather than its proxies. We have noted before the link between the pre-1941 embargo on Japanese oil imports and the current embargo on Iranian exports. The problem is that the U.S. is not offering the Iranian regime a clear path out. Since open conflict would be disastrous, Iran is pursuing asymmetric conflict with plausible deniability. Moreover, the shift from mining tankers in the Gulf to attacking oil infrastructure is a clear ratcheting up. Whether intentional or not, this seems likely to provoke a response. Saudi Arabia’s rulers must be considering right now the type of military response required and whether they even have the capability to deliver it alone.

Public support in the U.S. for another major conflict in the Middle East is low, and the Shale Revolution affords us more geopolitical flexibility. But if the U.S. does not take a military role, the vacuum will force other countries to consider their willingness to risk further disruption to the 20MMB/D coming out of the region.

Middle Eastern energy supplies are more vulnerable to disruption that previously priced in financial markets (i.e. Brent-WTI spread). U.S. energy infrastructure has an important role to play in providing secure energy supplies. The Middle East is headed towards more open conflict between two big adversaries.

Markets seem to have focused so far only on the short term disruption and how long Saudi Aramco will need to restore supply – currently estimated at a few weeks, although on the weekend it was said to be only days.

We think this attack requires a significant recalibration of supply security. American energy assets look very attractive.


America Offers Safer Energy

Saturday’s surprise attack on Saudi Arabia’s Abaqaiq oil facility in Buqyaq has sent crude oil prices sharply higher. There are estimates of up to 5.7 Million Barrels per Day (MMB/D) of lost output. For perspective, the last two big drops in crude oil, in 2008 and 2014-16, were caused by around 2% excess supply. The lost Saudi output, half of what that country produces, represents around 5% of world demand.

It’s unclear how long it will take to repair the damage. Estimates are at least several weeks. Saudi Arabia has assured buyers that deliveries will be augmented from crude kept in storage.

Regardless of where crude prices go, owning energy infrastructure in the U.S. looks a bit smarter (see U.S. Insulated From Possible

Landscape image of a oil well pumpjack wiith an early morning golden sunrise and American USA red White and Blue Flag background.

Supply Shock After Saudi Attack). U.S. production is decentralized, making it virtually impossible for a single attack anywhere to disrupt a significant portion of output. And while terrorism remains a relentless threat, the U.S. has shown it is able to protect its vital assets.

Although crude oil prices will initially provide a lift to the perennially downtrodden midstream energy infrastructure sector, we think investors will reassess sources of energy supply based on stability. This should provide more enduring support to a business that is wholly based in North America, far removed from the world’s unstable regions and increasingly the world’s marginal producer.

Much of the world’s energy comes from politically unstable parts of the world (see Investors Look Warily at the Persian Gulf). The Shale Revolution has provided America with more geopolitical flexibility to pursue its aims without worrying about OPEC cutting supplies (see U.S. Plays Its Foreign Policy Hand Freed From Oil). Growing domestic production gives America greater control over its economy (see Shale Security).

Midstream energy infrastructure, which supports American energy independence, is a clear beneficiary of the weekend’s news.

.avia-image-container.av-rw8475-b1773a8bfff13a20a0ed5b47f2e1b43e img.avia_image{ box-shadow:none; } .avia-image-container.av-rw8475-b1773a8bfff13a20a0ed5b47f2e1b43e .av-image-caption-overlay-center{ color:#ffffff; }


Momentum Crash Supports Pipeline Sector

Breaking News — Drone attack disables Saudi crude ouput

Although we don’t normally highlight the favorable geopolitics of U.S. midstream energy infrastructure, this news does emphasize that much of the world’s crude oil comes from unstable regions. See WSJ story U.S. Insulated From Possible Supply Shock After Saudi Attack

Momentum Crash Supports Pipeline Sector

The action in equity markets last week was beneath the surface. Daily moves in the S&P500 were unremarkable, but a sharp turn in momentum stocks caused lots of churning.

The resulting shift into value was welcome news for energy investors. Momentum and Value had tracked each other reasonably well for the past year until May, when Momentum began to outperform.

Eventually midstream energy infrastructure (defined as the American Energy Independence Index, AEITR), and Value both weakened during the summer. By late August, Momentum had opened up a 14% gap against Value over the prior five months, with similar outperformance against AEITR.

As portfolio managers in the pipeline sector we often struggle to explain the moves in the stocks we own. Apart from earnings season, macroeconomic developments and fund flows dominate. This past period was especially hard to understand because 2Q19 earnings reports were generally as expected.

In September this trend has reversed (see Drop in hot stocks stirs memories of ‘quant quake’), for reasons no clearer than those that preceded it. Value is 8% ahead of Momentum since Labor Day, lifting the AEITR with it.

.avia-image-container.av-18nksmo-8a36befd968db91eed2462f0f8f32f1c img.avia_image{ box-shadow:none; } .avia-image-container.av-18nksmo-8a36befd968db91eed2462f0f8f32f1c .av-image-caption-overlay-center{ color:#ffffff; }

What’s behind this? Large pools of capital are deployed based on factor bets like Momentum and Value, relying on research that ascribes long term equity returns to them. Momentum has been outperforming Value for several years – since the peak in oil in 2014, which partly explains negative sentiment towards the energy sector since then.

During the summer, the difference in relative performance jumped sharply, leading to the recent correction. Perhaps slowing global growth has caused a reassessment of high fliers. It increasingly looks as if trade tariffs, which are simply import taxes, are spreading a chill across the world economy.

.avia-image-container.av-wkpsds-187f471422f389ae25e8f56bbc6de4d0 img.avia_image{ box-shadow:none; } .avia-image-container.av-wkpsds-187f471422f389ae25e8f56bbc6de4d0 .av-image-caption-overlay-center{ color:#ffffff; }

Momentum has slipped 9% against Value since August 29. This is an unusually fast correction. In 2016, Value outperformed Momentum by 10%. This lifted MLPs, with the Alerian MLP Index returning 18% that year.

If Value starts to regain favor, investors will find plenty of cheap stocks among midstream energy infrastructure.

Blackstone — Tallgrass

Two weeks ago Blackstone offered to acquire the 56% of Tallgrass Energy (TGE) it didn’t already own. The $19.50 per share price was below the $22.47 at which Blackstone had bought 44% earlier this year. But the sideletter allowing TGE management to sell at $26.25, regardless of the price received by other TGE shareholders, is unethical.

As we noted in Blackstone and Tallgrass Further Discredit the MLP Model, the deal exposed an ethical gulf between the prevailing standards at asset managers and the public companies we invest in. If we treated our investors the way TGE proposes to, our careers would be brief.

What’s surprising is the silence among other TGE investors as well as sell-side analysts. Few wish to risk upsetting either Blackstone or Tallgrass by pointing out the obvious. This failure to speak out is itself a disservice to clients.

Although there have been no further announcements since the proposal was made public, TGE’s stock has edged above the deal price. Some traders are betting that Blackstone will sweeten its offer. If that turns out to be the case, we’ll be happy to have helped.

We are invested in TGE


Climate Promises from Politicans: America Will Do Better

Over 60% of U.S. liquid hydrocarbon production comes via hydraulic fracturing (“fracking”).  This includes 7.75 million Barrels per Day (MMB/D) of crude oil (total 12.4 MMB/D), and three  MMB/D of Natural Gas Liquids (NGLs, including propane and butane) out of five in total. In addition, shale natural gas production  is 68.5 Billion Cubic Feet per Day (BCF/D) from fracking, three quarters of our 91 BCF/D total.

Presidential primaries invite bold promises, and Elizabeth Warren does not disappoint with her pledge to ban all fracking in the U.S., on her first day in office no doubt.

If Warren does become president, such an executive order would reflect democracy in action. So her position is either (1) disingenuous, since such an economically ruinous move is implausible, or (2) reckless, because of the economic consequences.

Presidents are not Emperors. The 2005 Energy Policy Act among others restricts presidents from choosing industries by executive action. Legislation would be required by Congress, although presidential persistence can overcome constitutional checks and balances. The wall being built on our southern border without explicit Congressional funding is an example. Improbable campaign promises can become policy.

.avia-image-container.av-28o4gog-c57c03daf5d5996b454e308370db4e3e img.avia_image{ box-shadow:none; } .avia-image-container.av-28o4gog-c57c03daf5d5996b454e308370db4e3e .av-image-caption-overlay-center{ color:#ffffff; }

Oil markets would adjust to the loss of 10% of global supply, even though excess supply is estimated at only a fifth of this. Warren’s presidency  would open with sharply higher gasoline prices for all Americans, with an outsized impact on lower-income voters many of whom vote Democrat. During the 2008 financial crisis, crude consumption fell by 1.5% and oil fell from $144 to $34 within five months. From 2014-16 crude oil collapsed from $100 per barrel to under $30, and the supply excess was estimated at around 1.5-2%.  Given a sudden supply shortage five times as big, a tank of gas might cost as much as a lightly used iphone.

Natural gas is the biggest source of electricity generation. Heating and a/c bills would soar. Acting like a regressive tax hike, a fracking ban would slow growth and drive unemployment higher. The US$ would weaken, further exacerbating the increase in our trade deficit from importing more crude oil. It would represent a substantial transfer of American wealth to OPEC and Russia.

.avia-image-container.av-1st7wpc-b24d0d2937e0b6a57a85e5fcd12f4570 img.avia_image{ box-shadow:none; } .avia-image-container.av-1st7wpc-b24d0d2937e0b6a57a85e5fcd12f4570 .av-image-caption-overlay-center{ color:#ffffff; }

Many positions taken during primaries are later ditched during the national election. Warren’s sound-bite policy is less extreme than Bernie Sanders, who believes, “Fossil fuel executives should be criminally prosecuted for the destruction they have knowingly caused.” Although this falls short of the “lock ‘em up” characterization of his position, it still represents a chill for those legally supplying what the market wants. Why aren’t energy consumers as culpable as suppliers?

Deep disappointment seems inevitable – most likely for environmental extremists when such promises turn out to be unattainable, but possibly for the rest of us if a new administration seriously pursues them.

.avia-image-container.av-11aim34-95d6e26bde5544fb63681bbf8a09b94d img.avia_image{ box-shadow:none; } .avia-image-container.av-11aim34-95d6e26bde5544fb63681bbf8a09b94d .av-image-caption-overlay-center{ color:#ffffff; }

The U.S. economy is decarbonizing, at around 2.3% p.a. over the past 25 years. This means the ratio of CO2 produced to GDP has been falling at this rate. The figures for other developed countries generally fall between 2% and 3% p.a. The global decarbonization rate since 2000 is 1.6% p.a.

PwC estimates that achieving an 80% reduction in CO2 emissions by 2050 (consistent with goal of limiting global warming to 2 degrees Celsius above pre-industrial levels) would require a global decarbonization rate of 6.4%, four times the current rate.

Estimates of Warren’s plan suggest a 9.9% rate of annual improvement, while Bernie Sanders’ requires 15.2%. Sharply curtailed supply of traditional energy is a cornerstone for all Democrat candidates.

.avia-image-container.av-su7ysw-19e01f4ddf6a44df7544640e512212d0 img.avia_image{ box-shadow:none; } .avia-image-container.av-su7ysw-19e01f4ddf6a44df7544640e512212d0 .av-image-caption-overlay-center{ color:#ffffff; }

Although climate change extremists focus on transportation, in 2018 in the U.S. this was 28.3 quadrillion BTUs of energy consumption, 28% of the total. Industry used around 26% of our energy, for the production of chemicals, plastics, refining, construction, steel, fertilizer, cement and glass. Much industrial use of energy requires high heat or the chemical composition of fossil fuels, qualities not available with renewables.

The curtailment of steel production has led to one estimate that Sanders’ proposal would require the removal of 200 million cars from U.S. roads by 2030.

Solutions need to be sound-bite ready, and fit into Twitter’s 280-character limit. This leaves little room for thoughtful discussions of what kind of economy we’ll have with dramatically less steel, glass, cement and fertilizer; why we’re not phasing out every coal plant in favor of natural gas; on the case for common standards and commissioning of nuclear power; and sharply higher R&D into cleaner ways to use what works, which is overwhelmingly fossil fuels.

The world’s cattle produce 5 gigatons of greenhouse gases annually, only slightly less than the U.S. Phasing out cows (meaning ending their reproduction) would eliminate this source of emissions within twenty years (see The Bovine Green Dream), an outlandish suggestion that is nonetheless more practical than the Democrat policy proposals on offer.

There’s no thoughtful discussion of the necessary trade-offs, weighing risks, costs and outcomes. Discourse consists of brief sentences of one and two syllable words. The U.S accounts for just 14% of global emissions. The Democratic primaries have put the most thoughtless solutions on display. Americans deserve better — we should all hope that such extreme policies are abandoned in favor of more thoughtful ones.