4Q18 Energy Infrastructure Earnings Wrap Up

Earnings season often produces memorable soundbites during the conference calls that follow. Last summer, Energy Transfer (ET) CEO Kelcy Warren said, “A monkey could make money in this business right now.” (see Running Pipelines is Easy). Kelcy is not overly burdened with modesty, but at least he is backing up his brash comments with results. ET’s 4Q18 report completed a strong year, and they reaffirmed previous 2019 guidance that is at the high end of expectations. ET is seeing the benefits of its exposure to Permian crude oil, natural gas and NGL logistics.

The company has an aggressive culture, which is reflected in their laudable response to troublesome environmental activists. But it also shows up in conflict with regulators in Pennsylvania, where all work was recently halted on its Revolution pipeline project due to compliance failures. When asked what lessons they’ve learned, Kelcy answered “We’ve learned a lot. Every place is not Texas.” There’s also the ill-fated pursuit of Williams Companies (WMB), which included a dubious issuance of convertible stock to management (see Will Energy Transfer Act with Integrity?, written when we thought they might). ET’s management has a checkered reputation.

Nonetheless, with a Distributable Cash Flow (DCF) yield of 14.7%, this is a cheap stock. If not for the preceding considerations it would be a bigger position for us.

.avia-image-container.av-qrk6bd-84d0714676da2bf094ce0fba37dd91cf img.avia_image{ box-shadow:none; } .avia-image-container.av-qrk6bd-84d0714676da2bf094ce0fba37dd91cf .av-image-caption-overlay-center{ color:#ffffff; }

TRGP 4Q18 Earnings

Joe Bob Perkins, CEO of Targa Resources (TRGP), provided this quarter’s memorable quote. Responding to a question about increased 2019 growth capex, he responded, “…I described it as capital blessings”.

One reason why S&P Energy has been the weakest sector for four of the past five years is the differing views on capital allocation between management and investors. Companies want to invest to grow, while investors would prefer greater return of cash, through buybacks and dividend hikes. Joe Bob knows what investors want whether they like it or not. He continued, “Those are high return strategic investments that every investor looking under the covers would want us to make. And I think most investors and analysts like you looking from the outside in, knowing what they are and when they’re coming on, wanted us to make those investments.”

Joe Bob Perkins gives the impression of tolerating his investors rather than treating them as owners. You’d think having missed selling the company at $140 per share five years ago to ET, he’d have a little more humility.

You could almost hear the TRGP Investor Relations folk wincing. The 13% subsequent drop in TRGP more than offset the bounce earlier in the week from the attractive sale of 45% of their Badlands project to Blackstone Group.

Plains All American (PAGP) saw a welcome rebound in its Supply & Logistics (S&L) segment. MLPs are often described as possessing a “toll-taking” business model that implies stability. S&L is all about exploiting basis differentials – when the price of crude oil between two different points differs by more than the tariff of the available pipeline, PAGP’s network allows it to extract additional profits that are a form of arbitrage. It is a measure of tightness in pipeline availability. In 2013 S&L generated $822MM in EBITDA.

Like other midstream companies, Plains expanded its asset base as the Shale Revolution pushed volumes higher. S&L is a volatile business, and its collapse in 2017 to $60MM in EBITDA coincided with PAGP’s increasing debt, raising leverage and leading to distribution cuts. In general, reduced payouts across the industry coincided with rising EBITDA. But in PAGP’s case they erred by relying too much on a part of their business that relies on market inefficiencies, and doesn’t provide the recurring revenues of pipelines and storage facilities.

Income-seeking investors endured two distribution cuts. The first cut came when the company simplified its structure by waiving the incentive distribution rights PAGP held in its MLP, Plains All American (PAA). A year later, and after an expensive Permian acquisition, it was cut again. Today, both securities offer identical exposure. PAGP provides a 1099 for investors who want simplicity, and PAA a K-1 for greater tax deferral with a little more complexity. By design the two stocks track each other closely.

PAA’s Leverage is now down sharply. 2019 growth capex is expected to be $1.1BN, down from $1.9BN in 2018. The Distributable Cash Flow (DCF) yield is 10.6%, and is expected to grow 6-7% this year.

The prior week WMB reported full year DCF of $2.872BN, up 11% on 2017, as natural gas volumes surged. On the earnings call they noted Transco reached a one day record of 15.68 million dekatherms on January 21 (around 15% of nationwide consumption), when temperatures plummeted across much of the U.S.

Overall, energy infrastructure earnings were mostly good news. We continue to expect increasing dividends this year to draw additional investors to the sector.

We are invested in ET, PAGP, TRGP, WMB.

SL Advisors is the sub-advisor to the Catalyst MLP & Infrastructure Fund.  To learn more about the Fund, please click here.

SL Advisors is also the advisor to an ETF (USAIETF.com)



U.S. National Debt: The Bond Market Doesn’t Care

For almost my entire 38 year career in Finance, we’ve worried about the U.S. Federal deficit. Someone recently asked me if we should still be worried. You’d think that it should have been a problem by now, but it’s not. Thirty year treasury bonds yielding 3% don’t look enticing, but evidently a lot of investors feel differently. Low as they are, U.S. yields are substantially higher than Germany, whose 30 year bonds yield a paltry 0.73%.

.avia-image-container.av-rqibie-14f276c6e9bcfaea1a8751b081150c90 img.avia_image{ box-shadow:none; } .avia-image-container.av-rqibie-14f276c6e9bcfaea1a8751b081150c90 .av-image-caption-overlay-center{ color:#ffffff; }

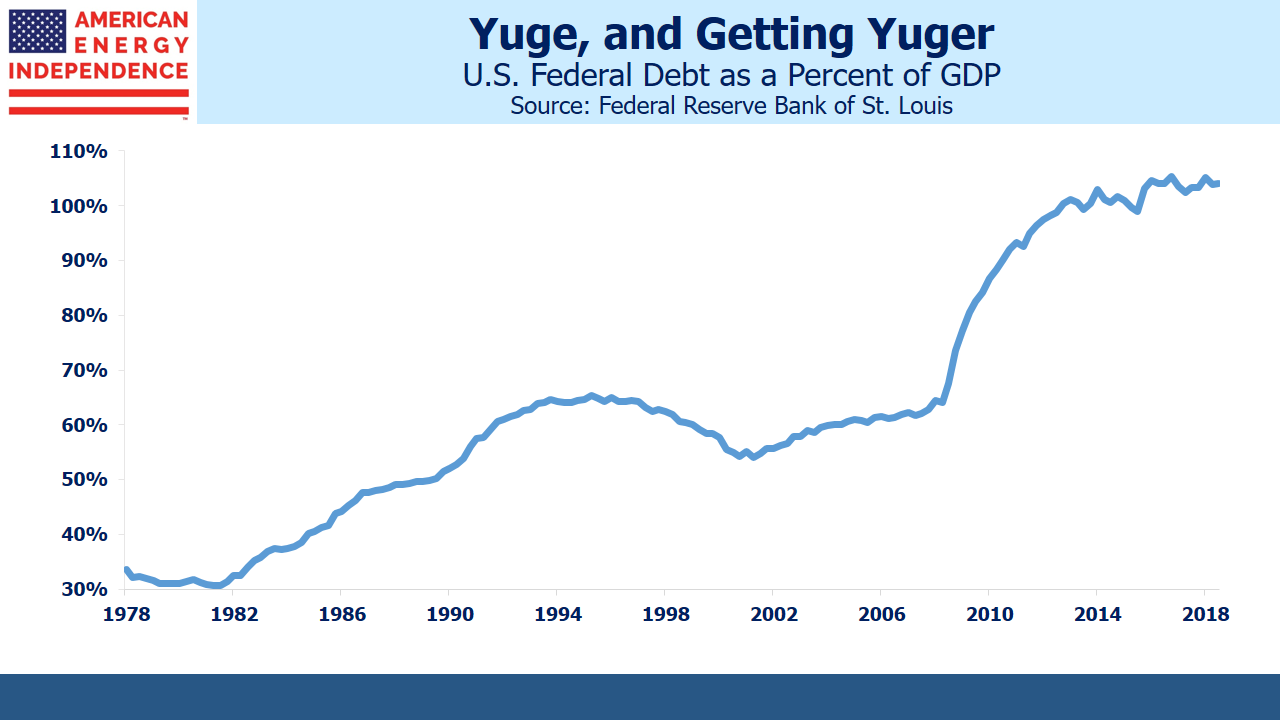
Federal Debt as a Percentage of GDP

U.S. publicly-held Federal debt to GDP rose sharply following the 2008 financial crisis. Circumstances justified a temporary spike to provide fiscal stimulus, but instead it’s continued to grow. Nonetheless, rates just can’t rise — even though the Fed has stopped buying bonds, others have stepped in. Short term rates might even have peaked, following Fed chairman Jay Powell’s communication missteps in December.

The deficit doesn’t seem to matter. As President Reagan joked, “I am not worried about the deficit. It is big enough to take care of itself.”

This view is easily criticized as needlessly reckless with our country’s future. Markets are forward-looking, and most observers are pessimistic about our long-term fiscal outlook. But yields don’t reflect that. Since our current indebtedness is clearly manageable, it’s worth considering alternative outcomes.

Excessive debt was part of the reason for the 2008 crash. As the economy recovered, the U.S. pursued a stealth devaluation by maintaining negative real interest rates. It’s a well-worn path, and while Ben Bernanke didn’t articulate it as such, treasury yields were so low that buyers suffered a loss of purchasing power after taxes and inflation. Even today there’s hardly any return, although a large proportion of the holders aren’t taxable.

Populism adds an interesting dimension. Let’s suppose that U.S. bond yields rise to more fully reflect the sorry state of fiscal policy. Increased interest expense crowds out other expenditure. The Congressional Budget Office forecasts that net interest expense will double by 2024 and almost triple by 2029. They assume ten year yields rise to around 3.7%. The U.S. Debt Clock has some interesting figures.

If the buyers of our debt demand higher rates as compensation for the outlook, interest expense will rise even more. This will crowd out other priorities and add further to the deficit. Stocks would weaken; growth would slow. We can all imagine how a populist-leaning president, like Trump, would respond. Rather than focus on cutting domestic spending, foreign buyers would be warned to keep investing. The U.S. might threaten a withholding tax on foreign holdings of our debt, effectively lowering the rate. It would constitute a default. Who seriously thinks Trump would blink at the prospect?

It needn’t be a Republican. Early Democrat presidential contenders are similarly populist. How would a president in the mold of AOC (gulp) react to foreign creditors slowing the Green New Deal’s hugely expensive re-engineering of America’s economy?

The moral requirement to repay debt has been steadily weakening for years. Federal debt represents an obligation passed down from one generation to the next. It’s easy to see the political appeal in questioning why the country should repay money that was spent on entitlements by a cohort long gone. The bond buyers should have known better. In 2013, in Bonds Are Not Forever; The Crisis Facing Fixed Income Investors, I expanded on this line of thinking. It’s no less relevant today.

Such problems are in the future, but should be well within the time frame of a thirty year bond investor. Today’s yield curve suggests they’re not worried at the prospect. They should be. Publicly held U.S. Federal debt is $16TN. Another $6TN is owed to other agencies, half of which is Social Security. When you owe $16TN it’s their problem too.

Join us on Friday, February 22nd at 2pm EST for a webinar. We’ll be discussing the outlook for U.S. energy infrastructure. The sector has frustrated investors for the past two years, but there are reasons to believe improved returns are ahead. We’ll explain why. To register please click here.

SL Advisors is the sub-advisor to the Catalyst MLP & Infrastructure Fund.  To learn more about the Fund, please click here.

SL Advisors is also the advisor to an ETF (USAIETF.com)


REITS: Pipeline Dividends Got You Beat

Long time MLP investors fondly recall the days before the Shale Revolution, when yield comparisons with REITs and Utilities made sense. This ended in 2014, when the energy sector peaked. Cumulative distribution cuts of 34%, as subsequently experienced by investors in the Alerian MLP ETF (AMLP), convinced income seeking investors that pipelines were a hostile environment.

During the 2014-16 collapse in crude oil, yield spreads on energy infrastructure blew out compared with sectors that were formerly peers. It might be the only period in history when companies have slashed distributions primarily to fund growth opportunities, and not because of an operating slump (see It’s the Distributions, Stupid!)

.avia-image-container.av-24imhf2-8e575dc5784756447c5b3e7f6c7c384c img.avia_image{ box-shadow:none; } .avia-image-container.av-24imhf2-8e575dc5784756447c5b3e7f6c7c384c .av-image-caption-overlay-center{ color:#ffffff; }

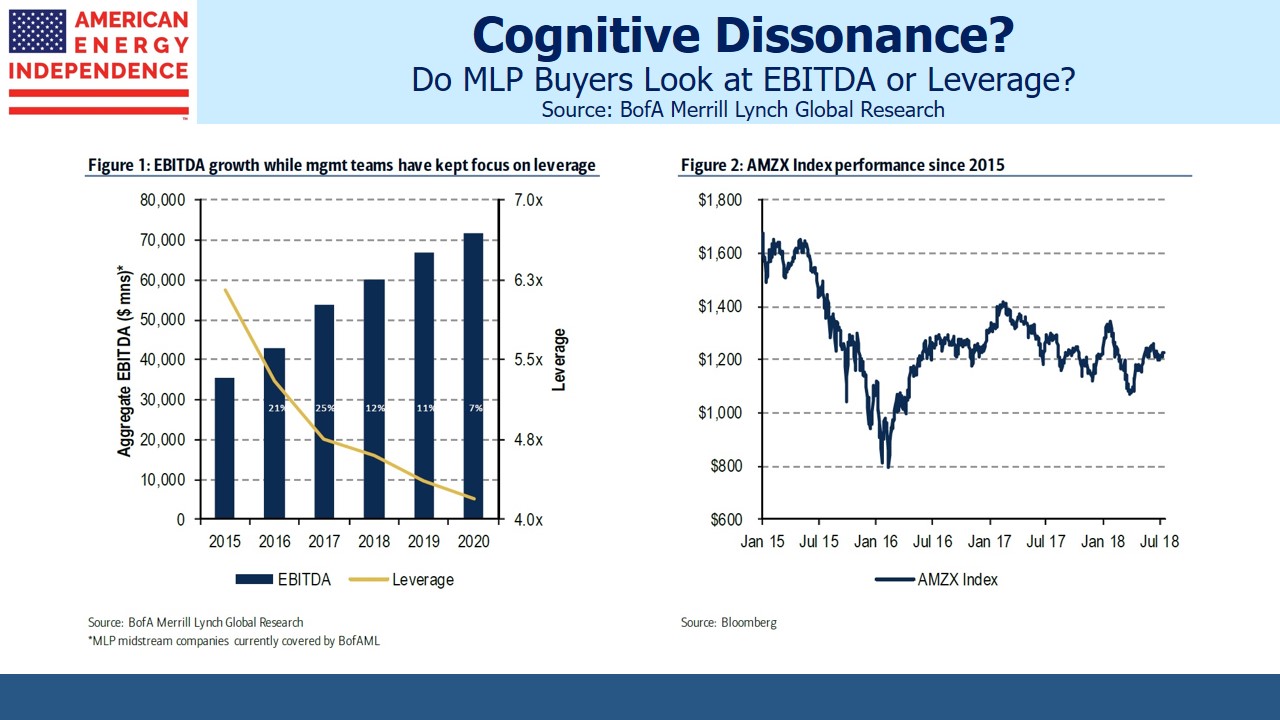
EBITDA vs Leverage

Several months ago, Bank of America published this chart showing that EBITDA for the sector grew steadily through the energy collapse, and leverage came down. Persistent weakness in the sector can best be explained by the betrayal of income-seeking investors. Distribution cuts were unacceptable to many, regardless of the reasons.

2019 should be the first year since crude oil bottomed at $26 per barrel that payouts will be rising (see Pipeline Dividends Are Heading Up). Because falling distributions are so clearly the reason the sector has remained out of favor, increasing payouts could provide the catalyst that will drive a strong recovery.

Income-seeking investors who return to the pipeline sector will find much to like. Funds From Operations (FFO) is a commonly used metric for REITs. It measures the net cash return from existing assets. The analogous figure for energy infrastructure businesses is Distributable Cash Flow (DCF).

We’ve found that comparing pipelines with real estate resonates with many readers. Differentiating between cash earned from existing assets and cash left over after investing in new assets is intuitive when applied to an owner of buildings.

As we showed in Valuing Pipelines like Real Estate, looking at Free Cash Flow (FCF), or net cash generated after new initiatives, doesn’t present an accurate picture if a company is investing heavily. And because dividends have been declining, it’s been hard for investors to get comfortable that current payouts are secure. Since neither FCF nor dividend yields have been enticing, capital has often avoided the sector.

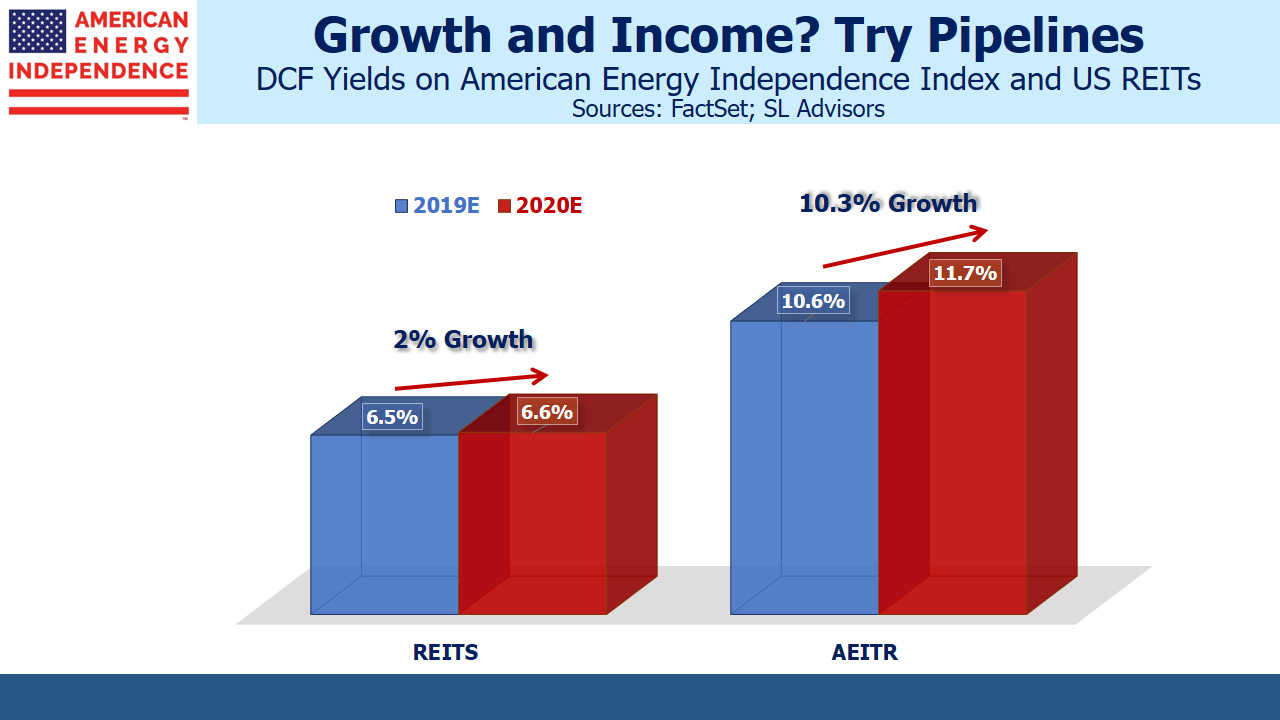
MLPs commonly paid out 90% or more of their DCF in distributions, which left too little cash to fund the growth projects brought on by the Shale Revolution. Attractive DCF yields drew scant attention when payouts were declining, but a consequence of the sector’s loss of favor is that 2019 DCF yields are two thirds higher than for REITs.

.avia-image-container.av-1kluq8e-73b119c6e87155631fbe38cbce2bd090 img.avia_image{ box-shadow:none; } .avia-image-container.av-1kluq8e-73b119c6e87155631fbe38cbce2bd090 .av-image-caption-overlay-center{ color:#ffffff; }

DCF Yields REIT vs AEITR

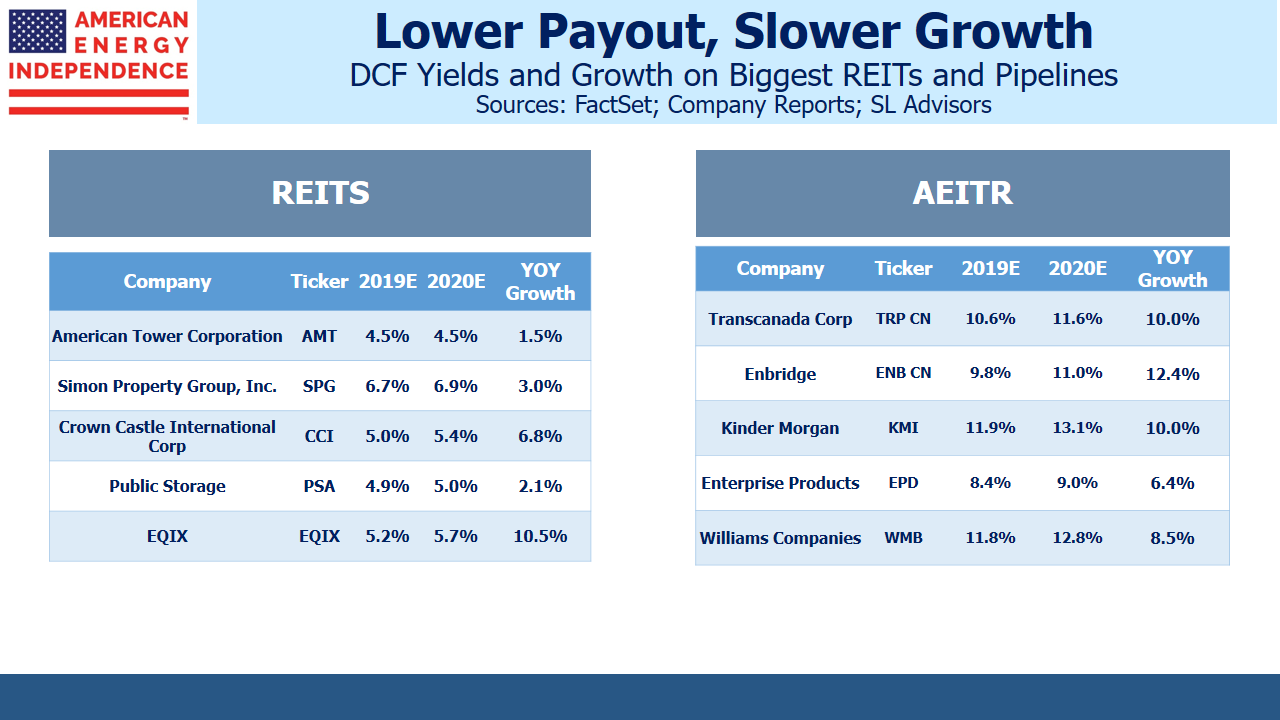
Moreover, they’re set to grow faster. U.S. REIT investors can expect only 2% growth in FFO on a market-cap weighted basis (data from FactSet). We expect 2020 DCF for the American Energy Independence Index to jump by 10.3%. Improving cash flow supports rising dividends, which we expect will be up 10% this year and next (see Income Investors Should Return to Pipelines in 2019).

Much of this is the result of growth projects being placed into production. A pipeline doesn’t generate any cash until it’s completed, so virtually all the expenditure occurs up front. MLP investors suffered the distribution cuts necessary to help fund this – we’re now starting to see the uplift to cashflows. It’s further helped by a likely peak in growth expenditures (see Buybacks: Why Pipeline Companies Should Invest in Themselves, chart #4).

.avia-image-container.av-1bpf8ge-ba8f0985820d656372f5f0d374345368 img.avia_image{ box-shadow:none; } .avia-image-container.av-1bpf8ge-ba8f0985820d656372f5f0d374345368 .av-image-caption-overlay-center{ color:#ffffff; }

MLP Yield Spread vs. REITS

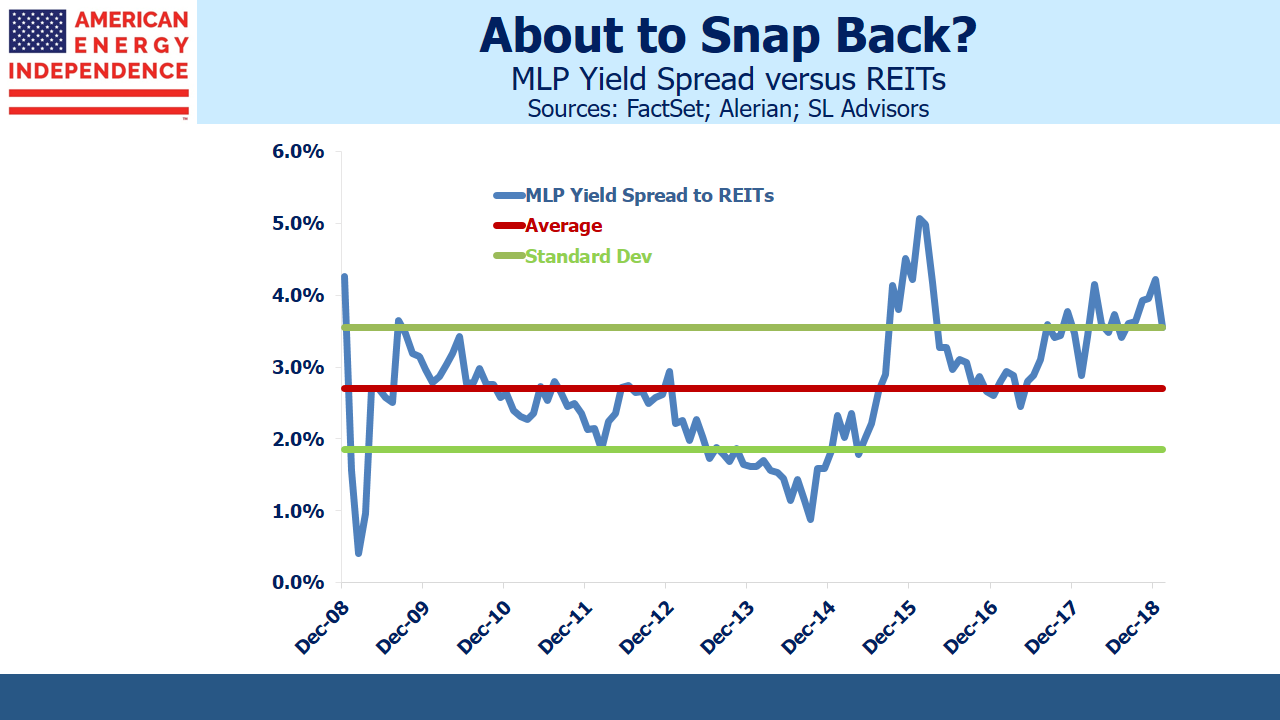
Once REIT investors return to comparing their holdings with energy infrastructure, they’re going to find strong arguments in favor of switching. They’ll find they can upgrade both their income and growth prospects by moving their REIT holdings into pipelines. MLP yields are historically wide compared with REITs, and 85% of the last decade the relationship has been tighter. Just remember to invest in broad energy infrastructure and not to limit your investment to MLPs (see The Uncertain Future of MLP-Dedicated Funds). Four of the five biggest pipeline companies are corporations, not MLPs, which nowadays represent less than half the sector.

.avia-image-container.av-vx0p7y-0976e1ce026b24b07ded046b21586d9e img.avia_image{ box-shadow:none; } .avia-image-container.av-vx0p7y-0976e1ce026b24b07ded046b21586d9e .av-image-caption-overlay-center{ color:#ffffff; }

Top 5 Holdings REITs vs Pipelines

The Shale Revolution is a fantastic American success story. The Energy Information Administration expects U.S. crude oil output to reach 13 million barrels per day (MMB/D) next year. The U.S. continues to gain market share. It’s estimated that Saudi Arabia needs a price of at least $80 per barrel to finance their government spending. To this end, the Saudis are cutting production to below 10 MMB/D. They’re slowly ceding market share in the interests of higher revenues.

Investors have little to show for allocating capital towards the Shale Revolution. That is about to change. The American Energy Independence Index is up 18% so far this year, easily beating the S&P500 which is up 10%. The sector is starting to feel the love.

Join us on Friday, February 22nd at 2pm EST for a webinar. We’ll be discussing the outlook for U.S. energy infrastructure. The sector has frustrated investors for the past two years, but there are reasons to believe improved returns are ahead. We’ll explain why. To register please click here.

We are short AMLP.

SL Advisors is the sub-advisor to the Catalyst MLP & Infrastructure Fund.  To learn more about the Fund, please click here.

SL Advisors is also the advisor to an ETF (USAIETF.com)


ETFs: Business Could Not Be Better

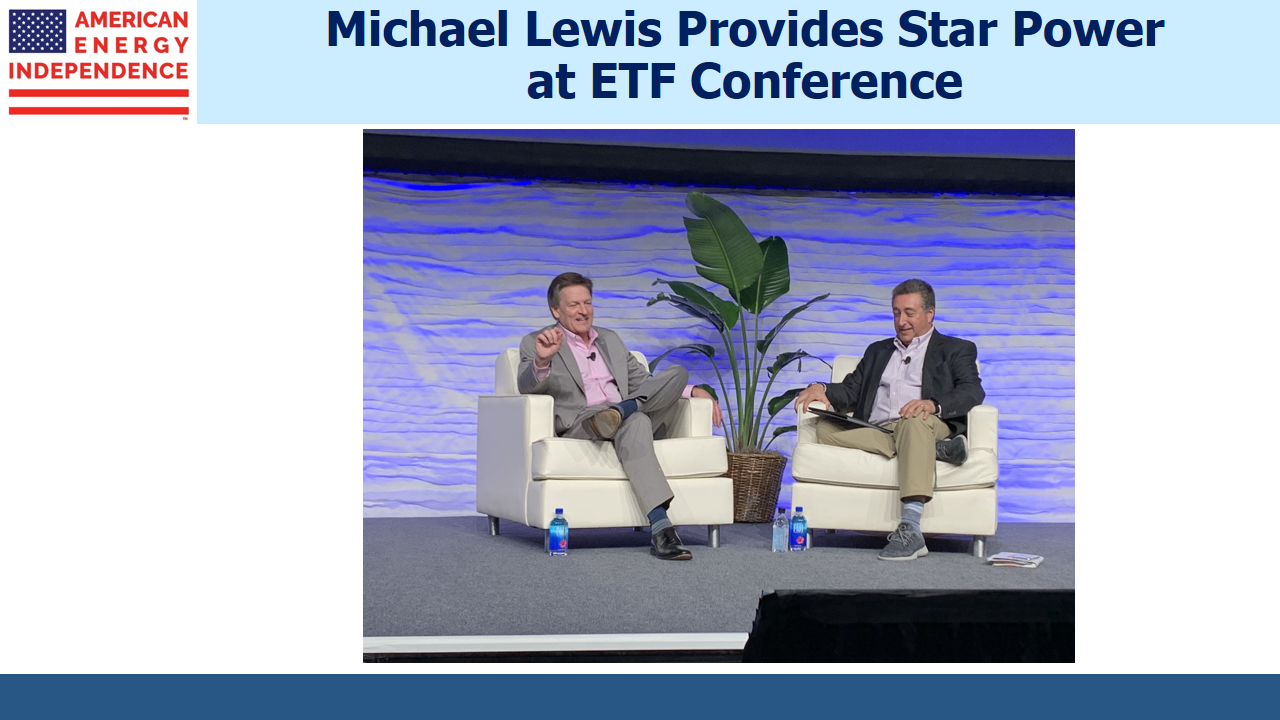
At the InsideETFs conference in Hollywood, FL, author Michael Lewis outdrew the many luminaries on hand offering investment advice. From Liar’s Poker to The Fifth Risk, Lewis has honed his ability to identify a story and recount it engagingly. Interviewer Barry Ritholtz provided thoughtful questions that allowed his guest to enlighten and entertain.

.avia-image-container.av-165bg0z-a715cb136d72d04072a665795c6bff56 img.avia_image{ box-shadow:none; } .avia-image-container.av-165bg0z-a715cb136d72d04072a665795c6bff56 .av-image-caption-overlay-center{ color:#ffffff; }

Michael Lewis at ETF Conference

The book you write isn’t what people read. Liar’s Poker was intended to turn young graduates away from Wall Street. After all, Lewis abandoned a sharply rising $250K annual income for a $40K book contract, only to receive over 100 letters seeking career advice in banking.

Two of Lewis’s books have been made into movies. Tom Wolfe offered memorable advice — when Hollywood, CA offers a movie deal, drive fast to LA; hurl the script over the wall; grab the cash they toss back, and drive very fast east. Bonfire of the Vanities, Wolfe’s novel which caught the 1980s Wall Street zeitgeist only preceded Lewis by a few years. It might be the worst movie ever made, deeply disappointing to Wolfe’s readers and no doubt the author himself. Lewis invests his personal assets in index ETFs which drew a hearty round of applause.

On the more prosaic topic of ETFs, business continues to grow strongly. NYSE executive Doug Yones reported that ETFs have reached 40% of exchange volume. Christmas Eve, normally one of the quietest days, was a record as stocks plunged before January’s rebound. Yones is relieved that this happened without NYSE making headlines. Many have predicted volatility would expose flaws in the structure of ETFs. Criticism is diminishing, as the market keeps working. Pressing the advantage of momentum, Yones expects ETF volumes to double.

Fixed income is a big source of growth. The yield curve offers around 2.5% at every maturity. One dimensional but finally a return of sorts, there are many opportunities to restructure indices that afford quite precise portfolio construction.

ETFs are now offered that mimic structured notes, with capped upside and limited downside. Doug Yones expects actively managed ETFs that don’t provide daily position transparency to be available soon, bringing in some new proprietary strategies.

Bitcoin, last year’s fad, has been replaced by marijuana ETFs. No matter that farming relies on extensive government support, weed believers note huge paper profits for early investors. No more articulate response is required.

As in the past, we derived most value from scheduled and impromptu meetings. S&P is our partner for our ETF,  so Michael Mell kindly endured a photo with your investment management team.

.avia-image-container.av-qfj7ur-d52fbef56b4b5015943f1e5365a60292 img.avia_image{ box-shadow:none; } .avia-image-container.av-qfj7ur-d52fbef56b4b5015943f1e5365a60292 .av-image-caption-overlay-center{ color:#ffffff; }

SL Advisors with S&P at ETF Conference

The ETF business has never looked so strong.

SL Advisors is the sub-advisor to the Catalyst MLP & Infrastructure Fund.  To learn more about the Fund,  please click here.

SL Advisors is also the advisor to an ETF (USAIETF.com)


The Bovine Green Dream

To slow global warming, we should phase out cows. Bovine flatulence is often a source of scatological humor for those making light of greenhouse gas emissions (GHG). However, cattle generate 5 gigatons of CO2 equivalent, annually. More precisely, they produce methane. A chart used by Bill Gates reveals that cattle produce almost as much in harmful emissions as the U.S., and half of China.

The global cattle herd wouldn’t have to be summarily executed – simply allowed to die out with no new replacement cows. On average, cows live about twenty years. If the world could eliminate an America’s-worth of 2018 GHG emissions by 2039, why isn’t that a reasonable option? The U.S. has 6% of the world’s cattle. As with many issues of global warming, the problems are elsewhere. Based on headcount, 35% of bovine emissions come from Brazil, India and China.

.avia-image-container.av-sp5qvk-a5081620a5f5544716ba5bff6325a8a1 img.avia_image{ box-shadow:none; } .avia-image-container.av-sp5qvk-a5081620a5f5544716ba5bff6325a8a1 .av-image-caption-overlay-center{ color:#ffffff; }

The Green New Deal

The proposed Congressional resolution that incorporates the Green New Deal (GND) doesn’t include the end of cows. Curiously though, a Q&A was posted on the website of Representative Alexandra Ocasio-Cortez (a co-sponsor) that implied the eventual elimination of “farting cows and airplanes,” although this was soon taken down (still available here). This is what making policy on the hoof looks like. The sponsors also considered a twelve year deadline for the elimination of fossil fuels in America, but omitted it from the final language. This is more disruptive and expensive than dealing with cows, and happily even less likely. The Green New Deal is hopelessly unrealistic. Even Nancy Pelosi referred to it as the “Green Dream”.

The GND doesn’t address agriculture, other than advocating “family farming,” to promote healthy soil and food. This sector generates a quarter of global emissions.  Industry and manufacturing account for 20% of GHGs.  While the GND calls for “removing pollution and GHG emissions from manufacturing and industry as much as technologically feasible,” there isn’t a zero emission way to produce plastic, steel, cement, chemicals, medicines, electronics and all the carbon based products that make up modern life. Buildings directly contribute another 6%, and the GND requires “upgrading all existing buildings in the United States and building new buildings to achieve maximal energy efficiency, water efficiency, safety, affordability, comfort, and durability, including through electrification.”

The document’s solutions are neither realistic nor practical.  The country can’t start producing more of everything, with no negative externalities, at lower cost.  Electric engines won’t power airplanes or cargo ships anytime soon. Given current technologies, electricity generation and light duty vehicles (around one third of GHGs) are currently the only plausible targets. Only a small portion can be converted economically.

Like much else in politics, extreme views are adopted to motivate core supporters. Socialist ideas in the GND, such as free college, “high-quality union jobs” as well as Federally guaranteed jobs are not related to the environment. Including a grab-bag of left wing ideology adds a juvenile feel.

Last year’s report from the UN’s Intergovermental Panel on Climate Change (IPCC), warned of the planetary risks from increased GHG output, which is caused by humans. Its most famous soundbite is its call to limit future global warming to 1.5 degrees C above pre-industrial levels.

The science around the climate is complicated. Scientists have been predicting catastrophe from rising GHGs for years. You can find serious forecasts from the 1980s showing New York City submerged by now. The IPCC seeks to aggregate the best scientific analysis. It shouldn’t be dismissed out of hand, even though like past efforts, it could be overstating the problem.

So far, planetary warming is noticeable to some but not that disruptive. Nonetheless, most people would agree to some reduction in GHG emissions, if the cost/benefit trade-off was acceptable. The GND doesn’t speak to them. It seems you have to be aligned with the extremists, or you’re opposed.

Cheap, accessible energy is a key driver of rising living standards. The planet may be warming somewhat, but so far the benefits to humankind have been enormous. Put aside for now our energy-dependent lifestyles in developed countries – in emerging economies, there’s a direct link between increasing energy consumption and longevity. Alex Epstein’s The Moral Case for Fossil Fuels defines the issue around what’s good for humanity. Indonesia is just one example of a country where energy has led to cleaner water and better hygiene, leading to longer, healthier lives (see Guess Who’s Most Effective at Combating Global Warming).

Science is driving the concern about global warming. A serious effort to limit GHG emissions also accepts the science-based limitations around relying exclusively on renewables. Most obvious is the inability of batteries to efficiently store the energy produced by intermittent solar and wind for later use. Estimates of the GND’s required investment run into the trillions of dollars, and rely on advances in technology not currently in sight.

“From a vantage point like mine, they’re certainly outside the realm of what is achievable, and I’m not sure that by putting those proposals forth, we’re actually really moving the ball forward for the agenda,” said Francis O’Sullivan, head of research at the MIT Energy Initiative.

Away from the extreme fringes of debate, nuclear power is recognized as part of the solution (including by IPCC). Natural gas is a cleaner alternative to coal, and in being available when solar and wind are not, it improves the utilization of renewable supply.  Environmental activists oppose these and other plausible strategies to advance their goals.

Pipeline opponents cause Canada to move its crude oil by rail (see Canada’s Failing Energy Strategy), and Boston to import liquefied natural gas from Russia instead of Pennsylvania (see An Expensive, Greenish Energy Strategy). Today, fossil fuels provide around 80% of the world’s energy. Inflexible opposition to what works without practical alternatives risks enormous disruption, more expensive energy and lower living standards. In America, the pursuit of extreme solutions risks provoking opposition to even reasonable ones. For poorer countries, it means giving up aspirations for healthier lives.

We invest in energy infrastructure, and we care about the environment. It’s our planet too. The issues are too important to be left to extremists.

SL Advisors is the sub-advisor to the Catalyst MLP & Infrastructure Fund.  To learn more about the Fund,  please click here.

SL Advisors is also the advisor to an ETF (USAIETF.com).


The Trump Put

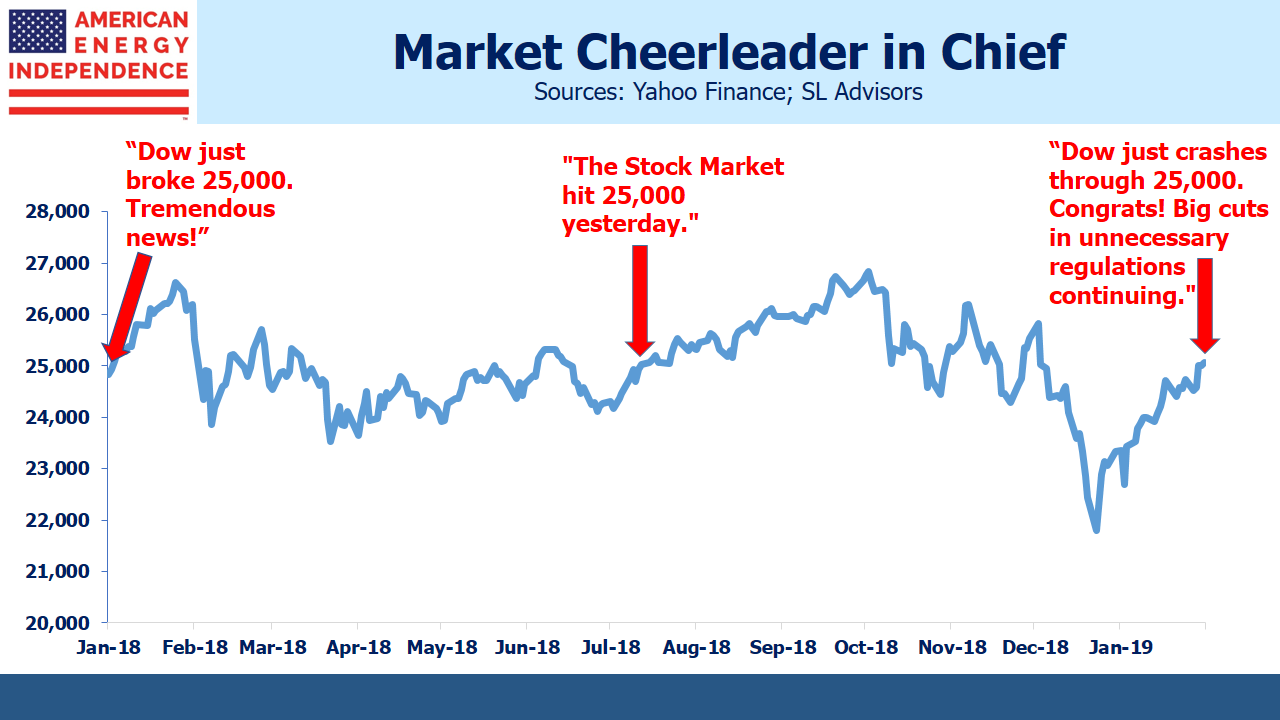
Last week President Trump tweeted, “Dow just broke 25,000. Tremendous news!” It wasn’t the first time the Dow had risen through that threshold. On July 14th, the President tweeted, “The Stock Market hit 25,000 yesterday.” A year ago, on January 4th, 2018: “Dow just crashes through 25,000. Congrats! Big cuts in unnecessary regulations continuing.”

.avia-image-container.av-om7yro-0065e432a8be2ecd964ff69c91fa0986 img.avia_image{ box-shadow:none; } .avia-image-container.av-om7yro-0065e432a8be2ecd964ff69c91fa0986 .av-image-caption-overlay-center{ color:#ffffff; }

The Trump Put

This president probably cares more about short term moves in stocks than any predecessor. He has adopted it as a report card of how his administration is doing. Past presidents have generally positioned themselves above the fray, concerning themselves more with economic data such as GDP growth and unemployment. These are important to President Trump too, but the Dow provides a real-time gauge of his performance, reflective of today’s social media supported news.

His cabinet colleagues clearly recognize this. We winced at Treasury Secretary Steve Mnuchin’s comments in December that banks had “ample liquidity”. Stocks were very weak, largely because of problems caused by the government. The trifecta of growth –inhibiting tariffs, a looming federal government shutdown and Fed chair Powell’s communication missteps were the main cause (see Problems Made in DC Can Be Fixed There). But nobody had questioned banks’ liquidity until Mnuchin’s amateurish intervention.

Compared with the Goldman colleagues who preceded him, this betrayed the absence of a deft touch, and briefly raised more concerns than it settled. But it reflected the attention this administration pays to any substantive moves in equities.

President Clinton’s former campaign manager, James Carville, once commented that in his next life, “…I would like to come back as the bond market. You can intimidate everybody.” He also coined “The economy, stupid.” This phrase came to symbolize Clinton’s campaign singular focus and its improbable victory over George H. W. Bush.

GDP reports are too slow in providing feedback, so movements in the Dow offer more immediate information. Given the Tweets that follow when it reaches milestones (even if those milestones have been reached before), you can assume Trump badly wants to brag about the market going into next year’s election. Policies that are good for the economy must be good for stocks; therefore, when the Dow signals dismay, it’s likely to draw a reaction.

That doesn’t guarantee economic policies that will support stocks – the trade frictions with China are an example. But it does mean that there’s limited overall tolerance for pursuing policies that damage the market. The federal government shutdown lasted longer than expected.  It quickly ended, without the wall that was its purpose, once a major airport had to shut because of missing air traffic controllers. This likely won’t be repeated, and emergency action to build the wall will be tied up in the courts where it’ll be symbolic and harmless.

Trade friction is taking its toll. U.S. objectives are broad but not specific. We are approaching March 2nd, when the U.S. is set to impose additional import taxes on $200 billion of Chinese exports. As the deadline nears, expect Trump to find a way to claim victory and avoid the inevitable market swoon that would otherwise follow.

For years, the ‘Greenspan Put’ provided investors some comfort that the Fed would rescue them from economic weakness. Much of what moves stocks today emanates in Washington DC. As attention turns to the next presidential election, equity investors are likely to see the ‘Trump Put’ become the ultimate arbiter of what is administration policy.

SL Advisors is the sub-advisor to the Catalyst MLP & Infrastructure Fund.  To learn more about the Fund,  please click here.

SL Advisors is also the advisor to an ETF (USAIETF.com).


American Energy Independence is Imminent

The U.S. Energy Information Administration (EIA) recently published their 2019 Annual Energy Outlook. Whenever your optimism on the prospects for U.S. energy infrastructure waivers, this will restore your confidence. The outlook for domestic energy production is bullish, and in many cases more so than a year ago.

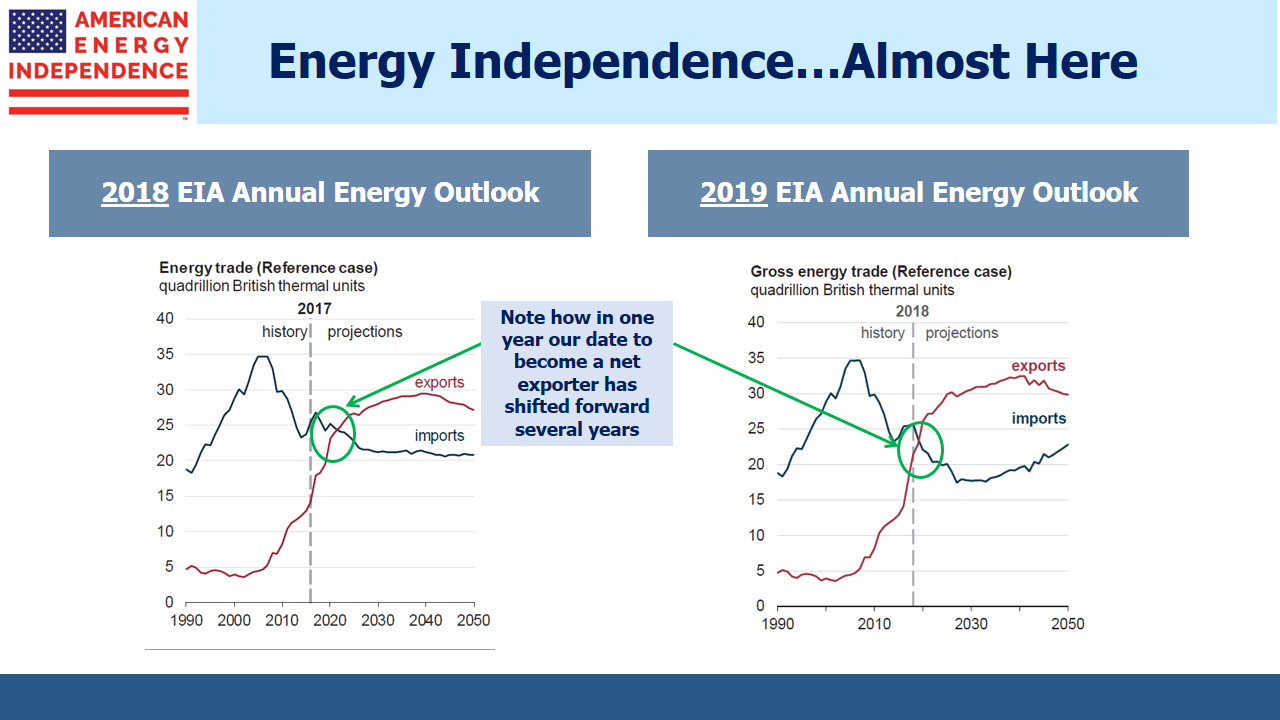
For example, in their 2018 report, the EIA’s Reference Case projected that the U.S. would eventually become a net energy exporter. Now, thanks to stronger crude and liquids production, they expect that milestone to be reached next year.

.avia-image-container.av-3fzgtv2-bc4670092f932905c3ecbdd9d84565b2 img.avia_image{ box-shadow:none; } .avia-image-container.av-3fzgtv2-bc4670092f932905c3ecbdd9d84565b2 .av-image-caption-overlay-center{ color:#ffffff; }

EIA Annual Energy Forecast 2018 vs 2019

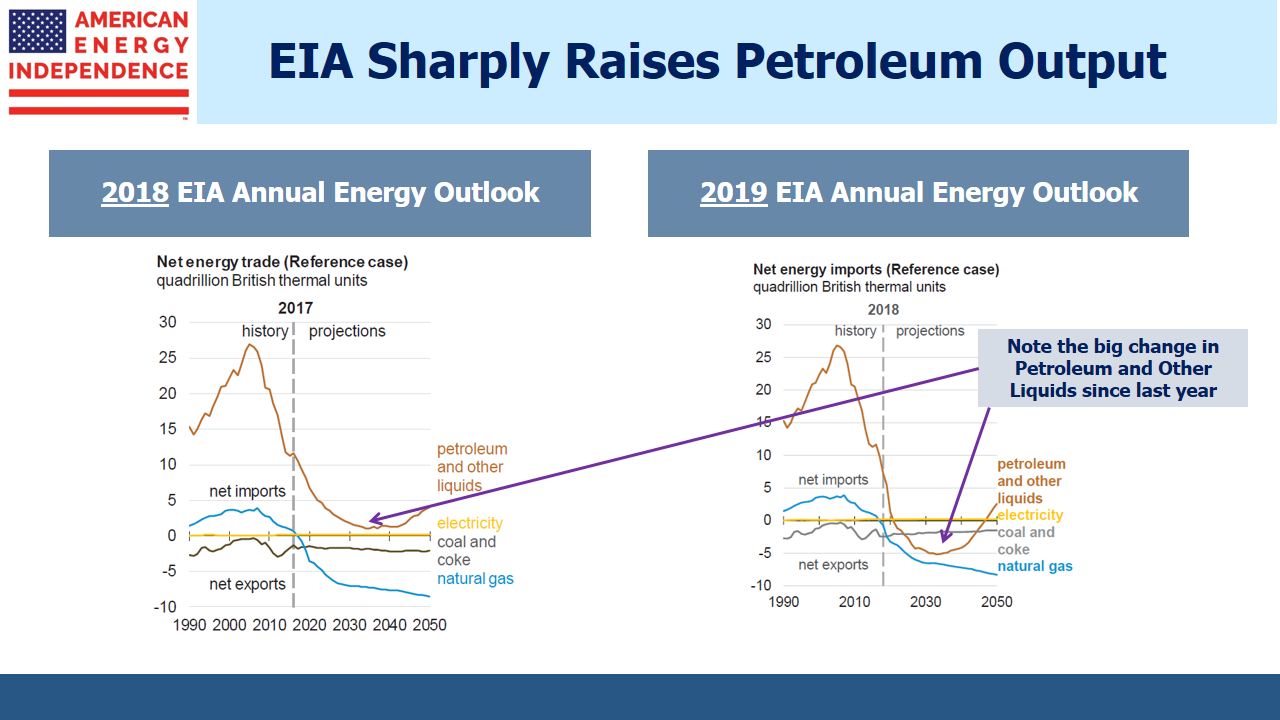
The expected improvement in America’s balance of trade in liquids is dramatic, especially compared with last year’s report. It’s equivalent to an additional 2.5-3.0 Million Barrels per Day (MMB/D) of output.

.avia-image-container.av-2ymstym-8e8810e82ed4f6768fe3723b5381027c img.avia_image{ box-shadow:none; } .avia-image-container.av-2ymstym-8e8810e82ed4f6768fe3723b5381027c .av-image-caption-overlay-center{ color:#ffffff; }

EIA Net Energy Trade 2018 vs 2019

.avia-image-container.av-2eywfou-053167e4f6eb74fba890e080f1c72415 img.avia_image{ box-shadow:none; } .avia-image-container.av-2eywfou-053167e4f6eb74fba890e080f1c72415 .av-image-caption-overlay-center{ color:#ffffff; }

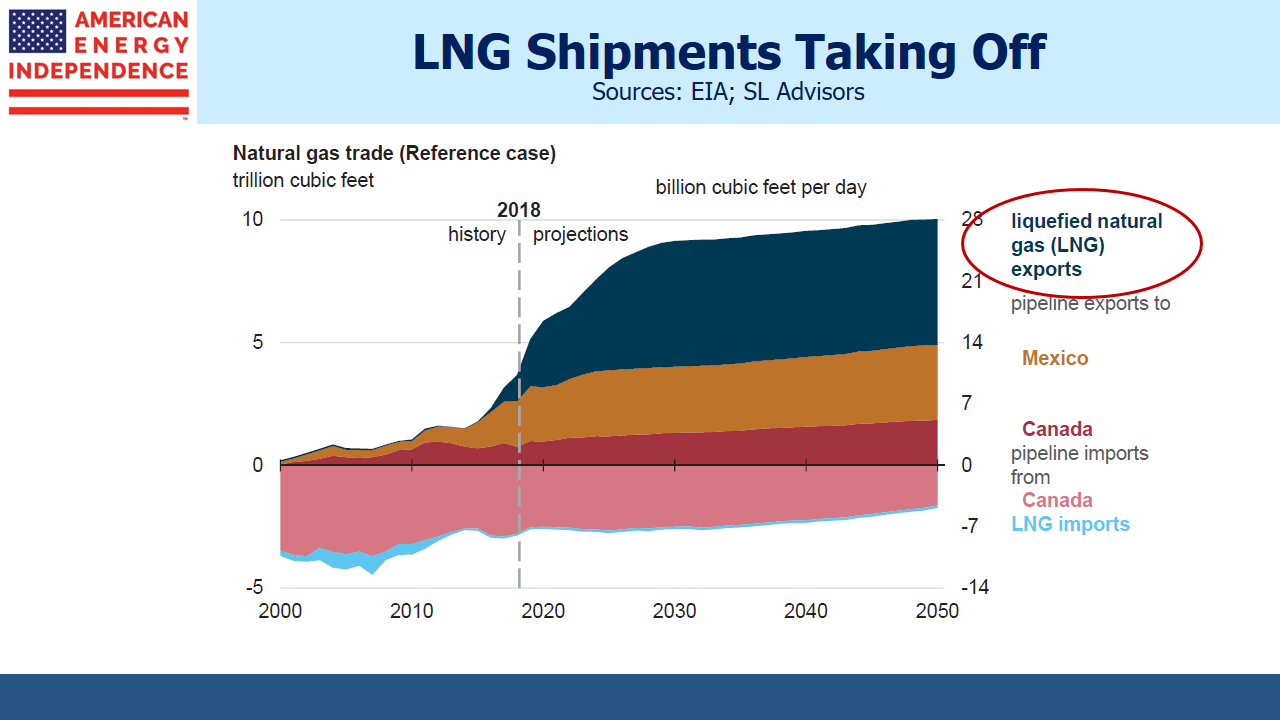
EIA LNG Projections

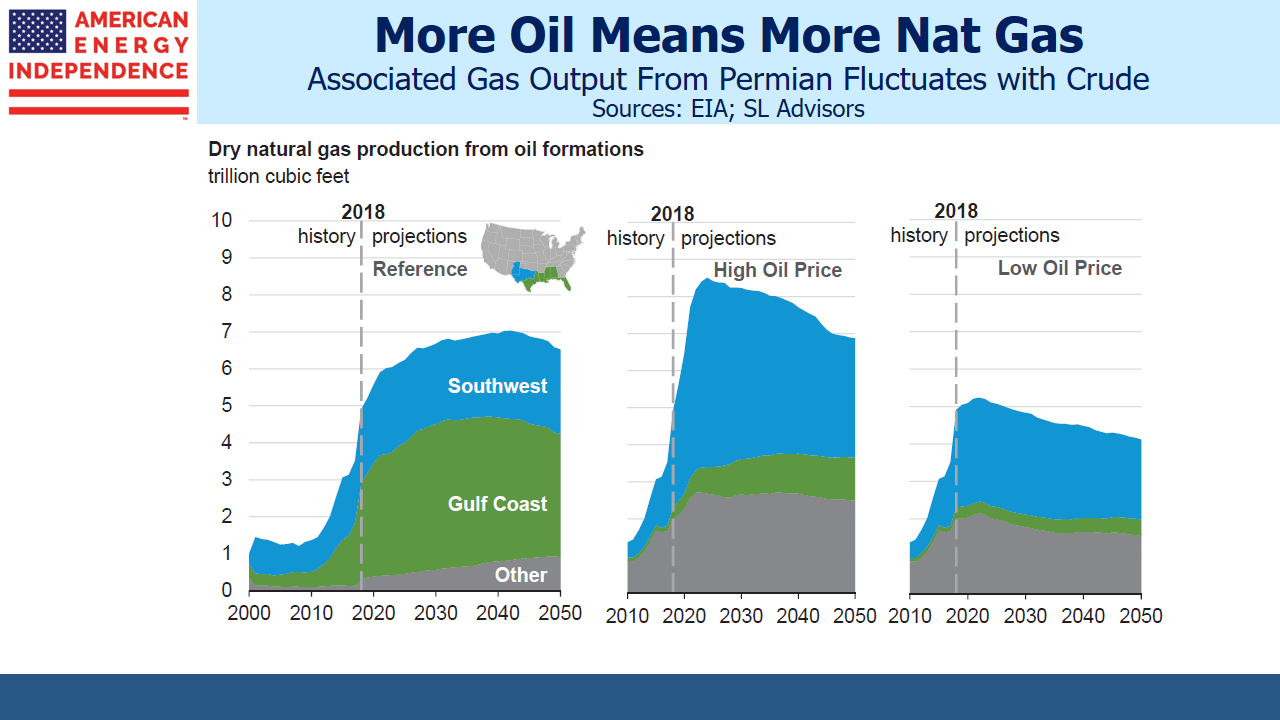
Liquified Natural Gas (LNG) exports are also set to jump sharply, and overall natural gas exports are projected to more than double over the next decade. This is driven by growing Permian crude output, which comes with natural gas as an associated product from oil wells. It’s why flaring is common today, because the needed takeaway infrastructure for natural gas remains insufficient. Mexico’s own infrastructure to import natural gas for electricity generation is still being developed, and new LNG export facilities will provide further demand.

The middle chart in the panel below highlights the correlation of natural gas output with the price of crude oil. This is because the EIA assumes that higher crude prices will stimulate more Permian oil production, producing more associated natural gas.

.avia-image-container.av-1zdre1a-ee7b84fb24d66076c8087c17c54e6294 img.avia_image{ box-shadow:none; } .avia-image-container.av-1zdre1a-ee7b84fb24d66076c8087c17c54e6294 .av-image-caption-overlay-center{ color:#ffffff; }

EIA Associated Natural Gas Production

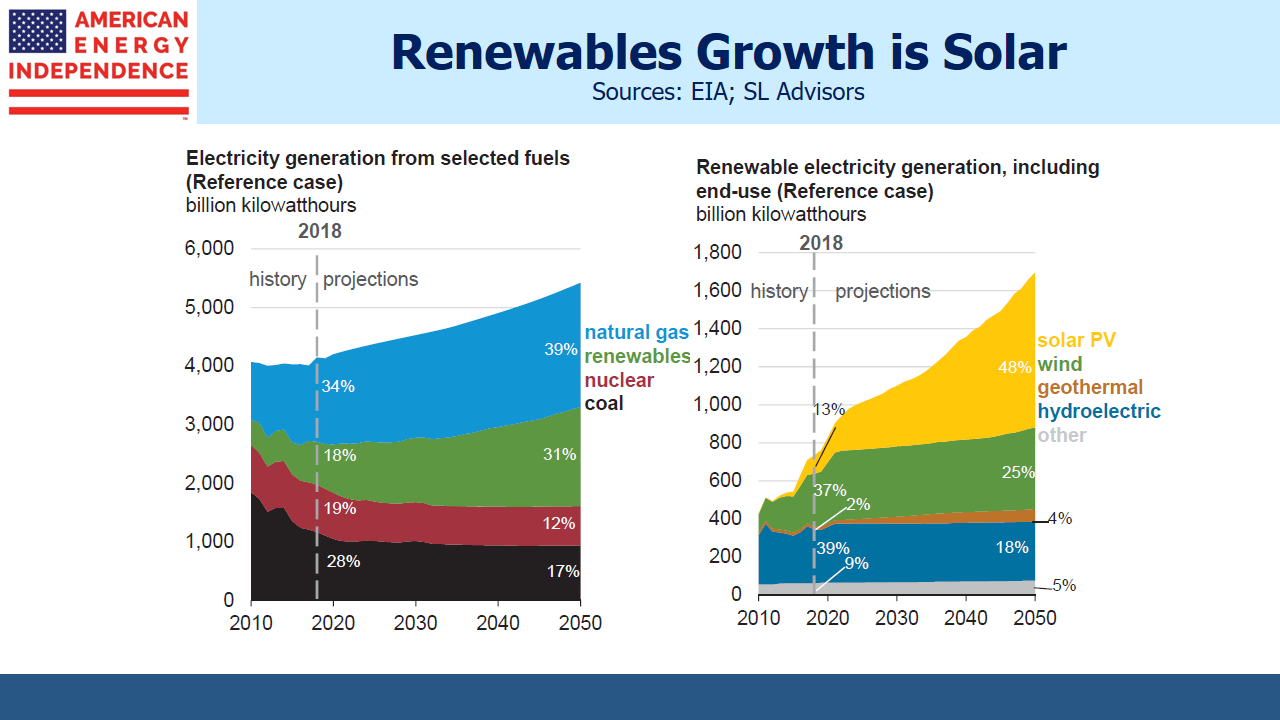
Although use of renewables to generate electricity will grow, they’re still expected to provide less than one third of all electricity even in 30 years. Almost all the growth will be in solar, which works best in southern states that receive more sun. Although my state, New Jersey, is subsidizing residential solar roof panels, they’re not much use in winter. This is especially so because electricity demand generally peaks twice a day, around breakfast and dinner, when people are leaving for work/school or returning home. At this time of year in the northeast, it’s dark during both peak periods. Only half the days are even partly sunny, with cloud cover rendering solar ineffective on the rest.

Moreover, the bucolic, leafy suburbs enjoy plenty of summer shade which can also block the sun from reaching solar panels. Widespread deployment of solar will require cutting down some big old trees that impede southern exposure.

.avia-image-container.av-1pftl5a-8ff150c5aa37c3ce319aa4fb102ae1e7 img.avia_image{ box-shadow:none; } .avia-image-container.av-1pftl5a-8ff150c5aa37c3ce319aa4fb102ae1e7 .av-image-caption-overlay-center{ color:#ffffff; }

EIA Renewables Growth

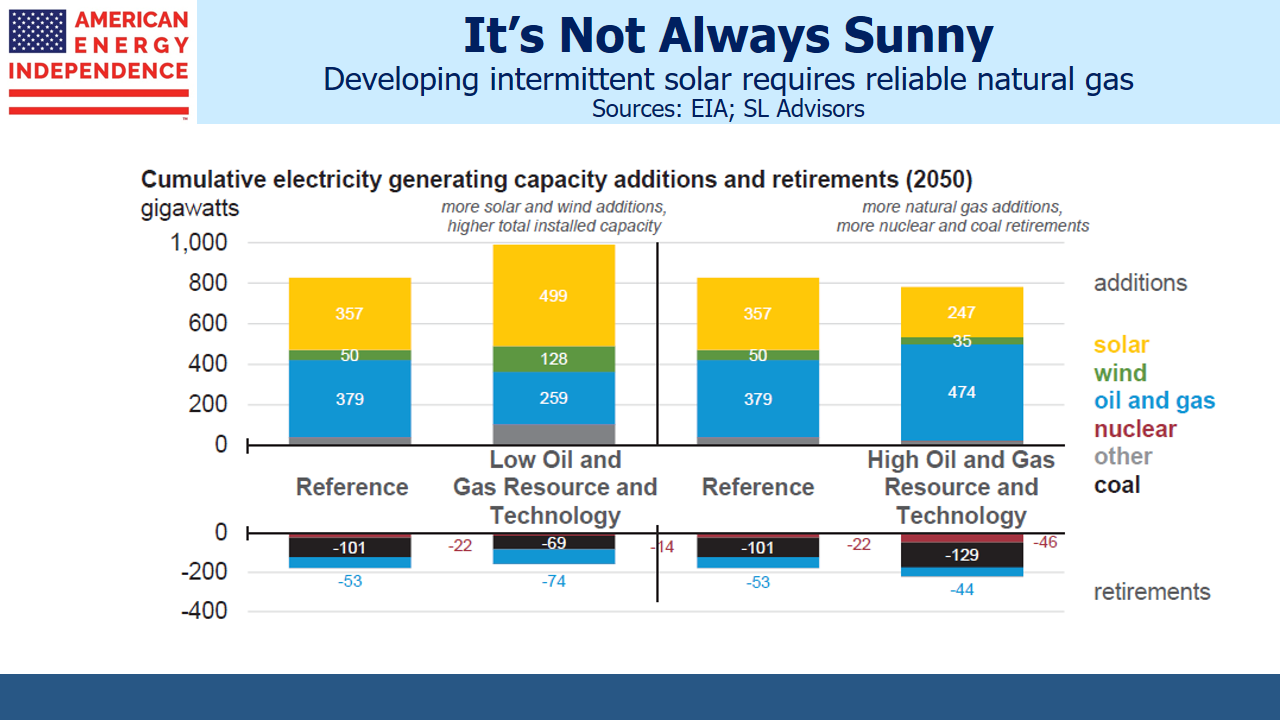
Large-scale battery technology doesn’t exist to store midday solar power for use at peak times Therefore, intermittent sources of power (also including wind) require substantial excess capacity, as well as baseload power that’s always available. Environmental activists haven’t all accepted this yet, but natural gas remains the big enabler for increased solar power.

Some extremists desire a carbon-free world, but that Utopian objective ignores the symbiotic relationship natural gas and solar/wind share. They’re complimentary energy sources. Opposing all fossil fuels impedes the growth of intermittent energy sources and forces more excess, redundant capacity. The Sierra Club and those who share their views seek impractical, purist solutions that will struggle both economically and politically.

.avia-image-container.av-12unr4e-8bde7cf97f0e8d1b6d8480008d9b29a8 img.avia_image{ box-shadow:none; } .avia-image-container.av-12unr4e-8bde7cf97f0e8d1b6d8480008d9b29a8 .av-image-caption-overlay-center{ color:#ffffff; }

Intermittent Solar Needs More Natural Gas

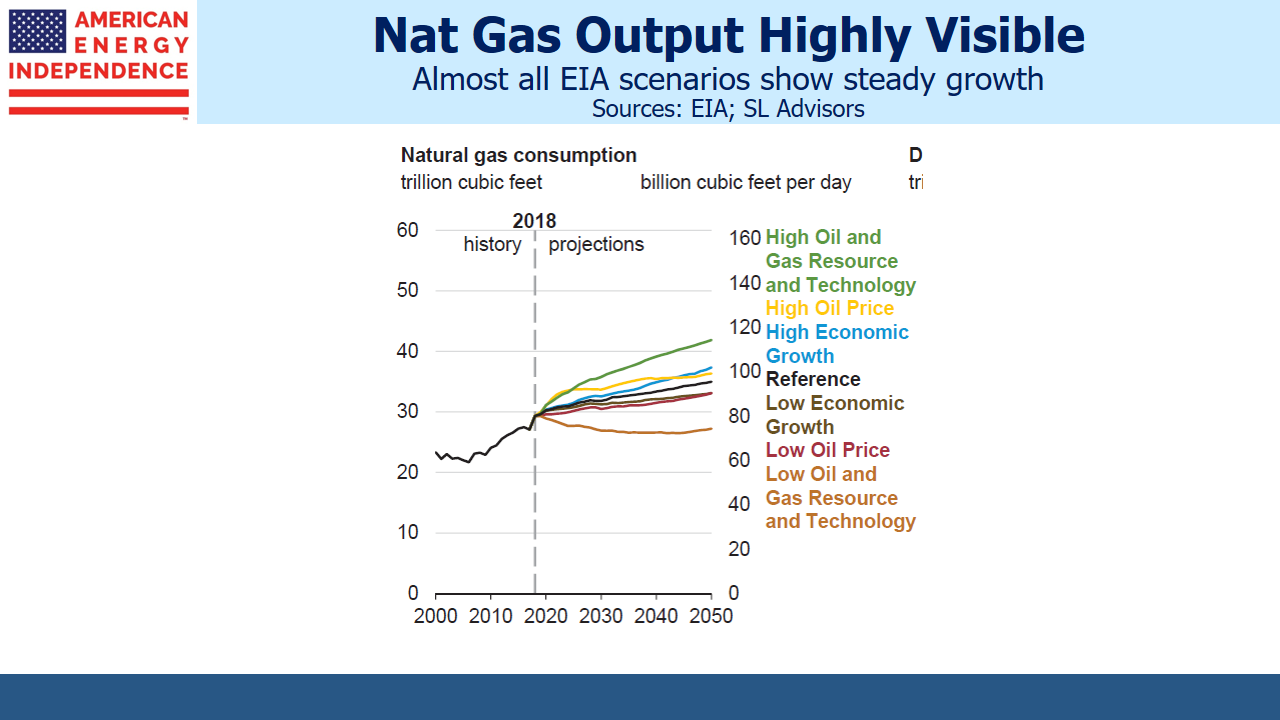
Natural gas is in many ways a bigger U.S. success story than crude oil. Its abundance ensures continues low prices, supporting both exports as well as cheaper domestic electricity than most OECD nations. Because the U.S. has some of the lowest-priced natural gas, different scenarios nonetheless offer fairly uniform growth in output. Natural gas prices are less susceptible to the cycles of crude oil, which combined with America’s advantages noted above makes investing in its infrastructure more attractive.

.avia-image-container.av-kjiram-8c99aa761200776088aa154019e7f71f img.avia_image{ box-shadow:none; } .avia-image-container.av-kjiram-8c99aa761200776088aa154019e7f71f .av-image-caption-overlay-center{ color:#ffffff; }

EIA Steady Rise in Natural Gas Production

There’s plenty in the EIA’s 2019 Outlook to support a bullish view for midstream energy infrastructure. Financing growth projects has weighed on stock prices for several years, leaving investors frustrated and complaining about insufficient cash returns. But if the peak in growth capex peak is behind us, as looks likely, free cash flow and payouts should start increasing again. Cash flow yields on the sector average 12% before growth capex. This is analogous to the funds from operations metric used in real estate, but double the yield on the Vanguard Real Estate ETF (VNQ), for example. REIT investors should take note.

SL Advisors is the sub-advisor to the Catalyst MLP & Infrastructure Fund.  To learn more about the Fund,  please click here.

SL Advisors is also the advisor to an ETF (USAIETF.com).


Problems Made in DC Can Be Fixed There

.avia-image-container.av-iqg2v0-7b91cc8a5f6c28c77a80ec39710ad00f img.avia_image{ box-shadow:none; } .avia-image-container.av-iqg2v0-7b91cc8a5f6c28c77a80ec39710ad00f .av-image-caption-overlay-center{ color:#ffffff; }

The Federal Government is Moving Markets

The Federal government has been moving markets of late.

Venezuela is the latest issue to watch. The U.S. is currently aligned with most of the world in seeking the overthrow of leader Nicolas Maduro. The sanctions look significant, with almost all Venezuela’s hard currency coming from oil exports, half of which go to the U.S. Finding new buyers won’t be easy, because even non-U.S. buyers will be wary of transacting through the U.S. financial system, potentially violating U.S. law.

In addition, Venezuela’s exceptionally heavy, viscous crude requires blending with condensate before it can be shipped. That condensate is imported from the U.S., so Venezuela will also need to find alternative supplies. So far, global oil markets have reacted calmly to the possible loss of Venezuelan crude, partly because years of inept management have reduced production to around 1 million barrels a day (MMB/D). Six years ago it was as high as 2.5 MMB/D. However events play out, it’s unlikely to be bad for the U.S. given our rapidly growing oil production.

Last year’s corporate tax cuts propelled the S&P500 to a 22% return in 2017, as markets anticipated the jump in profits. Like the prior year’s gains, the slump in December was also made in DC, resulting in a 4.4% loss for 2018. Tariffs (i.e. import taxes) imposed somewhat capriciously, and the unresolved trade negotiations with China led to a slowdown in Chinese GDP growth as well as downward revisions to corporate profits. This was followed by White House complaints about high interest rates, met with Fed chair Jay Powell’s confusing comments suggesting rates may move much higher. Independence asserted, his comments were soon walked back, although equities responded sharply in the meantime.

Last week the federal government reopened, to widespread relief. Press reports described it as a loss for Trump, which naturally raises the likelihood he’ll reject whatever negotiated compromise Congress presents on February 15th. Markets rallied on the agreement, and later weakened as tweets made clear the dispute over a border wall isn’t yet resolved.

Predicting how each episode is resolved isn’t easy, which makes a defensive posture attractive. The confusion over interest rate policy has sorted itself out, with the Fed likely on hold for now. However, the disagreement over the wall that shut the government for 35 days may burst open again.

But it turns out that the President isn’t Emperor, and Congress has different powers that are intended to give it equal status. Although Trump will complain, Republicans are unlikely to have much stomach for a second federal government shutdown. This might leave the president turning to emergency powers to erect a physical barrier. That’ll be held up by challenges from Congress, or in the courts, or both. For the equity investor, there’s good reason to assume that this stand-off has lost its ability to move markets.

On trade, the negotiations with China drag on interminably. But unlike the wall, there’s no promised tangible objective. So the White House could at any time decide it wants some positive press and accept whatever China is offering, claiming victory.

This is the risk with not holding equities because of current uncertainties. The problems are all made in Washington, which means they’re easily fixed there. Don’t be surprised to see the budget stand-off and China both recede as concerns. With interest rates on hold and S&P500 2019 earnings growth of 6.5%, the market’s P/E is 15.3. Equities remain a far better bet than bonds.

SL Advisors is the sub-advisor to the Catalyst MLP & Infrastructure Fund.  To learn more about the Fund,  please click here.

SL Advisors is also the advisor to an ETF (USAIETF.com).


MLP-Dedicated Funds See Increasing Redemptions

Fund flows will always beat fundamentals. This was rarely more evident than in the performance of MLPs last year. Throughout 2018, earnings reports from pipeline companies were generally in-line, with positive guidance. Operating results contrasted with stock prices, which confounded investors and management teams as they sagged. Negative sentiment worsened late in the year, not helped by broader market weakness caused by trade friction, Fed communication mis-steps and the Federal government shutdown.

JPMorgan calculates that there is $38BN invested in open-ended MLP and energy infrastructure products, across ETFs, mutual funds and exchange traded notes. In spite of peaking in August 2014, the sector saw inflows during the three subsequent years. This reversed dramatically late last year, as retail investors liquidated holdings. November and December saw $1.9BN in net outflows, enough to depress prices regardless of news.

.avia-image-container.av-tygtya-85cf6151549522e3ef8b31a741f4f945 img.avia_image{ box-shadow:none; } .avia-image-container.av-tygtya-85cf6151549522e3ef8b31a741f4f945 .av-image-caption-overlay-center{ color:#ffffff; }

Energy Infrastructure 5 Years of Inflows

.avia-image-container.av-1mdz402-24509c70cdd110fc7d66e3496f6ea37d img.avia_image{ box-shadow:none; } .avia-image-container.av-1mdz402-24509c70cdd110fc7d66e3496f6ea37d .av-image-caption-overlay-center{ color:#ffffff; }

Energy Infrastructure Q418 Fund Outflows

Looking back over several years, the period looks like a selling climax, with no similar episodes visible.

Conversations with redeeming investors revealed many unwilling sellers. Taking tax losses motivated some, while others confessed to exhaustion with poor stock returns in spite of apparently improving fundamentals. Like all money managers in the sector, we were faced with little choice but to sell on behalf of such clients.

Interestingly, MLP-dedicated funds received a disproportionate share of redemptions. This makes sense, given their flawed tax structure (see MLP Funds Made for Uncle Sam). The drag from paying corporate taxes on profits has been substantial in past years of good performance.

.avia-image-container.av-jgcfnm-fb78523e26d4c3ad803a4eb6d963c340 img.avia_image{ box-shadow:none; } .avia-image-container.av-jgcfnm-fb78523e26d4c3ad803a4eb6d963c340 .av-image-caption-overlay-center{ color:#ffffff; }

MLP Dedicated Fund Outflows

Hinds Howard of CBRE Clarion Securities recently noted that, “MLPs are less than half of the market cap of North American Midstream, and the number of MLPs continues to shrink.  This is ultimately a good thing for those public players that remain, who will achieve greater scale and competitive bargaining power.” Many big pipeline operators are corporations, so an MLP-only focus makes less sense because it omits many of the biggest operators.

Howard went on to add that, “…it has significant ramifications for the asset managers with funds designed specifically to invest in MLPs.” This is because such funds are faced with an unenviable choice between sticking with a shrinking portion of the overall energy infrastructure sector, or dumping most of their MLPs in order to convert to a RIC-compliant status (see The Uncertain Future of MLP-Dedicated Funds). These are additional marketing headwinds on top of last year’s weak returns.

2018 fund flows suggest that investors in MLP-only funds are beginning to realize this problem, and are acting accordingly. The biggest such funds saw $2.6BN in net outflows during 2018’s latter half, 88% of the total, although they only represent 55% of the sector’s funds. Investors redeemed from tax-burdened MLP funds at almost twice the rate of the overall sector.

Many feel the sector is due a good year, and if it is, corporate taxes will lead to correspondingly high expense ratios for MLP-focused funds.

.avia-image-container.av-trdruq-23b629b72a68f31091b1c1193873f042 img.avia_image{ box-shadow:none; } .avia-image-container.av-trdruq-23b629b72a68f31091b1c1193873f042 .av-image-caption-overlay-center{ color:#ffffff; }

Energy Infrastructure Open Ended Fund Flows

Early signs in 2019 are encouraging. The outflows abruptly ended at year-end, and investors we talk to are turning more positive. Strong January performance has helped. From where we sit, inflows dominate and new investor interest has increased sharply. Valuations remain very attractive, with distributable cash flow yields of 11%. We expect dividend growth in the American Energy Independence Index of 7-10% this year and next. Momentum seems to be turning.

We are short AMLP.

SL Advisors is the sub-advisor to the Catalyst MLP & Infrastructure Fund.  To learn more about the Fund,  please click here.

SL Advisors is also the advisor to an ETF (USAIETF.com).


The Value in Listening to Bears

Short sellers are a breed apart. Because they’re going against the trend, and numerous stakeholders, they possess a tenacity and conviction that can be breathtaking. When I was investing in hedge funds at JPMorgan, I especially enjoyed meeting with bearish managers. For a start, they do some of the best research. And while a long position might require only modest upside to justify its inclusion, shorts are often believed to be fraudulent, or to have fatally flawed business models. A short seller’s pitch has passion laced with a paranoid suspicion of authority, financial statements and basic human goodness. It can be exhilarating to hear such well-constructed certainty that much you believe right in the world is wrong. These people are fearless, the ones you’d want with you in that foxhole.

In The Hedge Fund Mirage I recount meeting with short-seller Marc Cohodes, who was convinced that men’s clothing store Joseph A Banks was misreporting its financials and would soon collapse. He brandished ads offering “Buy One Suit, Get Two Free” as evidence of an unsustainable promotional strategy. That was over fifteen years ago, and they’re still in business. Examples of such bets gone awry are easily found. For a while, Marc Cohodes was disillusioned with the business (see A Hedge Fund Manager Finds More to Like in Farming), but has since returned (see The World According to a Free-Range Short Seller With Nothing to Lose).

Conversations with hedge fund managers are rarely boring, but they’re especially absorbing when discussing short positions. The depth of research and unshakeable conviction are awe-inspiring. Even though many are wrong, the notion that an apparently successful company is really a house of cards remains riveting.

Nonetheless, shorting profitably is harder than making money on long positions. Almost everyone else involved wants the stock to rise, and because short positions grow when they’re moving against the short seller and shrink when the price is declining, they’re harder to manage. I often used to ask hedge fund managers why they bothered shorting stocks at all, instead of simply shorting index futures and investing all their effort in long ideas. I never received a satisfactory answer – when companies or sectors do collapse, such as Enron, sub-prime mortgages, Lehman Brothers or Valeant, those who called it draw immense satisfaction, media accolades and more clients.

Some of it is marketing. Investing is one of the few areas where delivering a product (i.e. investment returns) that are inferior (i.e. lower) than others can still be valuable, if the returns are uncorrelated. Holding something that will reliably zig when others zag is better than holding cash in a bear market. There’s a chronic shortage of such opportunities. Short-seller Jim Chanos has cleverly exploited this with a performance fee on his hedge fund that’s calculated based on the inverse S&P500 return. So if the market is up 20%, anything he delivers that is better than down 20% draws an incentive fee, on the basis that improving on a simple 100% short index futures position is worthwhile. In a rising market, even holding treasury bills with this fee structure can be profitable.

The Economist recently profiled Soc Gen’s strategist Albert Edwards, a “steadfast prophet of gloom”. Edwards might be described as a “permabear”, constantly regarding the glass as half empty. The appeal of such thinking is that, while investing is built on a cautiously optimistic worldview, considering a contrary opinion is stimulating and can engender protective wariness. We’ve endured a two year bear market in energy infrastructure that just possibly ended last month. We often find the more interesting conversations are with investors who have avoided energy entirely. They clearly assessed the sector differently. When the uninvested become bullish, as some are, higher prices soon follow.

The Economist said of Albert Edwards, “…his talent for imagining the worst is valuable. If you have a vague anxiety, Albert will give it form.” Edwards has been calling out excessive leverage, ruinously low interest rates and China’s precarious GDP growth for years. He’s been wrong on all three, but the strategist almost never runs out of time because, unlike a hedge fund manager, he doesn’t run out of other people’s money with which to bet.

James Grant, founder of Grant’s Interest Rate Observer, retains a loyal following. His writing flows effortlessly off the page, both stimulating and entertaining the reader. It’s as well he possesses such talent, because his relentlessly bearish views on bonds during a career-length, secular bull market have only been tolerable because of their erudite wrapping. Grant’s career as a money manager would have been brief; he has made sensible choices.

.avia-image-container.av-wmsrm4-e99a768cb41cca3775615452c80fdba5 img.avia_image{ box-shadow:none; } .avia-image-container.av-wmsrm4-e99a768cb41cca3775615452c80fdba5 .av-image-caption-overlay-center{ color:#ffffff; }

The Bears are Roaring

Albert Edwards is well known among European clients of Soc Gen for predicting the break-up of the Euro. In 2010 he criticized the Greek bailout as delaying the inevitable. Today he cites weak Italian productivity as a growing source of instability. Since Italy is “locked in the Eurozone”, its “effective exchange goes up because its labor costs are rising.”

The Euro is arguably behind Brexit – by staying out of the Euro, Britain’s economy grew faster. This attracted more east Europeans seeking jobs and contributed to politically unacceptable levels of immigration, fueling populist outrage and the vote to leave the EU.

In the 1990s a trader working for me insisted that the Euro (then not yet formed) was a failed concept that would never be realized. Unlike Soc Gen’s Edwards, this trader did run out of money to maintain losing bets against currency convergence in the Euro’s run-up. I spent too much time with him listening to why the proposed single currency was a bad idea destined to fail.  In recent years, I’ve often thought I should send a plastic bag of Euros to his home in Florida.

Albert Edwards has sensibly avoided the constraining allure of managing money, which is why he can still challenge us to contemplate the unthinkable. Along with a break-up of the Euro, he’s predicting a U.S. recession and an “unraveling in China.”

These are not consensus views, and not our forecast either. But the attraction of bears is to get you thinking about surprises. Import taxes (i.e. tariffs) and the continuing Federal government shutdown are not conducive to strong U.S. growth. Both are easily fixed in Washington, but while they’re not, the risks of an economic slowdown rise. It’s why bearish views are gaining attention.

SL Advisors is the sub-advisor to the Catalyst MLP & Infrastructure Fund.  To learn more about the Fund,  please click here.

SL Advisors is also the advisor to an ETF (USAIETF.com).