A Good Week For The Fed

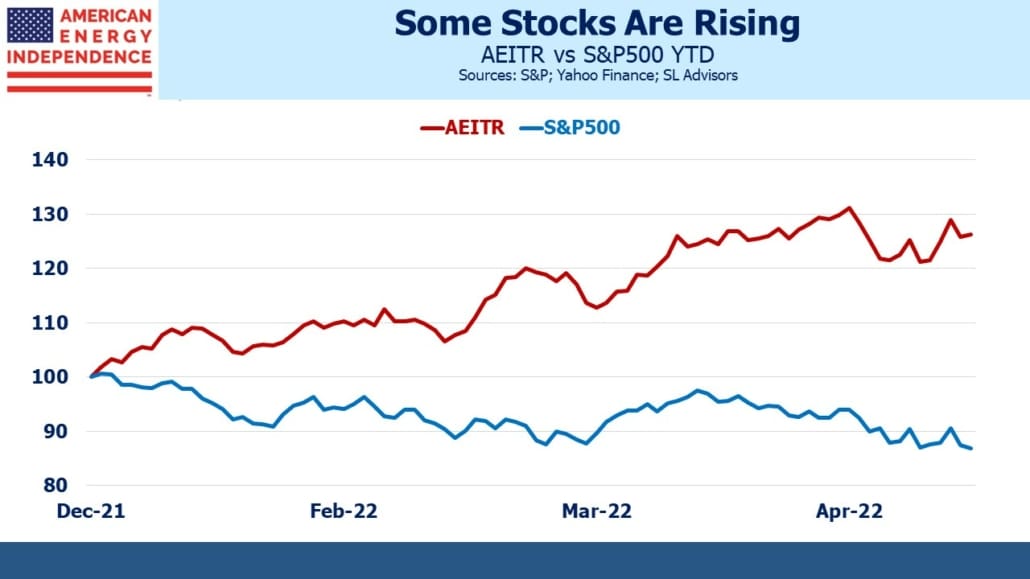
Financial advisors probably feel that they’re more than earning their pay recently. Market volatility is high, which means clients want to know what’s going on. Advisors have in the past confided to me that one of their most important roles is to persuade clients from selling impetuously. Their original asset allocation was made after much careful consideration and ought not to be tinkered with just because the market’s moved a bit. Friday’s rally helped, but the S&P500 is still -15% for the year. If you have energy exposure, you’ll have done better.

Global stocks registered their sixth straight weekly decline, the longest streak since 2008. This is a testing environment for financial advisors.

By contrast, Fed chair Jay Powell can look back at the ten days following the last FOMC meeting, 0.50% rate hike and press conference with some satisfaction. Investors won’t hear it said this way but engineering an orderly fall in stock prices is one of the Fed’s goals. Former NY Fed president Bill Dudley, no longer burdened by the requirement to speak responsibly as a senior Fed official, has warned that the Fed’s going to tighten financial conditions enough to push up the unemployment rate (see Criticism Of The Fed Goes Mainstream).

.avia-image-container.av-2i18854-e9bfee03df3ece19ecee9edb9c91d4b6 img.avia_image{ box-shadow:none; } .avia-image-container.av-2i18854-e9bfee03df3ece19ecee9edb9c91d4b6 .av-image-caption-overlay-center{ color:#ffffff; }

The Fed’s reinterpreted mandate places greater importance on achieving maximum employment. Powell hasn’t offered any warnings that unemployment needs to rise. In a fascinating excerpt from his press conference, he noted that job openings were equal to almost twice the number of unemployed, and said they were trying to reduce this imbalance. A perfect outcome for the Fed would see a drop in job openings without a commensurate increase in unemployment, making possible the vaunted “soft landing”.

.avia-image-container.av-2aaw2u0-7abbd9ea8a169b49d1a2fe083aec9574 img.avia_image{ box-shadow:none; } .avia-image-container.av-2aaw2u0-7abbd9ea8a169b49d1a2fe083aec9574 .av-image-caption-overlay-center{ color:#ffffff; }

When you also consider the FOMC’s Summary of Economic Projections expecting unemployment to remain at 3.6% through 2024, this is further evidence that they are prioritizing continued full employment. They’ve been criticized for this by Larry Summers among others, because it seems inconsistent with simultaneously reducing inflation to 2.3% over the same time period.

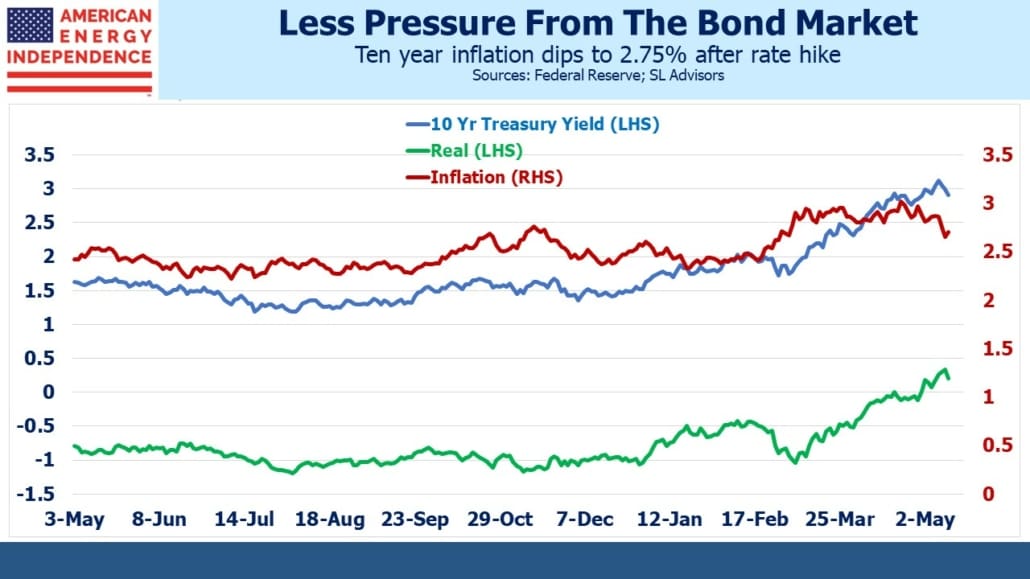
The bond market became a little more convinced that the Fed will pull this off. Although the CPI and PPI reports showed prices continue rising at a fast clip, ten year inflation expectations derived from TIPs dipped to 2.74%, having recently touched 3%. Since CPI, which is the index TIPs follow, typically runs 0.3-0.4% higher than the Fed’s preferred Personal Consumption Expenditures index, they can plausibly conclude that investors are buying the narrative that inflation will return to 2% within a couple of years.

It doesn’t look like a good bet to us. The FOMC is dovish. The disinflationary effects of globalization are petering out. And the US fiscal outlook requires higher inflation so that negative real rates can ease the burden of our growing debt.

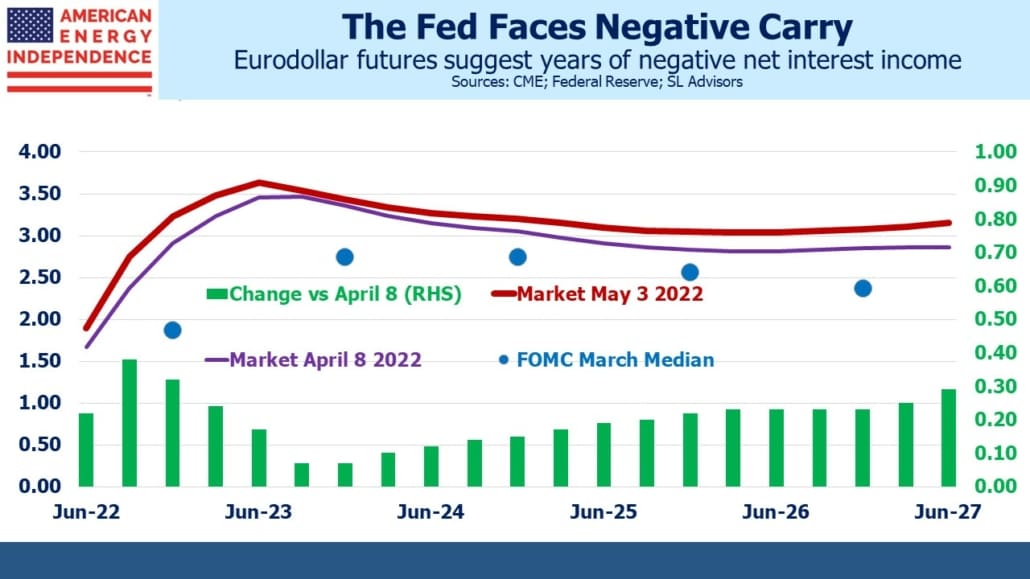
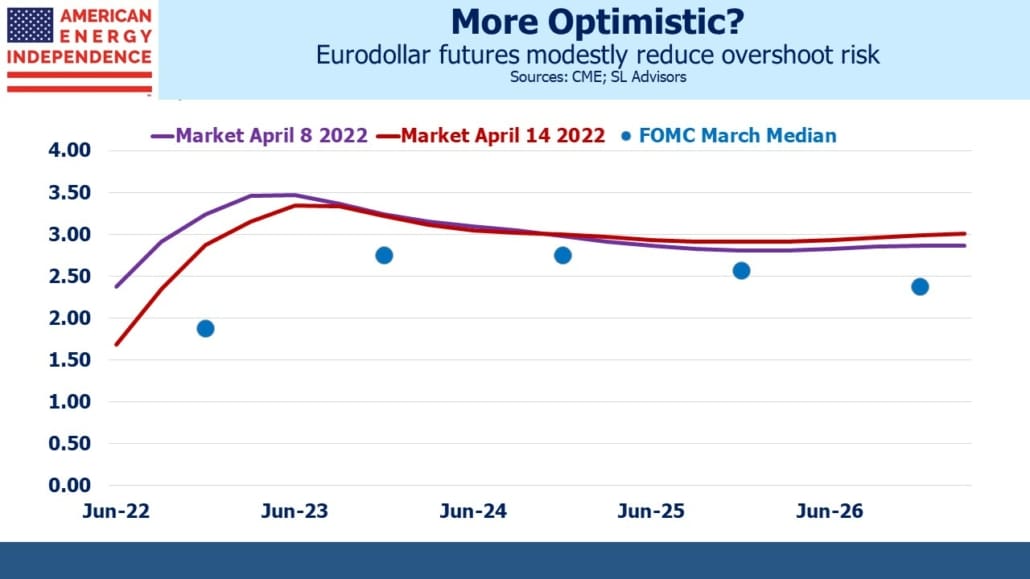
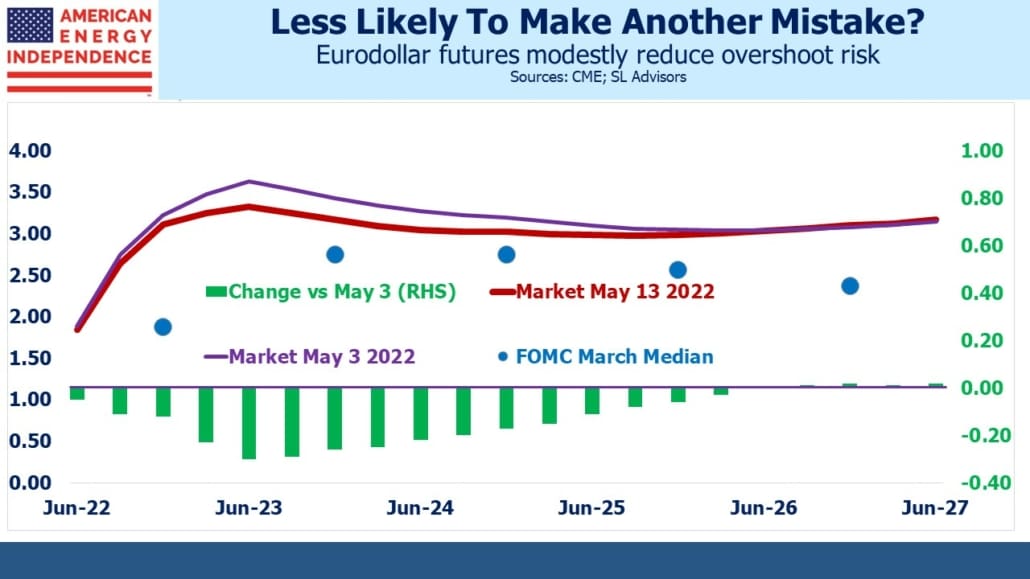
Moderating inflation expectations have caused the twos/tens spread to widen and moderated the inversion that exists in part of the eurodollar futures curve. An inverted yield curve is a forecast from the market of a looming failure of monetary policy, implying an overshoot in tightening that would require it to be reversed.

Hoping that reduced job openings will be sufficient to cool the economy, as Powell seemed to suggest during his press conference, seems wildly optimistic with no historical precedent. Raising rates beyond the 2-3% range the FOMC believes is neutral seems certain to require a pause to assess whether prior hikes are already having an effect.

At his press conference Powell explained, “So what that really means is, to get the kind of labor market we really want to get, we really want to have a labor market that serves all Americans, especially the people in the lower income part of the distribution, especially them.” This is a laudable public policy objective, if a dubious addition to the Fed’s objectives. Monetary policy is notoriously slow and blind to the individuals it impacts. Hence the eurodollar futures curve should be priced for cautious rate hikes next year that lower the odds of requiring a reversal.

.avia-image-container.av-1o7rofs-b21c4494a45d682d075e524c0923c0a2 img.avia_image{ box-shadow:none; } .avia-image-container.av-1o7rofs-b21c4494a45d682d075e524c0923c0a2 .av-image-caption-overlay-center{ color:#ffffff; }

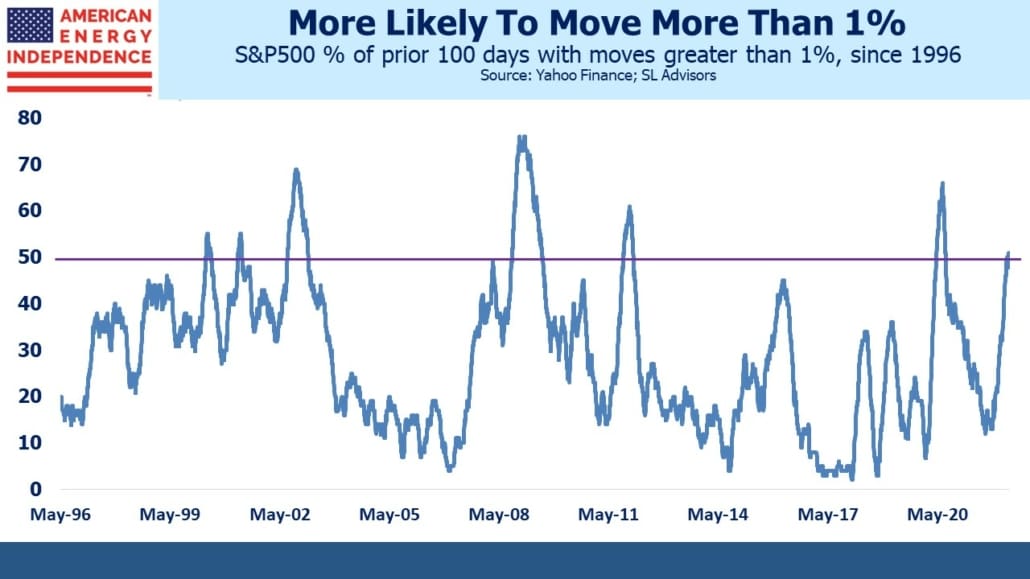
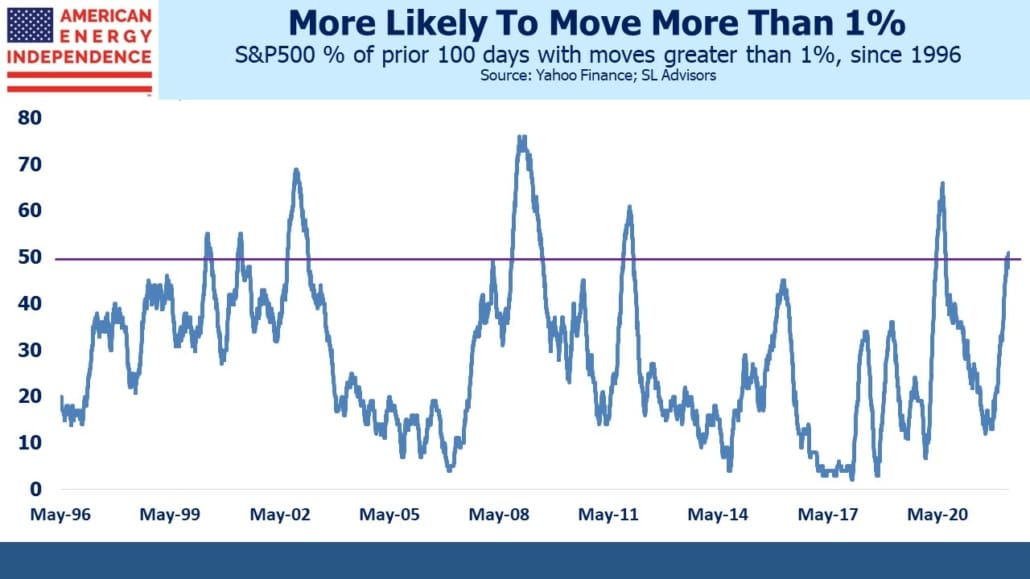
I was chatting with an investor on Friday about the increasing incidence of 1% daily moves in the S&P500. Such moves are now more likely than not based on the past 100 trading days (see Pipelines Are Less Volatile Than You Think). He found it an interesting way to think about volatility, one that’s easily intuitive. Such 100 day regimes have existed only 8% of the time over the past quarter century.

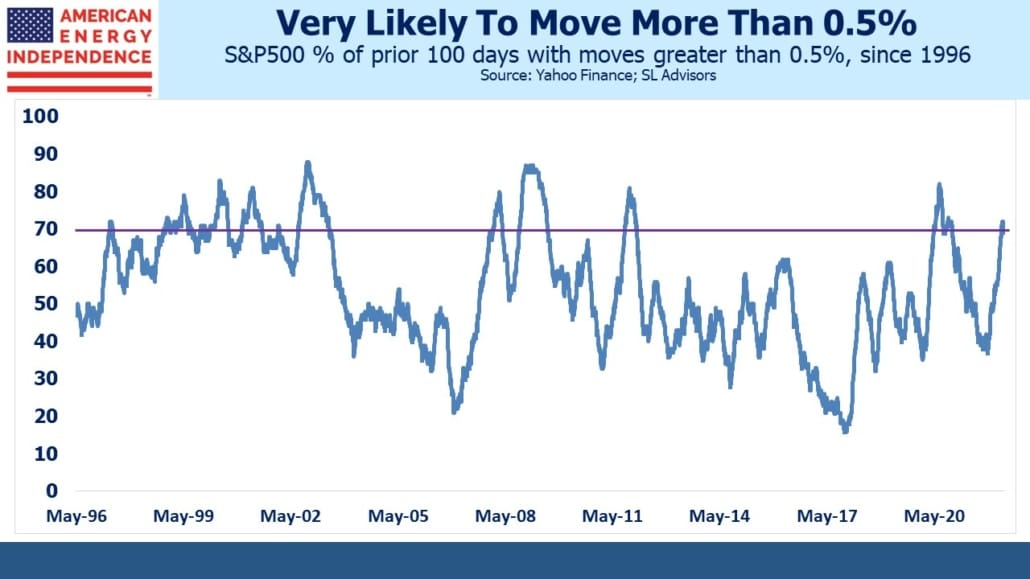
Daily moves greater than 0.5% currently occur 70% of the time. 100 day periods like this have existed less than a fifth of the time.

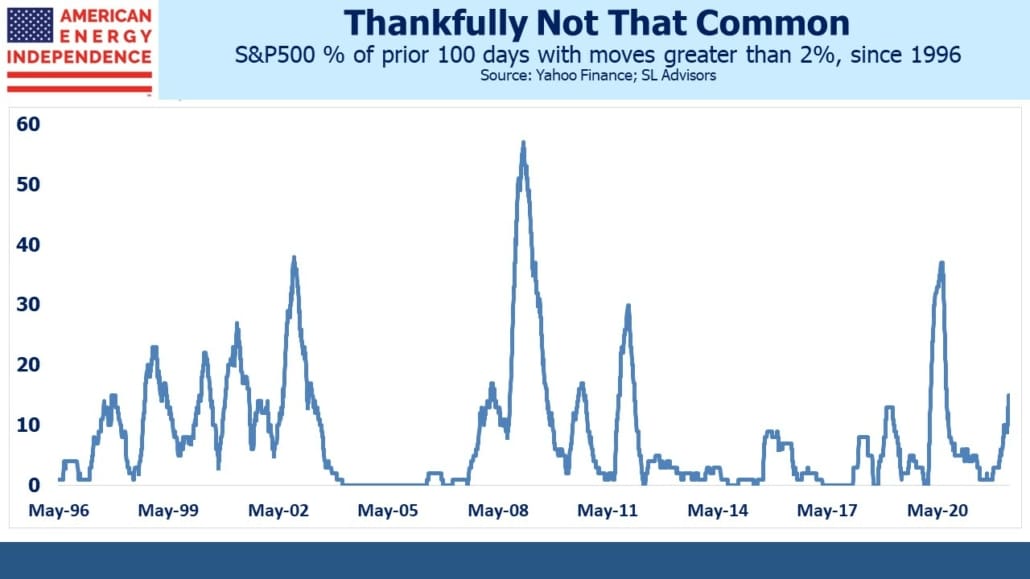
2% daily moves remain uncommon but are creeping up, currently 15% of the last 100 trading days (including the 3.2% drop on Monday 9th).

.avia-image-container.av-1300tmg-2e47400cc4bd5fb7cf7cbbc015286ea5 img.avia_image{ box-shadow:none; } .avia-image-container.av-1300tmg-2e47400cc4bd5fb7cf7cbbc015286ea5 .av-image-caption-overlay-center{ color:#ffffff; }

.avia-image-container.av-pb1wqg-4c5e2321718eace0f549b84d34c91812 img.avia_image{ box-shadow:none; } .avia-image-container.av-pb1wqg-4c5e2321718eace0f549b84d34c91812 .av-image-caption-overlay-center{ color:#ffffff; }

Even if increased volatility doesn’t lead to lower stock prices, it probably tempers exuberant economic activity. The University of Michigan’s consumer sentiment survey registered its lowest reading since 2013, with inflation cited as the biggest area of concern. Long term inflation expectations remained at 3%, slightly above the rate derived from ten year treasury securities.

In sum, lower stock prices, a steepening yield curve and falling long term inflation expectations are a positive grade on the FOMC’s report card. Investors may not feel quite as sanguine after another volatile week, but Jay Powell might permit himself a moment of quiet satisfaction.

We have three funds that seek to profit from this environment:

Energy Mutual Fund

Energy ETF

Inflation Fund

Please see important Legal Disclosures.


Pipelines Are Less Volatile Than You Think

If it feels like the market’s daily swings are giving you whiplash, you’re right. Following Monday’s rout, the number of daily moves in excess of 1% breached 50% over the past hundred days. In other words, a 1% or greater change in the S&P500 is now more likely than not.

This is unusual. Markets were remarkably calm in the second half of last year. Volatility picked up towards year end as it became clear the Fed was way behind in normalizing policy. Nonetheless, such periods are rare. In the last quarter century such regimes have only existed for 8% of the time. Oddly, this doesn’t augur poor returns. For example, in April 2020 market volatility crossed that “more likely than not” threshold and the subsequent one year return was almost 50%.

.avia-image-container.av-1po1jce-85f51ea195346bf0206bd49bc82d5256 img.avia_image{ box-shadow:none; } .avia-image-container.av-1po1jce-85f51ea195346bf0206bd49bc82d5256 .av-image-caption-overlay-center{ color:#ffffff; }

However, it does mean advisors will spend more time discussing the outlook with clients. Inflation, an unexpected war in Europe and China’s vain attempt to stamp out Covid are significant headwinds. Recession risks in Europe are rising too. Germany is scrambling to overcome its reliance on Russian natural gas. They are under increasing pressure to unilaterally stop imports, which would likely plunge Germany into a recession, and partial darkness.

Chancellor Olaf Scholz recently said, “It doesn’t help anyone if the lights go out here. Not us and not Ukraine,” But who really expects Russian gas to keep flowing reliably up until the moment Germany closes Nordstream One? Ending Russian gas supply is likely to be timed to suit Russia not Germany. Russia’s infrastructure precludes quickly rerouting their gas to Asia. A move that’s intended to harm Russia is unlikely to be implemented on Germany’s timeframe. So it’s probably going to be disruptive.

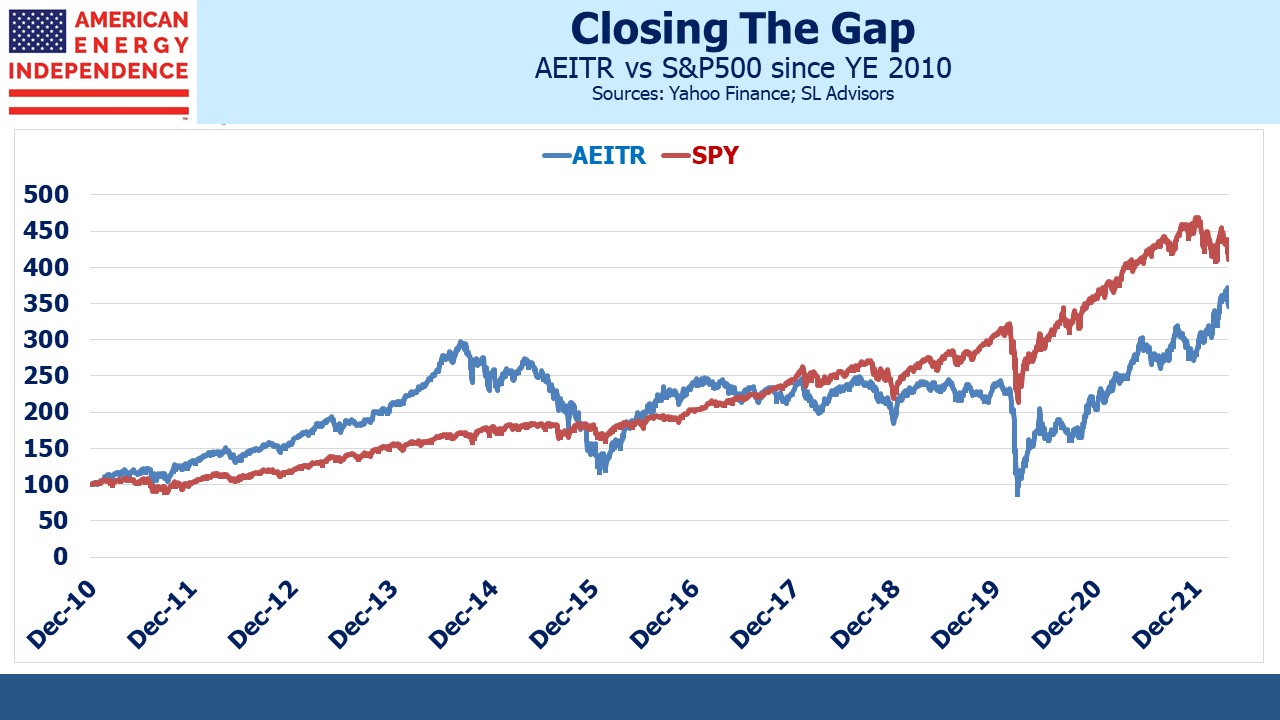
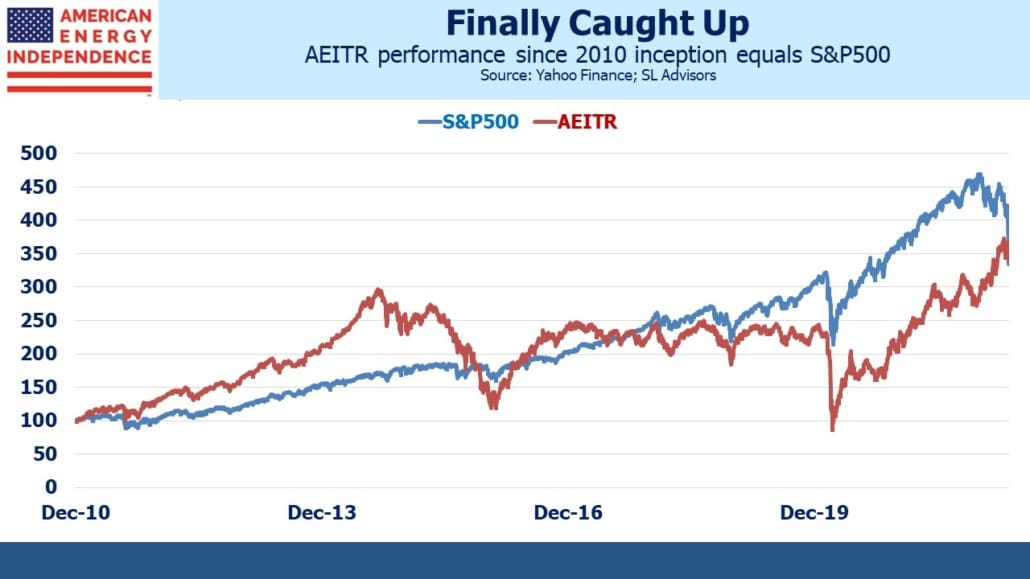
Value sectors including energy have returned with a vengeance. Bloomberg calculated that Cathie Wood’s ARK Innovation ETF (ARKK) has now underperformed the S&P500 since its launch in October 2014. Early this year ARKK crossed another ignominious threshold when we showed how poor has been the typical ARKK holder’s experience (see ARKK’s Investors Have In Aggregate Lost Money). ARKK’s since inception performance has not yet been exceeded by the American Energy Independence Index (AEITR), but rest assured that we shall note such in a future blog post if it occurs.

.avia-image-container.av-19qr8y6-c7ba6e6517264e58645d8e4f2b364161 img.avia_image{ box-shadow:none; } .avia-image-container.av-19qr8y6-c7ba6e6517264e58645d8e4f2b364161 .av-image-caption-overlay-center{ color:#ffffff; }

The AEITR did reach another milestone though – from the index inception date on 12/29/2010, it has now outperformed the S&P500. For most of the past decade investing in pipelines looked like a reliable way to lag the market. Regular readers know our confidence in midstream energy infrastructure has never been swayed by returns that at times presented powerful evidence of misplaced optimism. Ample history showing we have no skill at market timing means we’re still bullish on the sector – to us the reasons are abundant, just as the supply of reliable energy is constrained. Energy investors were cheered by Saudi oil minister Prince Abdulaziz bin Salman’s comment that, “The world needs to wake up to an existing reality. The world is running out of energy capacity at all levels.” I’m the driver you see smiling at the gas pump.

.avia-image-container.av-pqngry-29cd00970e208dc9384866058931f238 img.avia_image{ box-shadow:none; } .avia-image-container.av-pqngry-29cd00970e208dc9384866058931f238 .av-image-caption-overlay-center{ color:#ffffff; }

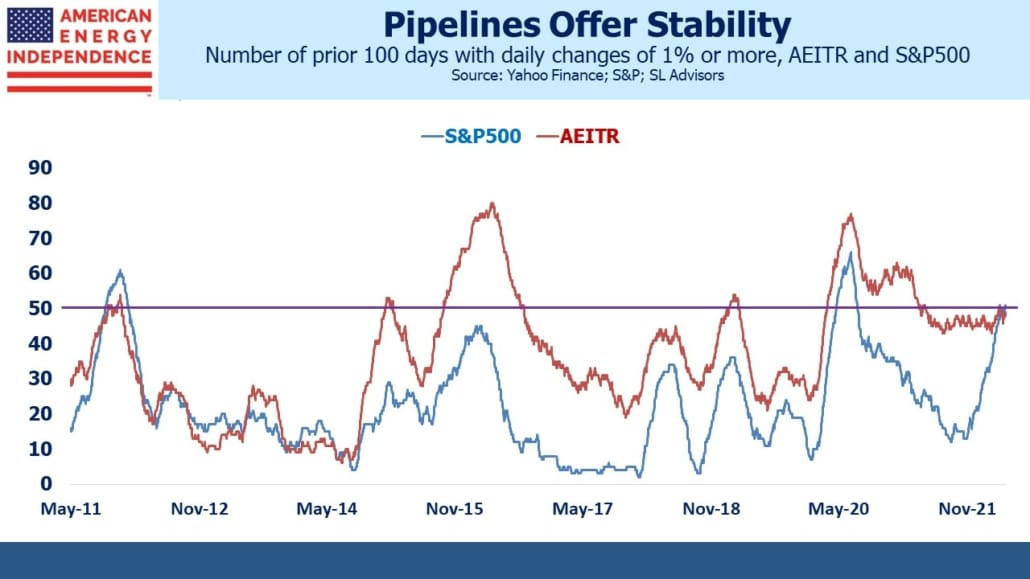
The pipeline sector is not only beating the S&P500. It’s also moving less. By the “more likely than not to move 1% or more” definition, the AEITR has the edge over the S&P500. This has rarely been the case over the past decade. The capital profligacy of the Shale Revolution caused volatility up and then down. Energy transition fears and Covid heaped further uncertainty. But they’ve been replaced by financial discipline, energy realism and the end of Covid (other than in China).

First quarter pipeline company earnings were very good, with most big companies beating expectations. Natural gas exports are creating more opportunities. Energy Transfer expects to move ahead with their Lake Charles liquefaction facility by the end of the year (see High-Energy Earnings Boost Pipelines). Even conservatively run Enbridge expects to profit from growing global demand for US natural gas. CEO Al Monaco recently said, “LNG exports are a big opportunity, with momentum building across the U.S. Gulf Coast, and now more so in western Canada.”

North American midstream energy infrastructure is steadily making up for lost ground over many timeframes. It’s doing so with no more volatility than the market, and in recent months has provided a very welcome negative correlation with traditional stock/bond portfolios. It’s worth noting that recession fears have had only a muted effect on energy prices. Crude oil is still around $100 and the Asian JKM benchmark for natural gas is at $27 per million BTUs for next winter, more than triple the US Henry Hub price. We continue to believe the pipeline sector offers attractive return potential to the long term investor.

We have three funds that seek to profit from this environment:

Energy Mutual Fund

Energy ETF

Inflation Fund

Please see important Legal Disclosures.


High-Energy Earnings Boost Pipelines

Earnings for pipeline companies are generally devoid of excitement unless steady growth gets you animated, such is the stability of most business models. But 1Q22 earnings were full of positive surprises. Cheniere (CEI) blew away expectations with 1Q22 EBITDA 65% ahead of consensus. Most of their Liquefied Natural Gas (LNG) contracts are based on a fixed charge for liquefaction, but in some cases they’re able to market the LNG themselves.

Continued strength in global LNG prices drove the beat. CFO Zach Davis reported that because of cash flows, “We’ll be bringing down the share count. We’ll be reducing interest expense, and ideally, eventually yes, increasing that guidance, but we’ll stick with what we got today.” He was referring to long term guidance, because they increased their 2022 EBITDA and Distributable Cash Flow (DCF) guidance by 17% and 26% respectively.

Enbridge (ENB), North America’s biggest pipeline company, beat consensus EBITDA by 2.2% and raised their dividend by 3.3% year-on-year. Dividend hikes are becoming a common theme across the sector. ENB has one of the more conservative management teams in the industry. Their C$3.44 per share payout equates to a generous 5.9% yield, 1.75X covered by DCF. ENB is also growing their energy transition footprint. They announced plans to develop a Carbon Capture and Sequestration (CCS) hub in Alberta, to capture CO2 emissions from local power generation and cement production. Like most of the big pipeline stocks, it still looks cheap to us.

.avia-image-container.av-27blrlm-c640d35af3f3dcd7bd4ee27162e36ca4 img.avia_image{ box-shadow:none; } .avia-image-container.av-27blrlm-c640d35af3f3dcd7bd4ee27162e36ca4 .av-image-caption-overlay-center{ color:#ffffff; }

Energy Transfer (ET), widely held by financial advisors we talk to, beat EBITDA expectations by 13% largely due to strong performance in natural gas pipelines. Co-CEO Marshall McCrea said on their earnings call, “In this quarter, our intrastate volumes were up 17%. Our interstate volumes were up 15%, our midstream volumes were up 14%. Our NGL’s record volumes, as I alluded to earlier, were up 17%.”

ET also expect to make a Final Investment Decision (FID) on their planned Lake Charles LNG export facility soon, having signed several agreement with buyers recently. McCrea saying, “we’re highly optimistic that we’ll have this fully contracted by the end of the year.”

.avia-image-container.av-1lvn4my-e4bf8b88526b048b0c27d2f0395430ee img.avia_image{ box-shadow:none; } .avia-image-container.av-1lvn4my-e4bf8b88526b048b0c27d2f0395430ee .av-image-caption-overlay-center{ color:#ffffff; }

Earnings beats and improved guidance were common, delivered by Kinder Morgan (KMI), TC Energy (TRP), Enterprise Products (EPD) and Williams (WMB) among others. Strength in natural gas pricing and volumes was widespread. Like ET, EPD saw strong demand in its Natural Gas Liquids (NGLs) segment where EBITDA of $1.2BN was 15% ahead of consensus.

.avia-image-container.av-1axolne-d9fdb04a83a204633a33bc11cae55a81 img.avia_image{ box-shadow:none; } .avia-image-container.av-1axolne-d9fdb04a83a204633a33bc11cae55a81 .av-image-caption-overlay-center{ color:#ffffff; }

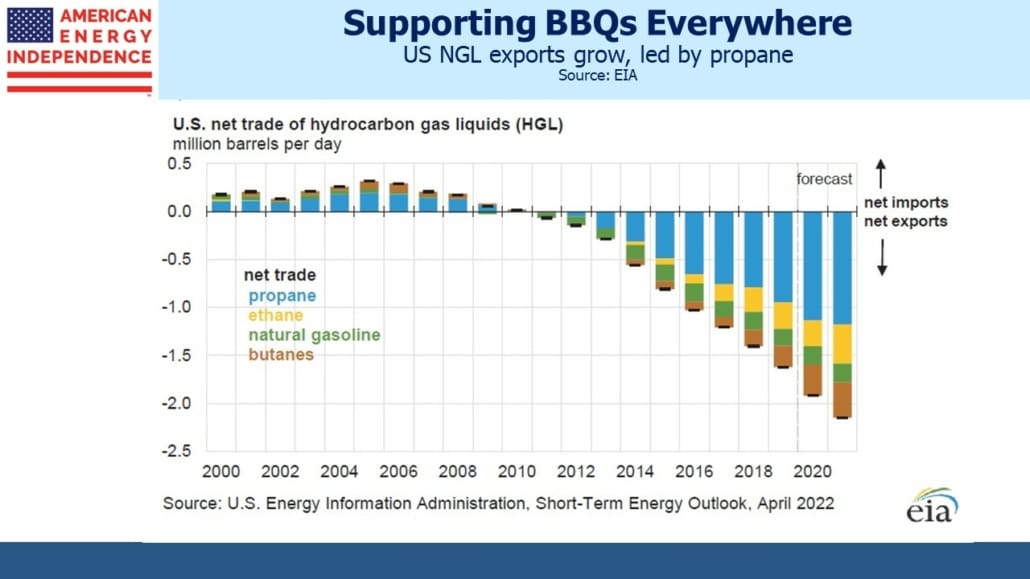
The US moved to a net exporter of NGLs in 2010 and now ships 2.3 Million Barrels per Day (MMB/D). Propane, widely used in home barbecues and by farmers to dry crops, is over half this. EPD, ET and Targa Resources (TRGP) dominate the processing and movement of NGLs.

TRP raised growth capex by 9% and attributed it all to inflationary pressures on labor and materials, something we’re all accustomed to. Meanwhile Equitrans (ETRN) continued to press ahead with the Mountain Valley Pipeline (MVP), buoyed no doubt by vocal support from Senator Joe Manchin (D-WVa). MVP is all but complete, but has suffered repeated delays because of adverse court rulings on previously issued permits.

ETRN is now pursuing new permits from two Federal agencies and hopes to place MVP into service by 2H23. NextEra, a JV partner in MVP, was so pessimistic on MVP’s prospects that they wrote their investment down to zero in February. Their shrewd accountants have engineered a tax deduction on the full capital investment with the possibility of future returns on an asset carried at zero.

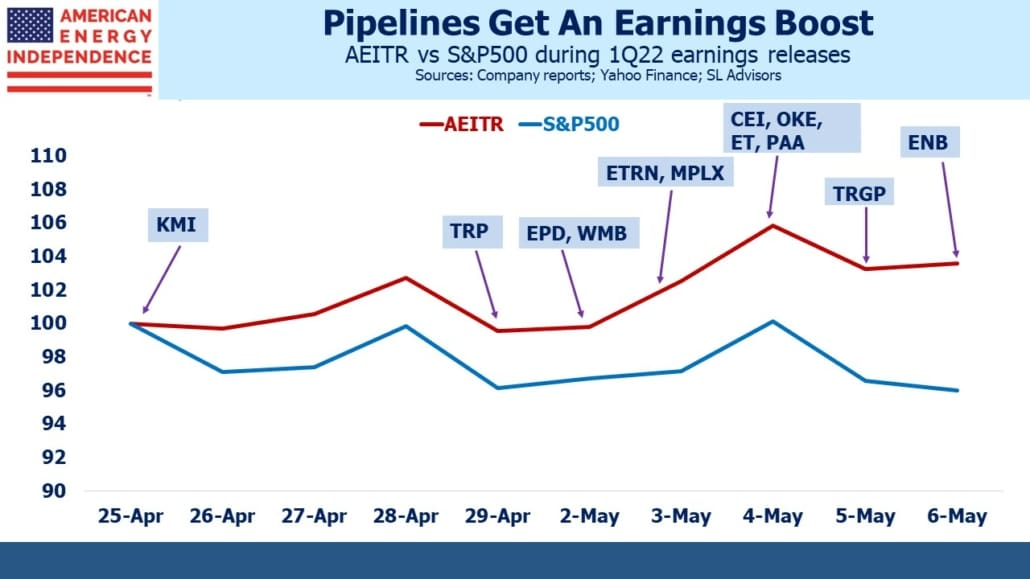
Since KMI kicked off pipeline sector earnings on April 25th, the American Energy Independence index (AEITR) has gained 3.5%, outperforming the S&P500 by 7.5%.

Fears of stranded assets due to the energy transition used to hang over the sector. Opposition to new pipelines from environmental extremists further contributed to negative investor sentiment. We concluded long ago that constraints on spending by pipeline companies was good for investors, albeit sadly not so good for consumers (see Partnering with Pipeline Protesters from June 2019). WMB CEO Alan Armstrong confirmed as much on their earnings call, when he said, “Thanks to the efforts of the environmental opposition and making pipeline permitting so difficult in the areas that we operate, it’s allowed us much higher returns in that space than would normally be allowed.” If you meet a pipeline protester, give them a hug and offer to drive them to their next event.

.avia-image-container.av-opdqai-04cbb4f4abd71bbb968417a8829c8905 img.avia_image{ box-shadow:none; } .avia-image-container.av-opdqai-04cbb4f4abd71bbb968417a8829c8905 .av-image-caption-overlay-center{ color:#ffffff; }

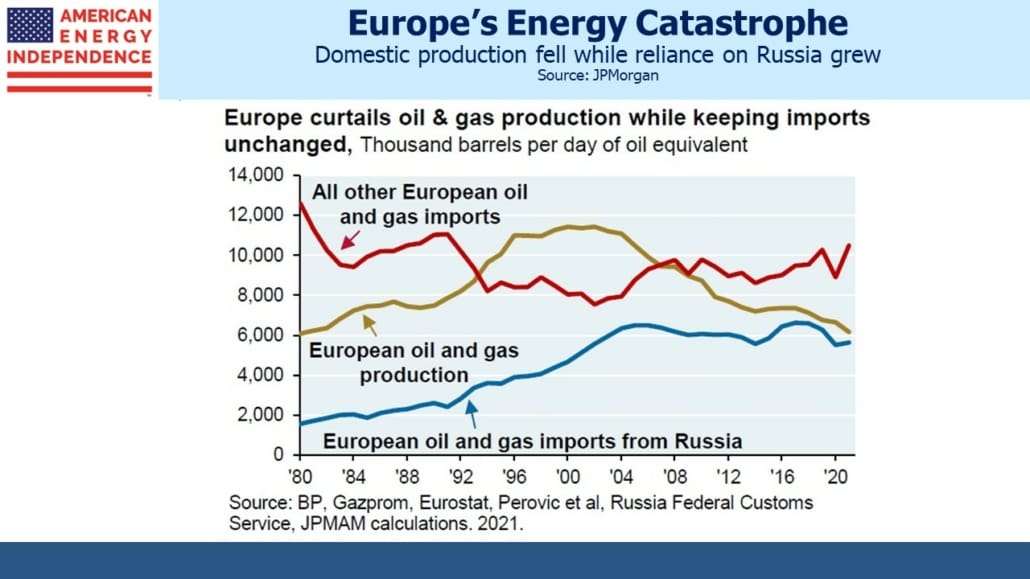
Failures of European energy policy are boosting the outlook for our energy sector. Because climate extremists have held more influence than in the US, over the past two decades Europe let its domestic oil and gas production drop by half. Although consumption has been falling, their increasing reliance on Russian oil and gas made them more supplicant than trade partner. Abandonment of this policy is already boosting the results of pipeline companies and their improved outlook. The EU has held a strong, wrong opinion on energy. By contrast, WMB’s Armstrong said of the US, “I think all of us would question whether we’ve actually had an energy policy or not.” He’s right. No policy is still better than a bad one, but we can do better.

We have three funds that seek to profit from this environment:

Energy Mutual Fund

Energy ETF

Inflation Fund

Please see important Legal Disclosures.


Why The Fed’s Critics Will Become More Vocal

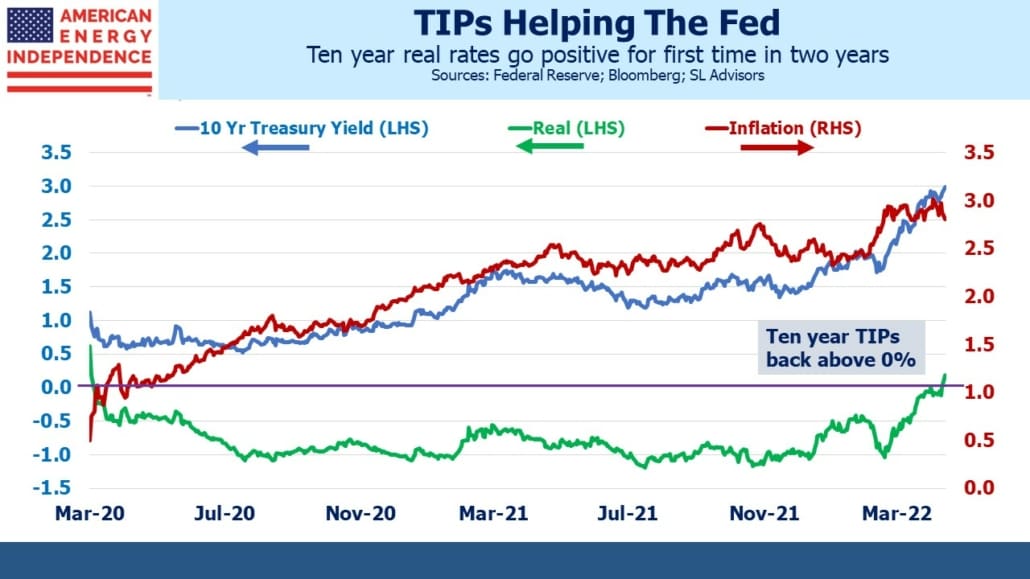
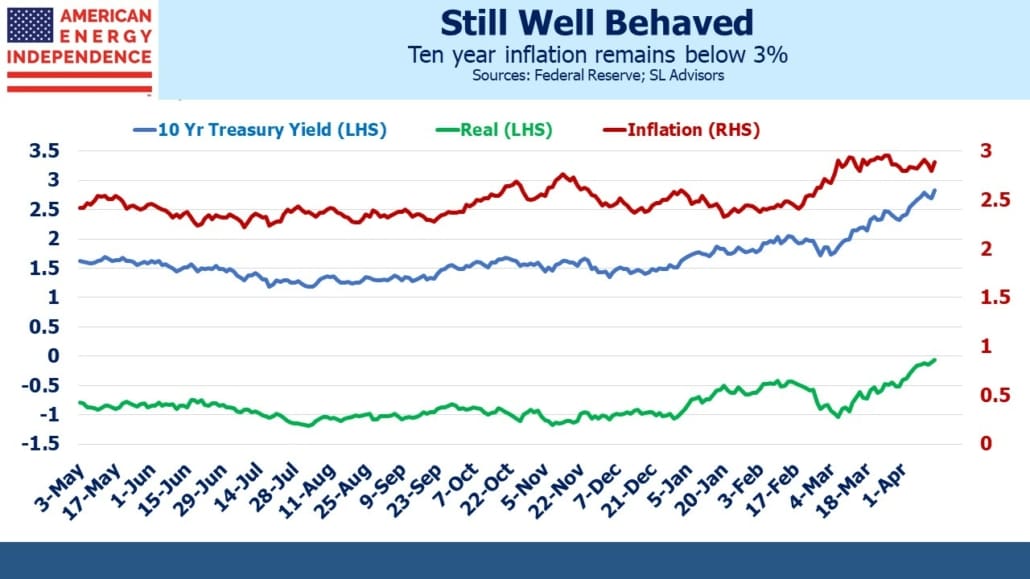
The ten year treasury yield touching 3% has drawn headlines, but the bigger story is that the increase in nominal yields has been driven by rising real yields. Ten year TIPs yield 0.18%, the first time they’ve been positive in over two years. Until recently, real yields had been declining irregularly for decades. $TNs of return-insensitive capital (central banks, sovereign wealth funds and others with inflexible investment mandates) is part of the reason.

The Fed needs tighter financial conditions in order to slow the economy. Higher real ten year yields help. Tighter monetary policy is most effective when it increases bond yields, because that’s where the economy and equity markets are more sensitive. Therefore, rising bond yields reduce the need for aggressive hikes in the Fed Funds rate.

.avia-image-container.av-1fyk37u-c9498d529c4265f442ac231836b880b4 img.avia_image{ box-shadow:none; } .avia-image-container.av-1fyk37u-c9498d529c4265f442ac231836b880b4 .av-image-caption-overlay-center{ color:#ffffff; }

Criticism of the Fed has been limited. Former Treasury secretary Larry Summers and former NY Fed president Bill Dudley are notable exceptions, and are well qualified to find fault publicly, as they have. Republicans have voiced unhappiness about elevated inflation, while Democrats seem to care more about the Fed’s approach to climate change. We may not like inflation, but since the cure is a weaker economy, we’ll like that a lot less.

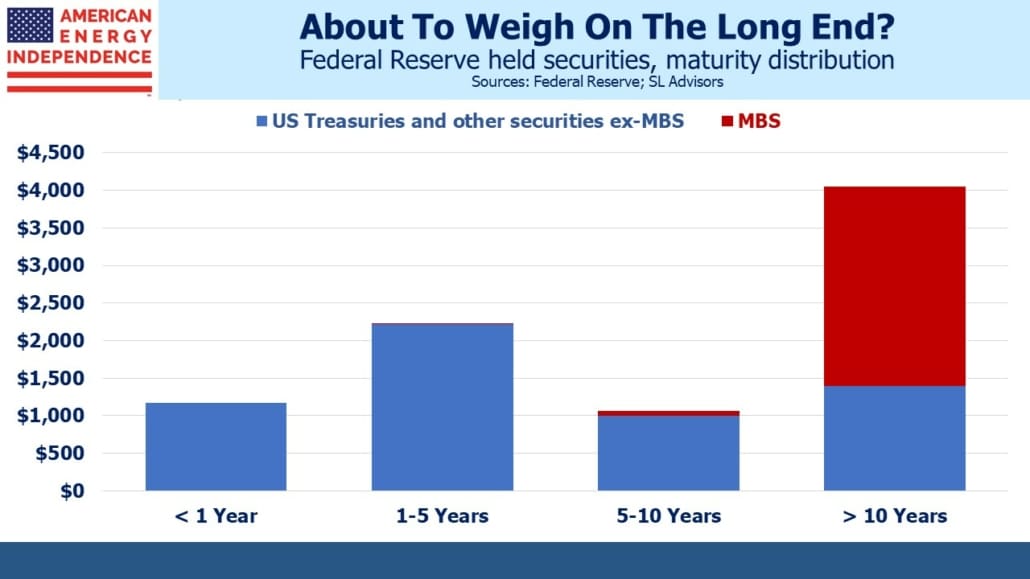
Quantitative Easing (QE) was obviously maintained way too long, and the Fed is approaching its opposite, Quantitative Tightening (QT), cautiously. Much has been made of their decision to shrink the balance sheet, but they have over $1TN in treasury securities maturing within the next year. Letting these roll off won’t impact ten year yields. But they may sell Mortgage Backed Securities (MBS), which looks sensible because buying Fed buying of MBS has been supporting the strong housing market.

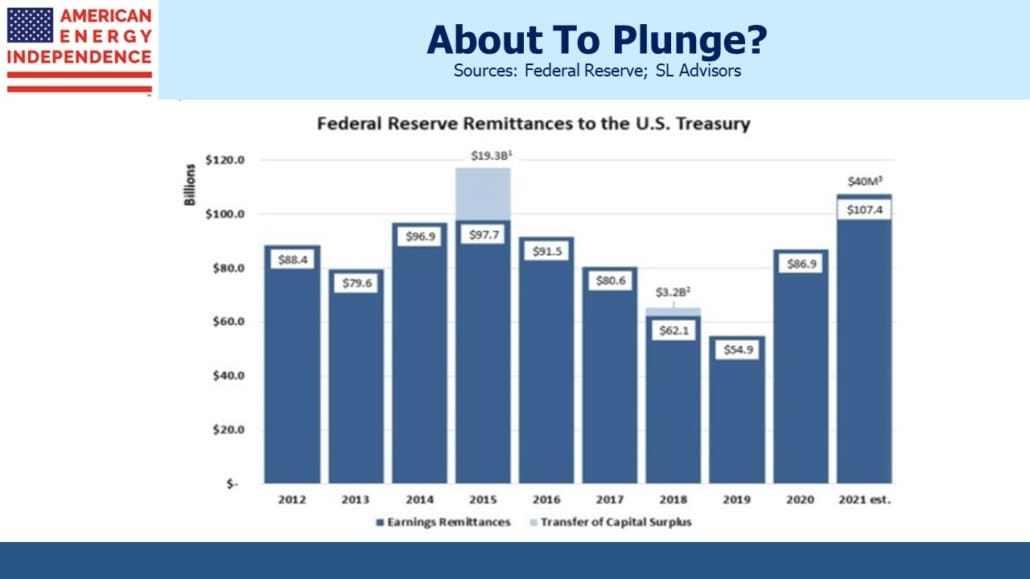
The Fed remits its operating surplus to the US Treasury every year. In recent years this has been swollen by positive net interest income from its $9TN balance sheet.

.avia-image-container.av-1buug16-6772482094cb399432377212ec937a56 img.avia_image{ box-shadow:none; } .avia-image-container.av-1buug16-6772482094cb399432377212ec937a56 .av-image-caption-overlay-center{ color:#ffffff; }

In its last fiscal year (ending September 2021) the Fed reported $122BN in interest income from securities. Its balance sheet averaged $8TN, so we can infer that the average interest rate on its portfolio is around 1.5%. After adjustments, net income of $107BN was remitted to the government.

The Fed’s FY2021 interest expense was $6BN, but this is now going up. Assuming the $1TN in securities that will mature within a year yield 0%, the remainder of the Fed’s balance sheet yields just over 1.7%. Short term rates will be at that level by year’s end if not sooner. The 2022-23 fiscal year will see a steep drop in the Fed’s annual remittance to the Treasury. It could even flip to where the Fed has an operating loss.

.avia-image-container.av-mlj3t6-8875490b66d48341d360500d22024606 img.avia_image{ box-shadow:none; } .avia-image-container.av-mlj3t6-8875490b66d48341d360500d22024606 .av-image-caption-overlay-center{ color:#ffffff; }

Auctioning MBS would generate realized losses for the Fed. They have over $2.6TN in MBS with maturities of greater than ten years. Assuming a duration of ten and a 2% increase in yields from when they were bought, for every $100BN in MBS the Fed sells they’d realize a $20BN loss.

None of this will surprise policymakers, who we can assume took all this into consideration when they began the latest round of QE in 2020. They worried about their exit a decade ago, when wrestling with how to reduce their balance sheet following the 2008 Great Financial Crisis (GFC). Back then St. Louis Fed president James Bullard called it a “recipe for political problems.” They began tightening monetary policy in late 2015, and took almost four years to reach 2.4%. The Fed moved so slowly to unwind the GFC balance sheet that it wasn’t far below its 2016 $4.5TN peak before Covid led to a second round of QE. From 2015 to 2019 their remittances to the Treasury fell by almost half.

The Fed could argue that losses from QE are proof of its benefit. The higher rates that follow reflect QE’s success in arresting the economic decline that necessitated it. This is a sound economic argument, but not one that’s been tested yet. It’s the opposite of what deft currency intervention produces – a central bank that steps in to offset extreme moves in its currency is buying low/selling high – as long as it’s successful. Sometimes it isn’t. The 1992 collapse of Sterling against the Deutsche Mark overwhelmed the Bank of England, netting George Soros’s hedge fund an estimated $1BN profit on “Black Wednesday” (September 16, 1992).

QE is a buy high/sell low strategy. Because of the Fed’s error in maintaining overly accommodative policy for too long, they now must tighten more aggressively. It’ll take time, but the budgetary consequences of their poor decisions will reach the political classes in another year or so, in time for the 2024 presidential election. The Congressional Budget Office estimates that a 1% increase in rates above official projections increases the interest expense on Federal debt by $200BN. Their most recent forecast was for ten year treasury yields to average 1.6% through 2025.

Slower normalization of monetary policy and lethargic balance sheet reduction will allow higher inflation while smoothing the drop in Fed remittances to the Treasury. Such a debate won’t make it into the FOMC minutes, but will be on the minds of chair Jay Powell and his colleagues.

We have three funds that seek to profit from this environment:

Energy Mutual Fund

Energy ETF

Inflation Fund

Please see important Legal Disclosures.


Why Recession Fears Can Help Energy Stocks

Last week recession questions were more common than in the past during our many conversations with clients. The likely performance of the energy sector during a slowdown is what they’re asking.

Recession risks are growing in the minds of many. In one recent survey, a third of economists are forecasting a recession within two years. Some may joke that a third of economists are always forecasting a recession – but Goldman Sachs puts the odds at about 35% and JPMorgan has increased provision for loan losses because their internal modeling showed heightened risk.

Recessions aren’t good for stocks, and no sector is immune. If you’re worried about a recession, you should reduce your equity holdings. But the market invariably bounces back – most spectacularly following Covid. The bigger risk for investors is inflation, and it may not always come with robust economic growth as we have now.

Data on Friday showed 1Q22 Eurozone growth of only 0.2%, down from 0.3% the prior quarter. France was flat and Italy contracted. Year-on-year inflation is running at 7.5%. Stagflation, which is being increasingly heard from European analysts, is especially hard for central banks to manage because the correct monetary stance is unclear.

The US is in better shape. Last week’s GDP report was negative partly due to a bigger trade deficit, evidence of robust demand. On Friday personal consumption expenditures were solid and the quarterly Employment Cost Index increased by 1.4%, up from 1.1% in December. In America, everyone who wants a job has one. Gasoline prices are high, but Democrats can promote that as a reason to accelerate the energy transition while Republicans can feel good about the boost this provides to domestic production and energy independence. Maybe I’m overly glass half full, but spending $100 to fill up feels pretty good right now.

.avia-image-container.av-1cl7y4h-c98e89aae25516e881575450adc57cb8 img.avia_image{ box-shadow:none; } .avia-image-container.av-1cl7y4h-c98e89aae25516e881575450adc57cb8 .av-image-caption-overlay-center{ color:#ffffff; }

The Fed is forecasting a utopian combination of falling inflation, moderate rate hikes and continued strong employment that is so hopeful it’s certain to be wrong.

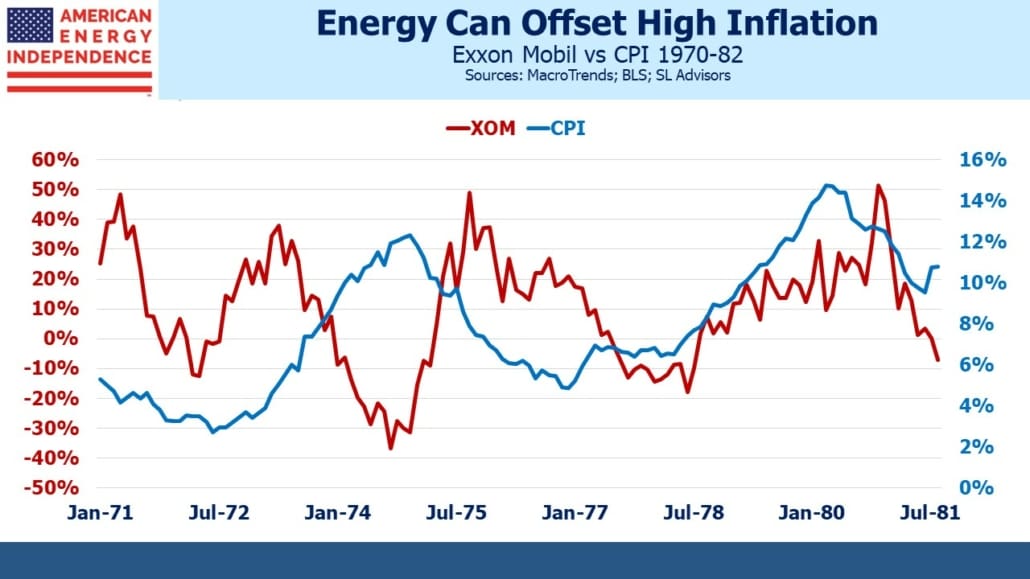
We looked back at the performance of Exxon Mobil (XOM) versus CPI going back to 1970 to see what type of inflation protection the energy sector might offer. It turns out that one year returns on XOM and year-on-year CPI aren’t correlated during times of low inflation, but the relationship is stronger when prices are rising faster. The chart plots both sets of one year returns from 1970 to 1982, the last time we had inflation as high as it is today.

.avia-image-container.av-t4cgsh-245cdf7177c89f154149dc1c45bb050f img.avia_image{ box-shadow:none; } .avia-image-container.av-t4cgsh-245cdf7177c89f154149dc1c45bb050f .av-image-caption-overlay-center{ color:#ffffff; }

High returns on XOM anticipate higher CPI, although the time lag does seem to vary. When inflation is running above 6%, one year XOM returns have a 0.25 positive correlation with one year lagged CPI. In other words, when investors anticipate rising inflation, they invest in the energy sector ahead of time. The strong recent returns on energy stocks have similarly correlated well with higher inflation.

Which element of the FOMC’s utopian forecast is most likely to be wrong? It doesn’t even have the Fed Funds rate reaching inflation until the end of next year. A real policy rate that’s negative is not how monetary policy has in the past curbed inflation. It’s also unclear why wage inflation, currently 4.7% and rising year-on-year, will moderate if the unemployment rate remains at 3.5% as they expect.

The path to a recession runs through stubbornly high inflation. The last two downturns, 2020 Covid and 2008 Great Financial Crisis, were unusual. Most recessions occur because the Fed waits too long to raise rates and then goes too far. If those recession fears turn out to be prescient, it will most likely be because the Fed’s rate forecast was too benign. That would mean their inflation forecast was also too optimistic. This would in turn suggest that energy stocks would continue to play an important role in protecting against inflation.

In brief – if you fear a recession, you could do worse than buy energy stocks because it’ll be higher than expected inflation and interest rates that causes one.

On a separate note, Tellurian (TELL) CEO Charif Souki has many talents but deferred reward for good execution is not one of them. We’ve long preferred NextDecade (NEXT) over TELL – both are planning new export terminals for Liquefied Natural Gas (LNG), but Souki’s risk tolerance and inflated view of his own compensation have never sat well with us. When energy stocks cratered two years ago, Souki was forced to sell TELL stock he owned on margin. No matter – the board soon granted him more.

In a proxy quietly filed on Thursday (see here pg 69 paragraph c), TELL granted Souki over $17 million in stock awards. His payday ought to wait until TELL is actually loading LNG onto tankers from its not yet built terminal. TELL’s prospects look very good, but if the additional equity capital they assuredly need comes on terms that are ruinously dilutive for today’s common equity holders, their CEO will nonetheless have done very well. Souki is a risk factor for investors in TELL to consider.

We have three funds that seek to profit from this environment:

Energy Mutual Fund

Energy ETF

Inflation Fund

Please see important Legal Disclosures.


Pipelines — There’s Always A Bull Market Somewhere

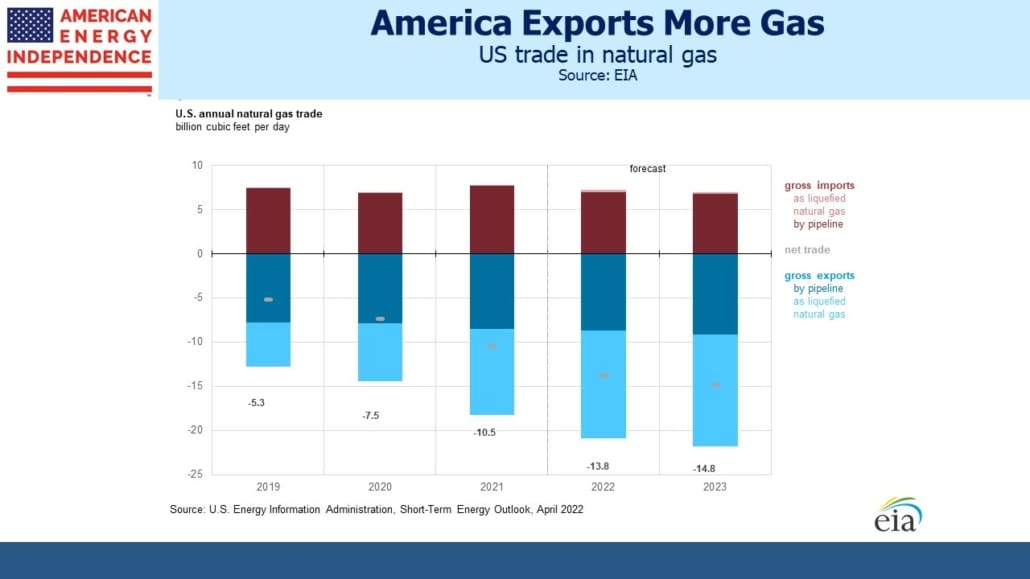
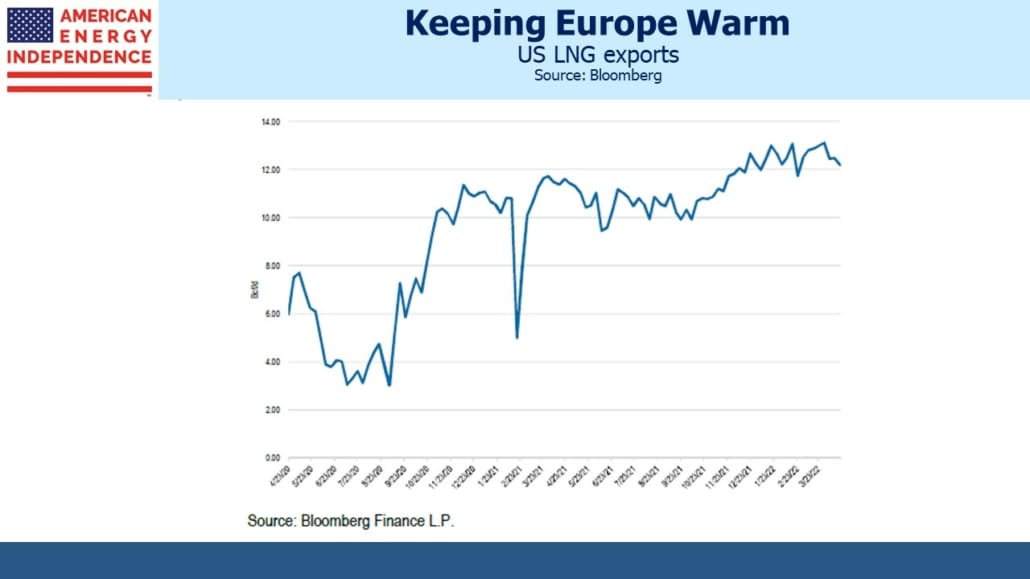
The US was increasing its net exports of natural gas before Russia’s invasion of Ukraine added an element of urgency. Liquefied Natural Gas (LNG) gets most of the attention, but this year we’ll export nine Billion Cubic Feet per Day (BCF/D) by pipeline, to Mexico and eastern Canada.

LNG exports are still rising, with most global trade directed to Asia. Cheniere, whose Sabine Pass and Corpus Christi terminals export over half the total, often signs flexible contracts that give the buyer (typically a large trading firm like Trafigura) destination flexibility.

.avia-image-container.av-4u7dvep-c77e89201a18f4d94e5069811e73dce9 img.avia_image{ box-shadow:none; } .avia-image-container.av-4u7dvep-c77e89201a18f4d94e5069811e73dce9 .av-image-caption-overlay-center{ color:#ffffff; }

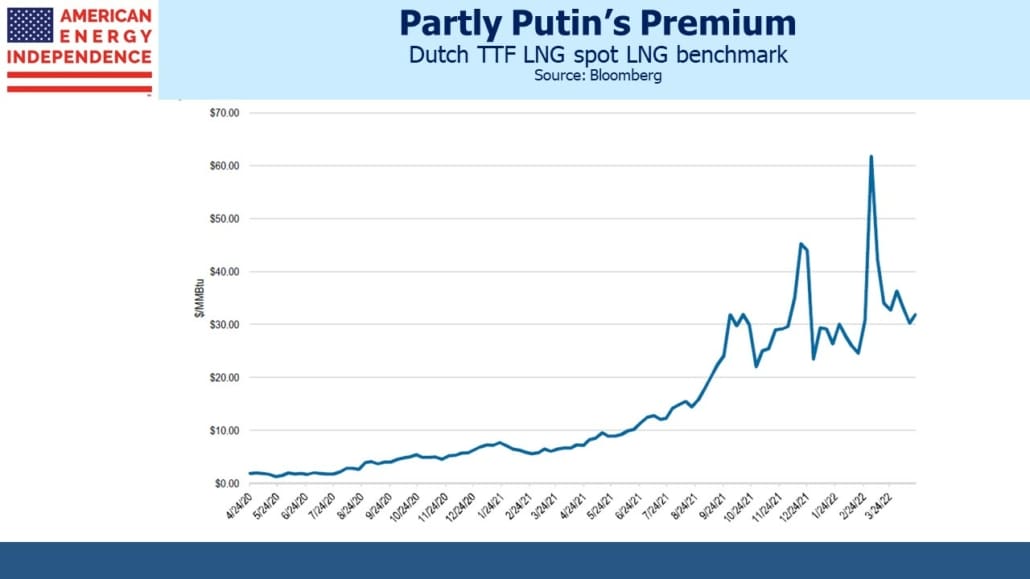
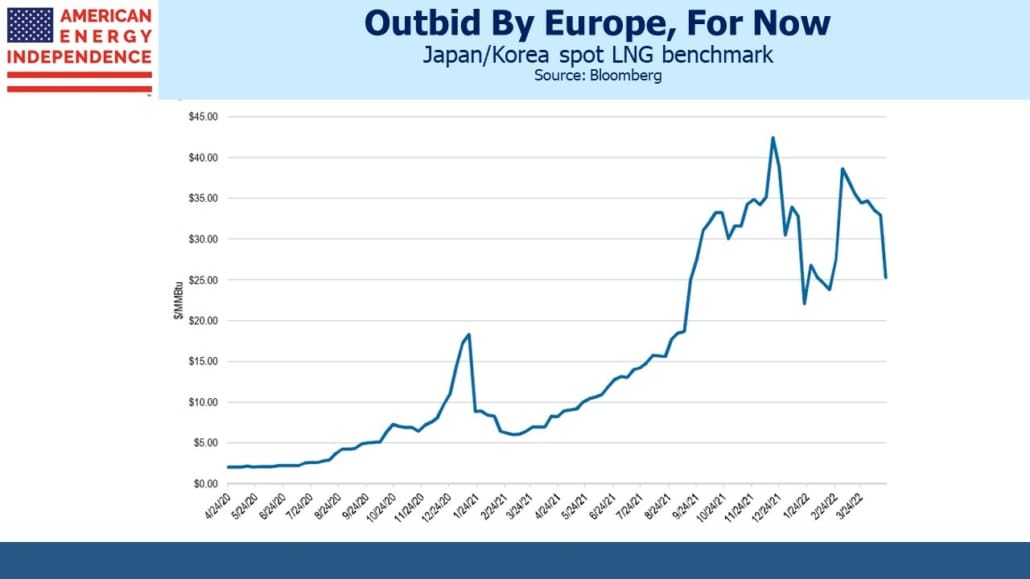
As Europeans buyers have scrambled to replenish storage, they have outbid Asian buyers. Competition between the two is likely to intensify later in the year. Germany hopes to begin using the four floating LNG terminals they’ve leased as soon as this winter, assuming the land-based infrastructure can be ready in time. Global LNG prices are likely to remain firm.

.avia-image-container.av-4h36zj5-8c1bc4694d8e4b667d6230e048fccc4c img.avia_image{ box-shadow:none; } .avia-image-container.av-4h36zj5-8c1bc4694d8e4b667d6230e048fccc4c .av-image-caption-overlay-center{ color:#ffffff; }

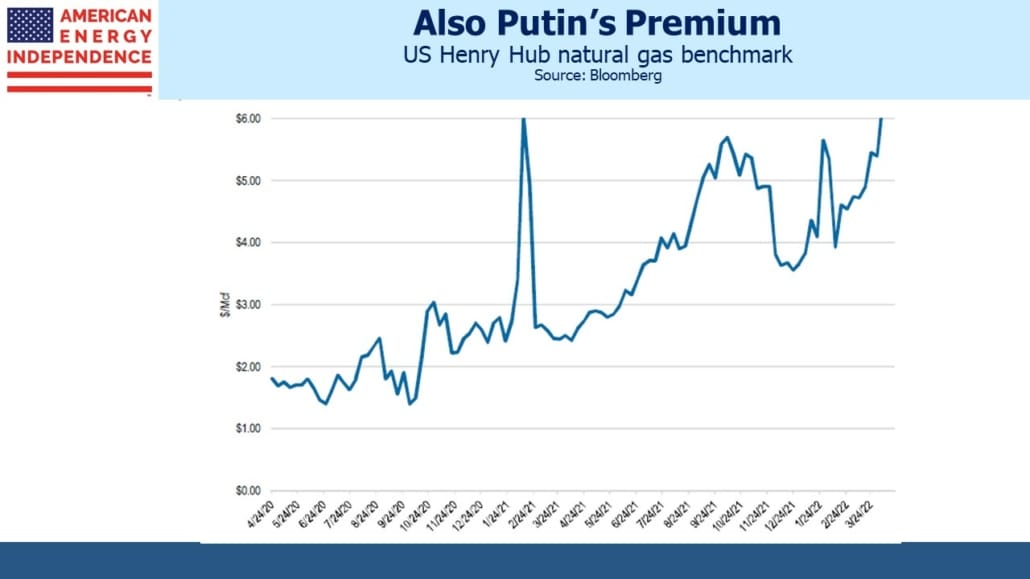
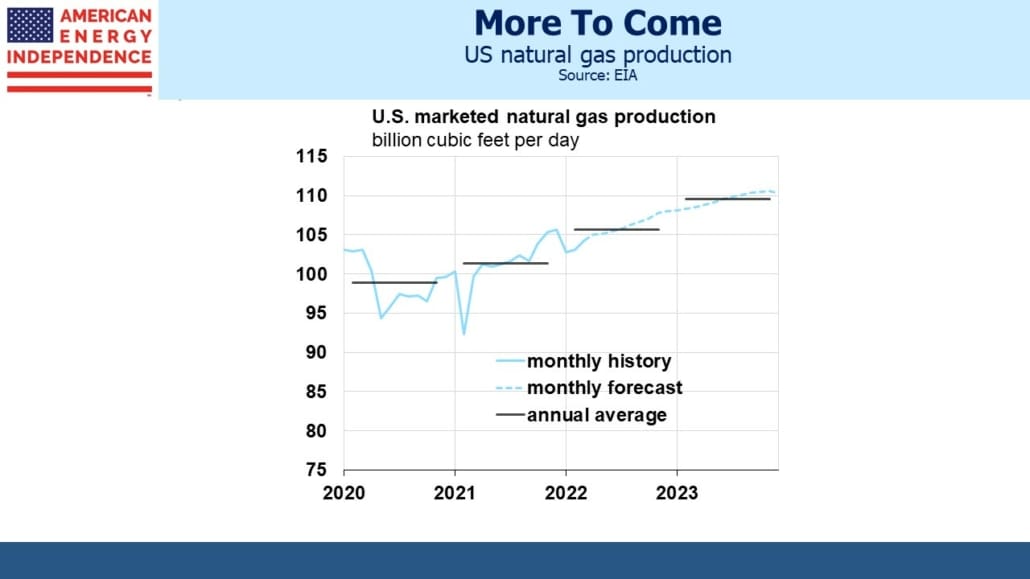
The difference between US natural gas prices and the two main overseas benchmarks remains huge – far more than necessary to induce higher exports which are limited by our LNG export capacity. As we send more LNG overseas, it will create some upward pressure on domestic prices. The good news is that domestic production is increasing to keep up with exports.

.avia-image-container.av-3y0b6wx-968d677a33a03e0607ee38076248e375 img.avia_image{ box-shadow:none; } .avia-image-container.av-3y0b6wx-968d677a33a03e0607ee38076248e375 .av-image-caption-overlay-center{ color:#ffffff; }

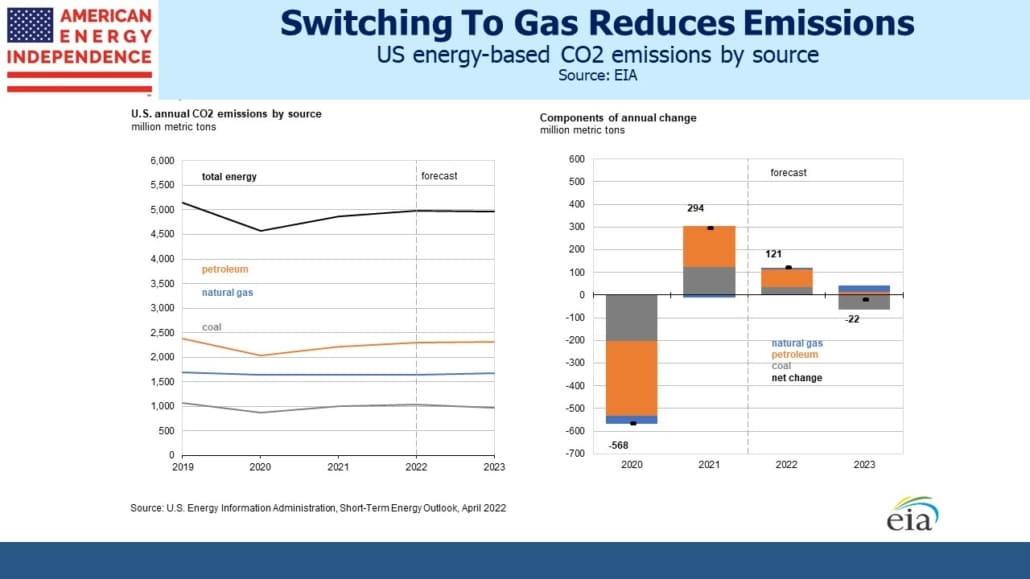
The US Energy Information Administration (EIA) in their current Short Term Energy Outlook US expects coal consumption to decline next year after rising in 2022. Power plants switching from coal to natural gas will be the driver, as it was for over a decade prior to Covid. The EIA expects US natural gas prices to ease from today’s relatively high prices because of increased production. This will keep our energy-related CO2 emissions flat next year.

.avia-image-container.av-3l3dsm9-c7b6a7f25d679e7eda18cbdaa7555131 img.avia_image{ box-shadow:none; } .avia-image-container.av-3l3dsm9-c7b6a7f25d679e7eda18cbdaa7555131 .av-image-caption-overlay-center{ color:#ffffff; }

Kinder Morgan (KMI) reported better than expected 1Q22 results last week, buoyed by their Natural Gas Pipelines segment. Growing natural gas takeaway capacity out of the Permian basin in west Texas is behind KMI’s decision to invest in more compression on their Permian Highway and Gulf Coast Express pipelines that run from west Texas to the Gulf of Mexico. Increasing capacity on existing pipelines is preferable to greenfield projects across most of the country. It heads off environmental extremists and requires less capex, so is preferable where existing infrastructure allows it.

.avia-image-container.av-2t5dnr5-dd78fbb12264dc8413064e24c9fdaff7 img.avia_image{ box-shadow:none; } .avia-image-container.av-2t5dnr5-dd78fbb12264dc8413064e24c9fdaff7 .av-image-caption-overlay-center{ color:#ffffff; }

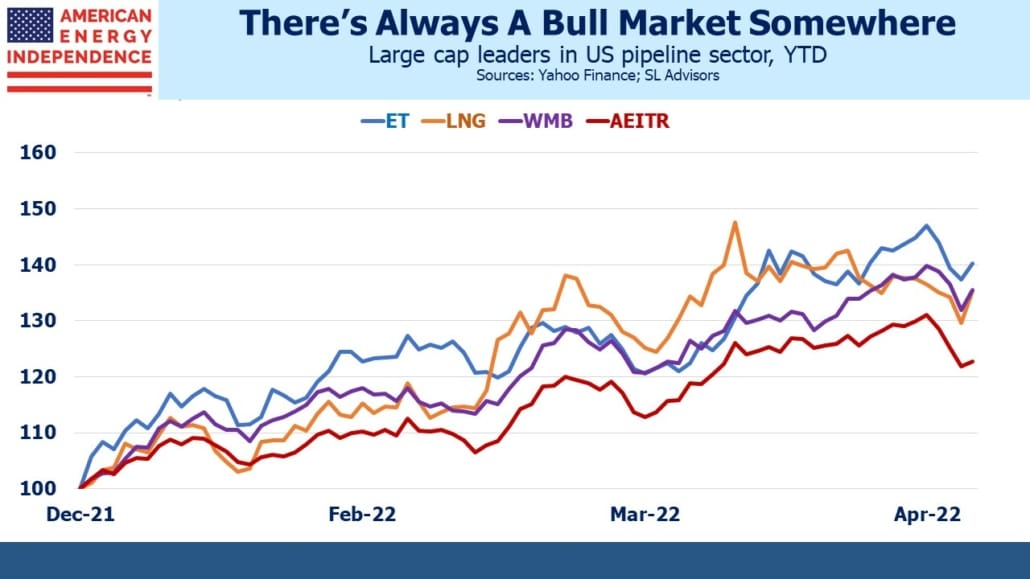
Energy Transfer (ET) is the individual name most often held by financial advisors we talk to. It has been consistently cheap, inexplicably so to many, for years even relative to a sector that has long been out of favor. This year it has been one of the leaders in the American Energy Independence Index (AEITR). Yesterday ET announced a 30% distribution hike, another step on the road to redemption for a company with a checkered history of fiduciary forgetfulness (see Energy Transfer: Cutting Your Payout, Not Mine).

.avia-image-container.av-2jvhrpd-598cd292f467e3de5ce84611bc6bf7c3 img.avia_image{ box-shadow:none; } .avia-image-container.av-2jvhrpd-598cd292f467e3de5ce84611bc6bf7c3 .av-image-caption-overlay-center{ color:#ffffff; }

Clients who are underinvested in the pipeline sector often look at recent returns and ask whether they’ve missed the rally. Those possessed of sufficient fortitude or recklessness to have bought on March 18, 2020 are up 4X. Returns from the Covid low are spectacular, but highly aberrant. The YTD return at that point was –64%, caused in no small part by the managers of MLP closed end funds who combined poor judgment with misplaced self-confidence (see MLP Closed End Funds – Masters Of Value Destruction). It is to their clients’ misfortune but everyone else’s gain that sufficient capital was destroyed in the rush to delever that they’re now too small to repeat.

.avia-image-container.av-246nu3l-8a0de3efd0d93357af29580d9782ebda img.avia_image{ box-shadow:none; } .avia-image-container.av-246nu3l-8a0de3efd0d93357af29580d9782ebda .av-image-caption-overlay-center{ color:#ffffff; }

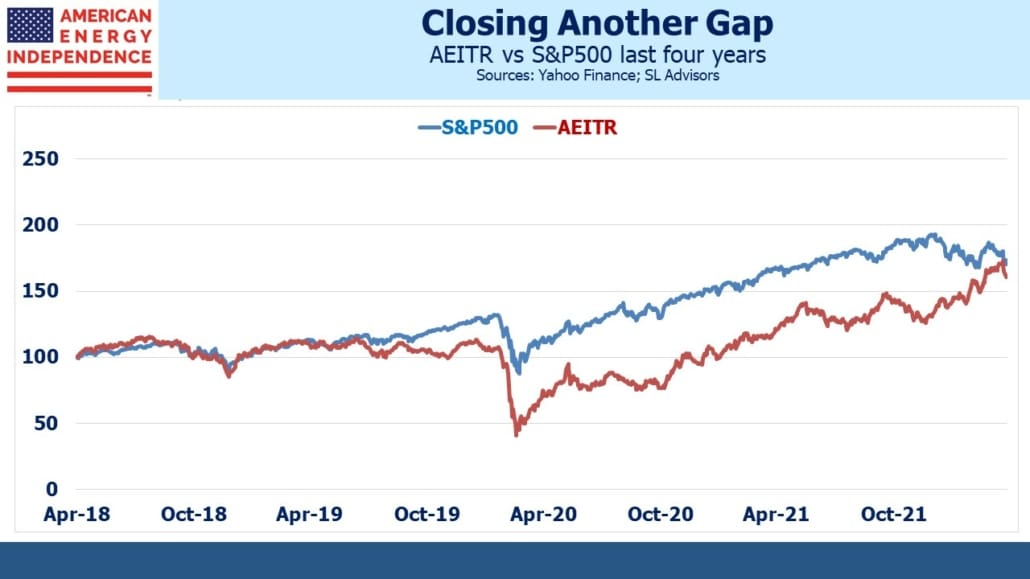
A longer timeframe is more meaningful. Over four years, the AEITR has delivered almost the same return as the S&P500 (12.5% pa vs 14.0% pa). Another couple of days of relative performance like yesterday (S&P500 lagged AEITR by 2.5%) will make their four year returns match.

.avia-image-container.av-1rut6m9-5d3b45d0d1f212bb6e462225b3999ecd img.avia_image{ box-shadow:none; } .avia-image-container.av-1rut6m9-5d3b45d0d1f212bb6e462225b3999ecd .av-image-caption-overlay-center{ color:#ffffff; }

An investor contemplating an equity allocation would scarcely be dissuaded by the stock market’s four year return. However, the prospects for inflation above the Fed’s 2% target for years might give her pause. Pipeline stocks should do well in such an environment.

.avia-image-container.av-10nljz5-560fb6abb9256f3fe1cd6d9b7a780959 img.avia_image{ box-shadow:none; } .avia-image-container.av-10nljz5-560fb6abb9256f3fe1cd6d9b7a780959 .av-image-caption-overlay-center{ color:#ffffff; }

Or she may consider the growing importance of energy security to Europe and the resulting demand for US LNG; the continuing financial discipline exhibited by energy companies, and the global opportunity for reduced CO2 emissions from coal to gas switching.

.avia-image-container.av-negrs1-05920a08e9bd365615f2a960fd98b8bd img.avia_image{ box-shadow:none; } .avia-image-container.av-negrs1-05920a08e9bd365615f2a960fd98b8bd .av-image-caption-overlay-center{ color:#ffffff; }

The point is that the traumatic V-shaped low of midstream energy infrastructure in 2020 creates high recent returns, but over longer periods pipeline sector returns look rather equity-like. Since December 2010, the inception of the AEITR, the S&P500 is ahead 13.3% vs 11.6%. The AEITR is 18% away from where its 12 year return would equal that of the S&P500, less than its YTD performance. We think it will close that gap too.

We have three funds that seek to profit from this environment:

Energy Mutual Fund

Energy ETF

Inflation Fund

Please see important Legal Disclosures.


The Varied Uses For LNG

Wells Fargo describes Liquefied Natural Gas (LNG) as THE theme for midstream energy infrastructure. In a recent series of meetings they found investors were “highly constructive on long-term fundamentals for global LNG…and looking for ways to play the theme.”

One reason is that Europe’s pivot on energy security seems unlikely to change regardless of the outcome in Ukraine. The fact and form of Russia’s invasion are immutable. In a brief moment, Russia has shredded the hopes of those who embraced engagement via trade (see Russia Boosts US Energy Sector).

We were bullish on natural gas before the invasion, because its growth prospects already looked good based on growing Asian demand. The possibility that coal consumers around the world might follow the US lead and start switching to natural gas power plants so as to reduce CO2 emissions remains an upside option.

.avia-image-container.av-14rb757-f2ebbb61b0d393e247cd61e1c1b1be30 img.avia_image{ box-shadow:none; } .avia-image-container.av-14rb757-f2ebbb61b0d393e247cd61e1c1b1be30 .av-image-caption-overlay-center{ color:#ffffff; }

Recent events have drawn more attention to LNG. Spot prices in Europe remain 4X the US and have been double that in recent weeks. The constraint on US exports to Europe isn’t the availability of natural gas, but the export facilities to liquefy it and load it onto LNG tankers. The Financial Times recently warned that building new export infrastructure will take years, meaning price relief won’t come quickly to Europeans.

The long lead time on construction provides decent visibility into future export capacity. Because there’s no Plan B for an LNG terminal, twenty year contracts are common to assure an adequate return on investment. Cheniere is the only pure-play publicly-traded US LNG corporation operating, so investors that are bullish on LNG have limited choices. Cheniere is one of the best Free Cash Flow (FCF) story in the midstream sector. Their capex needs have been falling since 2016 while Cash Flow From Operations (CFFO) has been increasing. Their reduced financing needs have allowed them to pay down over $1BN in debt in each of the past two years. This reduced FCF but is a use of cash likely to make most equity investors happy.

.avia-image-container.av-mx9cdn-17d8040ac6f08c685833995112f32b6c img.avia_image{ box-shadow:none; } .avia-image-container.av-mx9cdn-17d8040ac6f08c685833995112f32b6c .av-image-caption-overlay-center{ color:#ffffff; }

Cheniere’s Executive Vice President Anatol Feygin recently described the natural gas market as undergoing a “demand shock” after years of underinvestment. Not surprisingly, he is very bullish on the company’s prospects.

Although Europe’s need for LNG has spurred the sector higher, Asia is the biggest market. Emerging economies are increasing their consumption of all kinds of energy, from coal to renewables, as they strive to raise living standards. When Asian power plants burn natural gas, they are probably substituting for coal. In fact, the single most constructive thing climate extremists can do is encourage coal to gas switching in the developing world, most especially Asia. China plans to invest $130BN in gas projects. Vietnam, Indonesia and India in aggregate are a further $100BN. Asia’s total capex is estimated to be 3X Europe’s, even with their hurried move away from Russian supplies.

Some are concerned that this locks in fossil fuel use beyond the time when the UN would like to it phased out – but solar panels and windmills aren’t a practical substitute for the size of energy needs these countries envisage.

Export contracts to cover long distances is how most people think of LNG. So RBN Energy published a fascinating description of the surprisingly widespread use of small scale LNG plants (see Piece By Piece – Small-Scale LNG Plants In U.S. Find Niche Markets At Home And Abroad). Needs vary from providing extra natural gas to meet peak demand to industrial use where natural gas pipeline capacity isn’t available. New England’s well known opposition to new gas pipelines has made them especially reliant on regasified LNG. There are even trucks which use LNG – they’re more expensive to operate than Compressed Natural Gas (CNG), so tend to be used for longer distances with limited opportunities to refill.

Although purists would like us to give up all fossil fuels, pragmatism is leading to a growing acknowledgment that energy transitions, including this one, take decades to play out. Energy security, historically not a European concern, has catapulted up their priorities.

NextDecade, on which we have written several times recently (see NextDecade Sees A Bright Future), and Tellurian, are among the few LNG stocks available for investors who find Cheniere expensive. Wells Fargo believes what they call the, “highly constructive long-term fundamentals” along with limited choices will keep these names well supported.

Concern about high oil and gas prices has even induced the White House to reverse one of their first steps and permit drilling on Federal land. They’ve managed to offend progressives. But by increasing the royalties by half, to 18.75%, they’re still encouraging caution among energy executives. They know the hand of friendship to traditional energy will be withdrawn as soon as prices drop. But even here, pragmatism is supporting the case for natural gas.

We have three funds that seek to profit from this environment:

Energy Mutual Fund

Energy ETF

Inflation Fund

Please see important Legal Disclosures.


LNG Stocks And Real Yields Rise

The energy sector, already responding to inflation in recent months, has been a clear winner from Russia’s invasion of Ukraine. Few countries in history have striven for energy independence as much as America. Having achieved it, the US is now in a position to help Europeans achieve energy security. They have no hope of energy independence, but can at least achieve more diversity of supply.

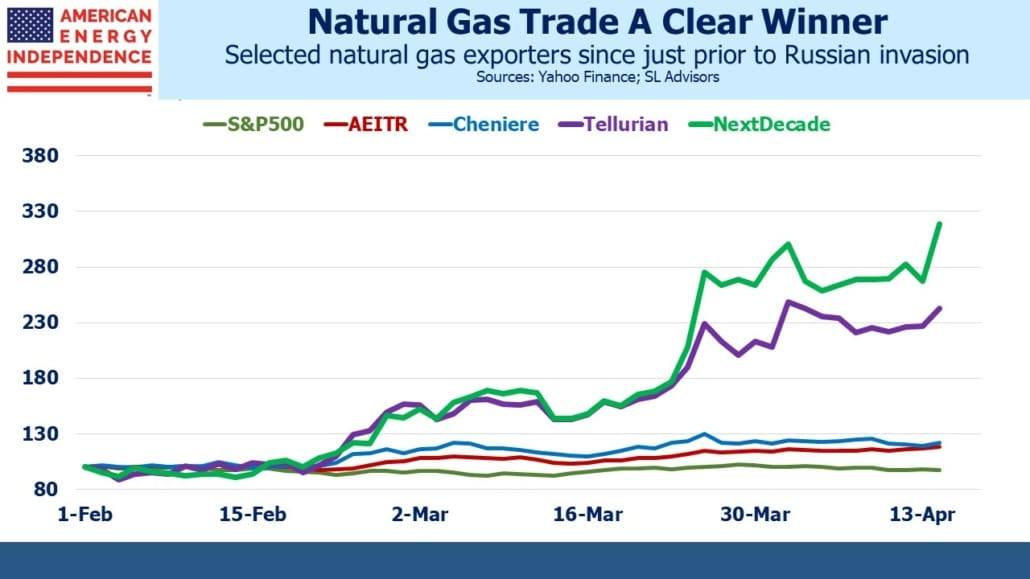
Within the energy sector, natural gas has been a winner and companies involved in exporting Liquefied Natural Gas (LNG) have soared. Tellurian (TELL) and NextDecade (NEXT) both plan to export LNG from facilities that are not yet built. Their odds of acquiring the customers and capital to fulfill their goals meaningfully improved once the EU acknowledged the catastrophe that was its prior energy policy.

It’s rare to see political leaders abruptly forced to pivot. UK PM Chamberlain’s late 1930s appeasement of Hitler was one. It would have been more appropriate if former German chancellor Merkel was still in power so she could publicly abandon the now discredited policy of “Wandel durch Handel” – change through trade.

.avia-image-container.av-299srr2-c9ff7c672083c98193fd190d46358194 img.avia_image{ box-shadow:none; } .avia-image-container.av-299srr2-c9ff7c672083c98193fd190d46358194 .av-image-caption-overlay-center{ color:#ffffff; }

NEXT’s Carbon Solutions division was created as a result of French utility Engie ending LNG discussions in 2019 because of concerns about US flaring. European customers were expected to be the target market for a new offering which captures the CO2 from natural gas processing and liquefaction – especially so now they’re scrambling to find alternatives to Russian supply.

But Asian buyers are moving more quickly. NEXT has recently signed two such deals each worth 1.5 million tons per annum. Meanwhile TELL has begun construction of their Driftwood LNG facility without yet having firm financing lined up – no doubt to demonstrate their confidence that the capital will be available. Of the two, we prefer NEXT. Its business model avoids exposure to natural gas prices, contrasting with TELL which retains some of that risk because they’re bullish on prices. TELL CEO Charif Souki has a healthy risk appetite – two years ago the sector’s collapse led to him being forced to liquidate personal holdings of TELL because of a margin call. The company issued him more shares anyway.

.avia-image-container.av-1ldloxq-2039609a5a0451daea809411d7eade10 img.avia_image{ box-shadow:none; } .avia-image-container.av-1ldloxq-2039609a5a0451daea809411d7eade10 .av-image-caption-overlay-center{ color:#ffffff; }

Revamped European energy policy has provided support for the energy sector at a time when inflation expectations have remained surprisingly well constrained. Ten year inflation as derived from the treasury market moved from 2.5% to just below 3% by early March but has remained there ever since. Real yields have been moving higher – meaning they are less negative – as the market has begun to price in Quantitative Tightening (QT).

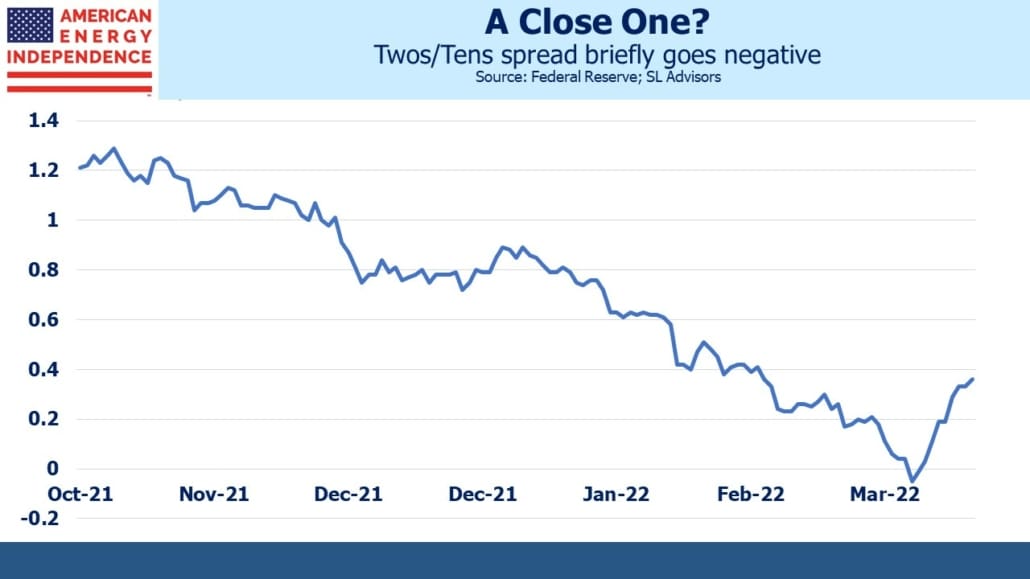
It seems inevitable that the opposite of Quantitative Easing (QE) will be needed when the Fed is trying to achieve the opposite result. The spread between two and ten year treasury yields had briefly gone negative, causing some commentators to warn of an impending recession. Discussion in the Fed’s minutes about the need to shrink the balance sheet helped reverse this.

.avia-image-container.av-13o70ou-1b880a7ab9bc05a3610adfd9aa85d23f img.avia_image{ box-shadow:none; } .avia-image-container.av-13o70ou-1b880a7ab9bc05a3610adfd9aa85d23f .av-image-caption-overlay-center{ color:#ffffff; }

QE reflected the Fed’s recognition that long term rates matter more than the Fed Funds rate. Bill Dudley, former NY Fed president, has noted that the continued relatively low ten year yield means the Fed hasn’t yet achieved much in terms of imposing more restrictive financial conditions. St. Louis Fed president James Bullard worries that they are behind the curve (which hardly needs saying) and suggested a 3.5% Funds rate might be needed.

.avia-image-container.av-tdijge-d7812f90bfb13d06ebab5399daddb3fe img.avia_image{ box-shadow:none; } .avia-image-container.av-tdijge-d7812f90bfb13d06ebab5399daddb3fe .av-image-caption-overlay-center{ color:#ffffff; }

It really depends on what it takes to get ten year yields higher. This is the first meaningful tightening cycle since Ben Bernanke conceived QE in 2008. Expect more discussion in minutes and elsewhere about what the Fed can do to push up long term rates. It’s a task made more difficult by negative real yields – a persistent gift from return-insensitive investors to America, that nonetheless mutes the transmission mechanism from the Fed Funds rate to bond yields.

If the Fed opts to shrink their balance sheet more aggressively, by for example auctioning off some of their holdings of mortgage backed securities, the resulting increase in bond yields would mitigate some of the need to drive up short term rates.

Hence the eurodollar futures curve lost some of its inversion recently. It’s still priced for the Fed to finish tightening by the end of next year and then begin lowering rates in 2024. Given this Fed’s reinterpreted dual mandate, it’s likely they’ll be acutely sensitive to the possibility of a recession. Since QT has never been done, it promises to be a learning experience for everyone.

We have three funds that seek to profit from this environment:

Energy Mutual Fund

Energy ETF

Inflation Fund

Please see important Legal Disclosures.


Energy Independence Is Not Just For America

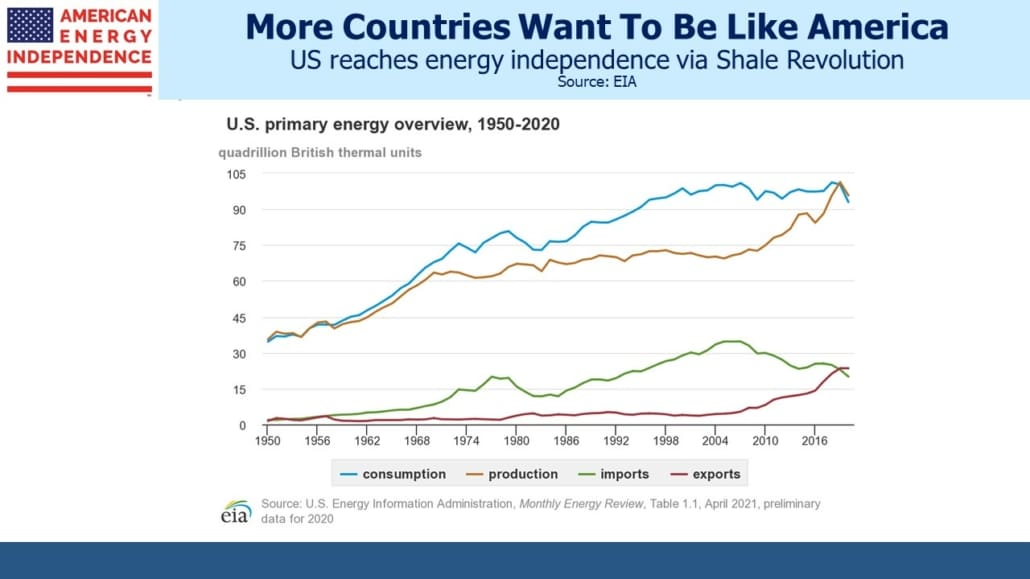
In the US, energy independence has been a sought after goal for generations. Ever since the 1973 Arab oil embargo in response to the Yom Kippur War, US presidents have spoken out in favor of reducing our dependence on foreign oil – notably OPEC. There are several definitions of energy independence — The definition of independence. Traditionally it’s applied to crude oil because of the iconic photos of American drivers sitting in gas lines in the 1970s. A broader and more accurate definition combines all primary energy into British Thermal Units (BTUs) and calculates that trade balance. By this measure the perennial quest for US energy independence was finally achieved, in 2019. Thanks to the Shale Revolution and fracking, we now produce more energy than we consume.

Few other countries have been as focused on energy independence. Some, such as Germany, in hindsight embraced energy dependence in a catastrophic effort to draw Russia closer through trade ties.

.avia-image-container.av-r3ev4i-775daf480e5788e544a9295bd707717f img.avia_image{ box-shadow:none; } .avia-image-container.av-r3ev4i-775daf480e5788e544a9295bd707717f .av-image-caption-overlay-center{ color:#ffffff; }

Russia’s invasion of Ukraine has elevated energy independence as a pillar of national security. Germany might be the most connected to Russia, and therefore the most vulnerable. They hurriedly abandoned their previous strategy and announced their intent to drop Russian oil and gas imports just as soon as they can be replaced. Since Russia knows its gas trade to Germany is on borrowed time, it’s a good bet the flows will stop when Russia chooses and not when Germany is ready. It’ll provide a further lesson to everyone on the importance of diversified sources of energy.

Hydraulic fracturing (“fracking”) is almost exclusively a US practice. We listed the reasons in a blog six years ago (see Why the Shale Revolution Could Only Happen in America). The right type of rock, plentiful water and availability of capital are among the most important reasons. Less appreciated is America’s unusual form of property ownership in which mineral rights often belong to the owner of the land beneath which those minerals lie. We haven’t come across another country with anything similar. This makes it easy for private companies to partner with landowners to extract oil/gas and share the profits.

In the UK, like most countries, the government owns mineral rights. So when Cuadrilla set out to frack beneath the land of Lancashire in northern England, their activities quickly became a political issue since the government was approving exploitation of a resource they owned.

Cuadrilla’s efforts quickly ran into bitter local opposition, and in 2019 the British government finally bowed to public pressure (see British Shale Revolution Crushed: America’s Unique Ownership of Oil and Gas).

Cuadrilla’s two wells are due to be capped for good soon. But UK PM Boris Johnson responded to the Russian invasion by promising a revised “energy supply strategy” that would be more reliant on domestic energy resources. Britain was importing Russian Liquified Natural Gas (LNG), so can at least source elsewhere with America an obvious beneficiary. Meanwhile, Cuadrilla is now making a last-ditch attempt to revive their efforts.

Rethinking energy security isn’t limited to those countries that buy directly from Russia. Argentina’s Vaca Merta (“dead cow”) shale rock formation is the world’s second biggest shale formation for natural gas (behind the Marcellus shale in the northeast US). Argentina has struggled to develop this resource, but just announced a new concession to Chevron as part of a 282 sq km area area they hold rights to.

Greece has announced plans to speed up gas exploration in order to reduce their reliance on Russia, and hopes to do their first test drill in two decades by the end of next year.

Israel has reached gas independence thanks to resources in the eastern Mediterannean, and now provides natural gas to neighboring Egypt and Jordan. They see opportunities to export to the EU as it drops Russian supply.

India is planning to increase domestic coal production – both to meet growing internal demand but also to lessen its reliance on foreign supply. Indonesia, Australia and South Africa are the country’s largest suppliers, and together account for over 90% of coal imports.

The consequences of the war in Ukraine are being felt all around the world. The virtual cessation of global trade with Russia has caused many governments to reassess their vulnerability. Israel has fought wars against its neighbors and is in a hostile neighborhood. India probably worries about more strenuous efforts to reduce CO2 emissions impeding the trading of coal, on which their power sector relies heavily.

All of a sudden, energy independence is not just for America even though it’s been a goal almost since Saudi Arabia discovered oil. Every country is or will assess their vulnerability to disruption of imports. Diversity of supply is now vital. New pipelines will only link countries that have very high confidence of stable relations (ie US/Canada).

The US is an attractive trade partner in a world that is looking for more LNG. American energy independence is set to help other countries achieve the same for themselves.

We have three funds that seek to profit from this environment:

Energy Mutual Fund

Energy ETF

Inflation Fund

Please see important Legal Disclosures.


The Fed’s Yield Curve Problem

What’s the best shape for the yield curve? Today’s flat verging on inverted shape isn’t optimal. It suggests the market is worried that the Fed will tighten too much, causing a recession. It also makes it hard for banks to make much money extending credit, because they typically lend for longer maturities while funding themselves at the short end. With no curve there’s no positive carry.

But a curve can be too steep as well. If the market was worried that the Fed was going to be inattentive to inflation, long term yields would rise relative to the short end. In some respects the yield curve is a measure of confidence in the Fed’s execution of its mandate. A curve that’s positive without reflecting runaway inflation – a Goldilocks curve – reflects confidence in the future. A ten year treasury yield 2-4% above the Fed Funds rate might be that ‘not too hot not too cold” happy medium. It’s occurred to me that the Fed could do worse than adopt a strategy of maintaining a Goldilocks curve – adjusting the Fed Funds rate in response to changes in long term yields. If they maintained the spread between the ten year note and Fed Funds at 2-4%, they’d be setting monetary policy based on what financial markets are recommending.

A strategy of targeting a constant slope to the yield curve is made more complicated by the presence of so many return-agnostic buyers in the US treasury market. Negative real yields distort the expectations message the bond market would otherwise transmit. As long as there are foreign central banks, sovereign wealth funds and pension funds insistent on holding assets even if they destroy value in real terms, long term treasury yields present a distorted view of the market’s outlook for inflation.

.avia-image-container.av-17z8ald-89249701ec8abc59a9000cdf497c1ee3 img.avia_image{ box-shadow:none; } .avia-image-container.av-17z8ald-89249701ec8abc59a9000cdf497c1ee3 .av-image-caption-overlay-center{ color:#ffffff; }

The Fed has added to this by inflating their balance sheet – former Fed chair Ben Bernanke showed the world how Quantitative Easing (QE) could be non-inflationary if practiced correctly, as it was during the 2008-09 Great Financial Crisis (GFC). Current chair Jay Powell made it part of the Fed’s toolbox when Covid caused a recession. QE was really a one-off tool to help unfreeze financial markets, but we can now assume that it will be used whenever the Fed is facing a recession.

The economy is more responsive to long term yields than the Fed Funds rate. Most residential mortgages are fixed rate. Corporate capital spending is partly financed with bond issuance. The Fed is trying to make financial conditions less accommodative, but even though their own forecast is for the Fed Funds rate to reach nearly 3% by late next year, ten year treasury yields remain stubbornly low at around 2.7%, a level that hardly translates into tight monetary conditions.

The Fed is part of the problem, because Covid QE saw their balance sheet grow to $9TN. Recognizing the importance of long term yields on economic activity, they bought bonds to push yields down. The Fed only just stopped adding to their balance sheet last month.

Having decided to operate directly in the bond market to lower yields during a recession, it’s logical for the Fed to take steps to increase bond yields when trying to slow growth – such as now.

The release of minutes last week showing the Fed intends to reduce their balance sheet by $95BN per month drew much attention. But it’s not that impactful. The Fed has $1.1TN of securities with maturities of under one year, so their planned monthly reduction simply amounts to letting these securities roll off and not reinvesting the proceeds. But even if the Fed decided to auction this $1TN in short maturity securities it would have little impact, because the Fed targets a rate for Fed Funds and buys/sells short term securities to achieve their desired rate.

.avia-image-container.av-x2ehnl-eecade6c72dac88e9f3798cf7871a406 img.avia_image{ box-shadow:none; } .avia-image-container.av-x2ehnl-eecade6c72dac88e9f3798cf7871a406 .av-image-caption-overlay-center{ color:#ffffff; }

A meaningful reduction in the balance sheet would involve selling long term securities, especially the $2.6TN in Mortgage Backed Securities (MBS) with maturities of ten years and longer. The minutes make clear that the FOMC is uncomfortable with the current balance sheet size and wants to reduce it faster than following the GFC without being disruptive. They also need long term rates higher to as to tighten financial conditions.

Former Federal Reserve Bank of New York President Bill Dudley says the Fed “hasn’t really accomplished much yet” with its efforts to control inflation, and will need to tighten financial conditions to push bond yields higher and stock prices lower. “If financial conditions don’t cooperate with the Fed, the Fed’s going to have to do more until financial markets do cooperate,”

The opposite of QE means selling long term bonds. It’s hard to see how the Fed could auction their holdings of US treasuries without complicating the US Treasury’s always ample schedule of new issuance. But MBS auctions would be less problematic and look inevitable; a necessary step to cool a hot housing market that the Fed’s earlier buying of MBS helped create.

Nobody wants a flat yield curve. The Fed will likely conclude a steeper curve is a necessary element of their effort to curb inflation. Mortgage rates have probably bottomed for good.

We have three funds that seek to profit from this environment:

Energy Mutual Fund

Energy ETF

Inflation Fund

Please see important Legal Disclosures.