Why Liberal States Pay Up For Energy

The northern hemisphere winter is approaching, which means more opportunities for amusement or shock at New England’s masochistic energy policies. Massachusetts and neighboring states have denied themselves access to abundant US natural gas in the Marcellus shale in Pennsylvania by preventing the construction of new pipelines that would connect them. As with most initiatives embraced by climate extremists, this one rests on the questionable belief that making it harder to use natural gas for power generation will somehow shift demand to renewables.

The US Energy Information Administration (EIA) is forecasting a 7.5% increase in the retail price of electricity this year. However, the pain of higher energy prices will not be spread evenly. Eversource Energy, a New England based utility with about four million customers, recently more than doubled rates from 10.67 cents per Kilowatt Hour (KWh) to 22.57 cents per KWh.

The New England Independent System Operator (ISO) reports that last year natural gas represented 46% of the energy used to generate electricity, above the US average of 38%. Liberal politicians in Massachusetts and neighboring states may be hoping that preventing new natural gas pipelines will somehow reduce its consumption, but instead shipments of Liquefied Natural Gas (LNG) are covering the shortfall. On its website the ISO notes that following the shale revolution, “… natural gas generators became the go-to resource for New England.” Not sharing politicians’ zeal to impede access to reliable energy, the ISO warns, “… we are finding that during severe winter weather, many power plants in New England cannot obtain fuel to generate electricity.”

In August Boston took delivery of its tenth LNG shipment of the year, bringing their seaborne imports to 16 Billion Cubic Feet. They have to compete with strong demand from European buyers, where LNG prices have been as much a 10X the US Henry Hub benchmark, currently around $8 per Million BTUs (MMBTUs). If Boston paid a mere $30 per MMTBU premium, that’s almost $0.5BN more in expense than if they were able to access this supply domestically.

Customers in New England are used to paying more than the US average for electricity. Retail sales of electricity in Massachusetts are around 50 Million Megawatt Hours annually. The average US price is 10.19 cents per KWh. In Massachusetts it’s 18.19 cents.

CO2 emissions have fallen over the past decade across the US to around 5.2 Gigatons (2019), down by 4.4%. Coal to gas switching is the biggest driver. Massachusetts has done a little better, lowering emissions by 7 million tons or about 10%.

If we assume that residents of the Bay state are paying an extra 5 cents per KWh for their electricity to achieve this CO2 reduction, that works out to $2.5BN in added expense. Divided by the 7 million tons of reduced CO2 means Massachusetts is spending $357 per ton.

This is an astronomical amount. The recently passed Inflation Reduction Act provides tax credits of $80 per ton for CO2 that is captured and permanently sequestered underground. Exhaust from ethanol production generates high concentrations of CO2, which makes this a likely use for the tax credit. Direct Air Capture, which pulls CO2 out of the ambient air where it exists at around 412 parts per million, will earn a $180 tax credit for its permanent storage underground.

CO2 tax rates in Europe vary widely. France is €45 per ton ($45) and Sweden is the highest at €117.

Surveys tend to reveal that support for public policies aimed at reducing greenhouse gas emissions is broad but shallow. Gasoline prices have been rising for most of the Biden administration. Global investment in new oil production remains too low to maintain supply at current prices. E&P companies recognize the impediments to new production represented by environmental extremists and left-wing energy policies. Together they have succeeded in driving pipeline sector free cash flow yields to over 10% because new pipeline construction is much less common. As I often say, if you meet a climate extremist, give them a hug and drive them to their next protest.

The Administration has been emptying out the Strategic Petroleum Reserve in recognition that high prices at the pump have political downside. For the same reason, a US carbon tax has never commanded much support even though it would cause more efficient capital allocation.

But there are clearly some parts of the US with a greater tolerance for higher energy prices if perceived to be in support of emissions reduction. New England’s energy policies present an example of what to avoid for many of us, but utility bills aren’t becoming a political issue.

Annual CO2 emissions in California fell by 12 million tons (2009-19), a 3.3% reduction. Assuming Californians are also paying 5 cents per KWh for this achievement, that works out to a stunning $1,042 per ton, along with an inadequate grid that recently asked Tesla owners to refrain from charging their cars.

Climate extremists could point to both these states as evidence that consumers will accept higher energy prices in support of their policies. Or they may calculate that the very high price per ton of CO2 some consumers are paying will draw unwelcome attention to the results of liberal energy policies.

.avia-image-container.av-wn7yeo-890e7f512870722a278a356f1e237d2d img.avia_image{ box-shadow:none; } .avia-image-container.av-wn7yeo-890e7f512870722a278a356f1e237d2d .av-image-caption-overlay-center{ color:#ffffff; }

Both states have found that impeding natural gas consumption leads to unexpected difficulties – either LNG imports to Boston or the risk of power cuts in California. Natural gas is hard to beat. It’s displaced a lot of US coal production, including in Newburgh, IN where a strip mine formerly operated by Peabody Coal is now the bucolic Victoria National Golf Club. The energy transition is good.

We have three funds that seek to profit from this environment:
Energy Mutual Fund

Energy ETF

Real Assets Fund

Please see important Legal Disclosures.


The Fed Is Misreading Housing Inflation

The August CPI report that came out last Tuesday was the catalyst for a sharp market reversal. The headline number was a benign 0.1%, helped by falling gasoline prices. But the “core” number (ex food and energy) came in at 0.6%.

There were several factors, but chief among them because of its high weighting was shelter at 0.7%. which has a 32.3% weighting in the CPI. Food is 13.5% energy is 8.8%. When these two are removed to create the core figure, shelter’s weighting rises to 39.8%.

Within the core CPI number, Shelter is made up of Rent (9.3%) and Owners’ Equivalent Rent (OER, 30.5%), on which we have written before (see Why You Can’t Trust Reported Inflation Numbers). Two thirds of American households own their home. But the economists at the Bureau of Labor Statistics (BLS) want to separate out the service that a home provides (shelter) from its value as an asset.

To estimate OER, BLS statisticians survey homeowners to ask what they think they could rent their home for in the current market. The huge problem with this approach is that few of us give the matter much thought. Homeowners generally know what their home is worth, but you won’t hear cocktail chatter about how the imputed rent on one’s townhouse suddenly shot up.

Home ownership is the prevailing choice of shelter in America. Therefore, OER has a substantial weight in the BLS assessment of living costs, even though uniquely within the CPI it’s not based on cash transactions.

The shortcomings in OER are about to complicate monetary policy.

In theory, if home prices are rising this should cause rents, including the OER, to rise as asset owners seek to maintain their return on investment.

Everyone outside the BLS knows real estate has been hot. Home buyers have regularly been required to pay over the asking price to get a deal done. The S&P/Case-Shiller U.S. National Home Price Index (C-S) has reflected this, increasing year-on-year at 18% as of June (the most recent figure available).

There are signs that the tight real estate market is moderating. The C-S index was rising at 20.6% in March and April. By contrast, OER is now rising, although as the long-term chart shows it fluctuates less than home prices.

But what’s really interesting is that OER is a lagging indicator. From 2000-2020 one year returns on C-S and OER have a correlation of only 0.35. Lagging OER improves the fit, and it turns out the 18 month lagged OER has a correlation of 0.75 with C-S.

.avia-image-container.av-owcin4-8fb6d76ad620cafc1537dc4f95f5b549 img.avia_image{ box-shadow:none; } .avia-image-container.av-owcin4-8fb6d76ad620cafc1537dc4f95f5b549 .av-image-caption-overlay-center{ color:#ffffff; }


The reason is likely that home owners are slow to convert changes in home prices into revised OER, because OER doesn’t affect them. Nobody pays OER. It takes over a year of rising (falling) home prices to show up as an increase (decrease) in OER. Homeowners have a slow reaction function. Inconveniently for the BLS, most of us just don’t think much about renting out our home.

This highlights a significant weakness in how the Fed assesses inflation. The rise in OER they’re observing today is a delayed reaction to the rapid house price appreciation the rest of us have been watching since the beginning of the pandemic in early 2020. Back then, the Fed didn’t see housing inflation because OER didn’t reflect it. Belatedly, it is showing up in the CPI.

Because the history of OER shows it reacts to home prices with a substantial lag, this means the shelter component of CPI is likely to look worse in the months ahead. Its large weight in the core CPI will keep this measure elevated. In this respect, it’s fair to say that the Fed is fighting the last war. In their public comments FOMC members have been very clear that they are looking for a sustained drop in inflation. It was higher than they thought six months ago, if not for the lagged feature of OER.

The fact that inflation expectations remain surprisingly moderate doesn’t appear to be an important consideration.

Core CPI is unlikely to fall substantially while OER is rising. Although the Fed prefers the Personal Consumption Expenditures deflator because of its dynamic category weightings, OER is used there too.

The inverted yield curve for interest rate futures makes more sense when you consider the slow reaction function of OER survey respondents. As long as the Fed uses this measure of housing, they’ll be relying on an echo of the past rather than real time. Based on the historical relationship between C-S and OER, the shelter component of the inflation statistics likely won’t peak for another year. It means the Fed is more likely to make the mistake of maintaining high rates for too long by relying on stale inflation data for shelter.

Only an economist could love OER. It’s about to play an outsized role in monetary policy for all the wrong reasons.

We have three funds that seek to profit from this environment:

Energy Mutual Fund

Energy ETF

Real Assets Fund

Please see important Legal Disclosures.


Another Pleasant Suprise From Cheniere

On Monday evening Cheniere provided their third revised EBITDA guidance of the year. It’s good that they’re not based in the EU where they would be a target of the planned windfall profits tax. Cheniere has raised guidance by $1.2BN (after 1Q earnings), $1.6BN (after 2Q earnings) and now another $1.2BN pointing to a range of $11.0-11.5BN.

Cheniere now plans to direct around 40% of Distributable Cash Flow (DCF) to shareholder returns, including a 20% dividend hike and an expected 10% growth rate in the future. European LNG demand has helped push margins higher. 2022 is turning out to be an exceptional year and the company is guiding for EBITDA in subsequent years around $7BN, although some analysts believe that is conservative. Their long term “take-or-pay” contracts provide almost 20 years of cash flow visibility. We are long-time investors in Cheniere

The news from Cheniere provided a pleasant distraction from the inflation numbers for energy investors. The core CPI number (ex-food and energy) was sharply higher than expected at 0.6%, well above July’s 0.3% figure. Inflation expectations have remained surprisingly constrained over the past couple of years. Ten year inflation expectations as derived from the treasury market are 2.4%. However, the Fed will worry that stubbornly high inflation will become embedded in consumer expectations. In our opinion savers should plan on a higher inflation rate when assessing their retirement outlook.

.avia-image-container.av-1a80u1c-e7912a4a5a2be098df80be6ef795c3fa img.avia_image{ box-shadow:none; } .avia-image-container.av-1a80u1c-e7912a4a5a2be098df80be6ef795c3fa .av-image-caption-overlay-center{ color:#ffffff; }

The resilience of midstream energy infrastructure compared with the S&P500 reflects the explicit inflation linkage many pipelines offer (usually via the Producer Price Index). We think it’s an excellent component of any equity portfolio.

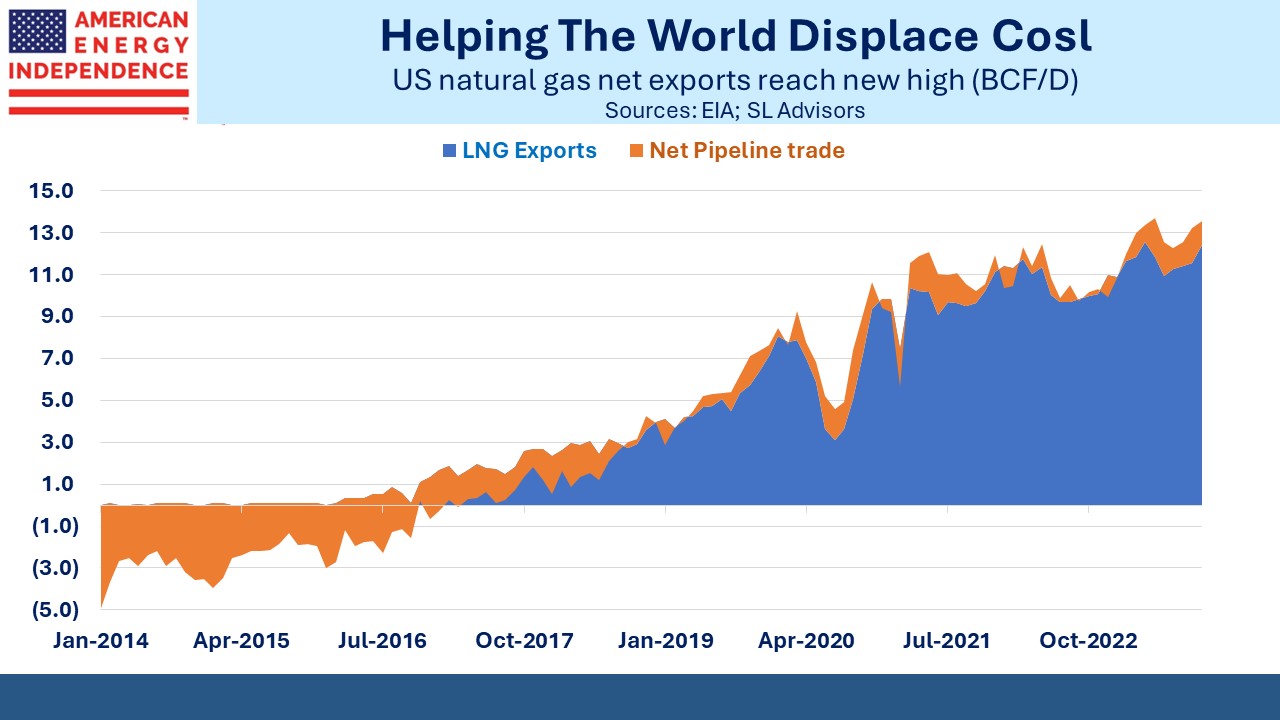
The US exports around 11 Billion Cubic Feet per Day (BCF/D) of Liquefied Natural Gas (LNG). This will rise modestly over the next couple of years to around 13 BCF/D, but may increase sharply beyond that depending on which projects can sign enough long term contracts to reach a Final Investment Decision (FID).

There are few pureplay LNG export opportunities available beyond Cheniere. NextDecade (NEXT) and Tellurian (TELL) are both early-stage companies with plans to build facilities over the next few years. Of the two we prefer NEXT for its superior governance, but both companies will likely draw increased interest as investors consider other companies that may emulate Cheniere’s success.

The collapse in Russia’s exports of natural gas (methane) to western Europe highlight the expense involved in transportation. Methane moves by pipeline or LNG tanker. Russia invested billions of roubles in the infrastructure to support Nord Stream 1 and 2. These pipelines have no alternative use. Although China is an obvious alternate buyer, more billions of roubles will be required to build the necessary infrastructure. Moreover, as noted in an FT article, China will be a difficult customer. No country wants to be overly reliant on a neighbor for energy. Fixed infrastructure that straddles national borders, such as pipelines, will increasingly require the near-certainty of stable relations. The post-Ukraine world is one where energy supplies can be leveraged for political gain. Energy security makes imported seaborne natural gas in the form of LNG a more flexible alternative, even if it costs more. Consequently, global demand for LNG is likely to benefit from this type of geopolitical analysis. The US is well positioned to benefit.

.avia-image-container.av-ouk7tc-b5a5e81aa7604d0cdd7bae93ae643049 img.avia_image{ box-shadow:none; } .avia-image-container.av-ouk7tc-b5a5e81aa7604d0cdd7bae93ae643049 .av-image-caption-overlay-center{ color:#ffffff; }

The US Energy Information Administration (EIA) recently announced that 24% of US electricity generation came from renewables during 1H22. It’s hard to share their enthusiasm for this milestone, since it comes with unreliability and higher prices (see California and Germany). The EIA noted that both hydro and wind, which are the majority of renewables, provide more output in the first half of the year than the second. In the case of hydro it’s because of melting snowpack. Wind evidently has its own seasonality as well. Over the past twelve months renewables are 16%, up 2% year-on-year.

Although it’s politically correct to celebrate increased use of renewables, the dominant story about US power generation for at least the past decade has been the switch away from coal. Since 2012 natural gas has gone from 28% to 38% of our electricity. Over the same period coal has dropped from 39% to 21%. Hydro and nuclear have each dropped slightly, by 1%, and renewables have increased by 10%.

It’s also interesting to see that electricity demand has barely grown over the past decade, reflecting improving energy efficiency across our economy.

The EIA has noted in the past that most of America’s drop in greenhouse gas emissions is the result of coal to gas switching. Natural gas remains the most interesting story in the energy markets.

We have three funds that seek to profit from this environment:
Energy Mutual Fund

Energy ETF

Real Assets Fund

Please see important Legal Disclosures.


The Strong Fundamentals Underpinning Pipelines

Recently a long-time investor Jeff Waters suggested that it might be interesting to dig a little deeper into the valuation metrics that make midstream energy infrastructure such an attractive sector. It resulted in a podcast interview, which you can access here.

The roughly 2/3rds drop in growth capex since 2018 underpins an improving cash flow story. The components of the American Energy Independence Index (AEITR) have a market-cap weighted Free Cash Flow (FCF) yield of 10%. This is almost 2X the dividend. Longtime MLP investors will recall the common practice whereby MLPs paid out 90% or more of their Distributable Cash Flow. This left very little room for error.

Since 2016 the payout on the MLP-dedicated Alerian MLP ETF (AMLP) is down by half. Corporations have done better because they generally have higher coverage. Today’s pipeline CFO is building in plenty of cushion to protect payouts even in a steep downturn, which is why dividend hikes and buybacks are becoming more common.

JPMorgan just published a slide deck titled, “North America Long + World Short Hydrocarbons = Logistics Tailwinds.” An already positive outlook improved with Russia’s invasion of Ukraine in February. There is no plausible scenario in which Europe restores its reliance on Russian natural gas. The US has ample supplies available at low extraction costs. LNG exports will grow as fast as new facilities can be built.

The table below highlights some of the metrics which illustrate why we believe pipelines still have plenty of upside. For example, the sector’s 9X EV/EBITDA is more than 1.0X below the average since 2019. Returning to the mean would generate at least 15% capital appreciation.

.avia-image-container.av-13mpgab-d5a10eea8a5f6541ca6a2ea17839b3de img.avia_image{ box-shadow:none; } .avia-image-container.av-13mpgab-d5a10eea8a5f6541ca6a2ea17839b3de .av-image-caption-overlay-center{ color:#ffffff; }

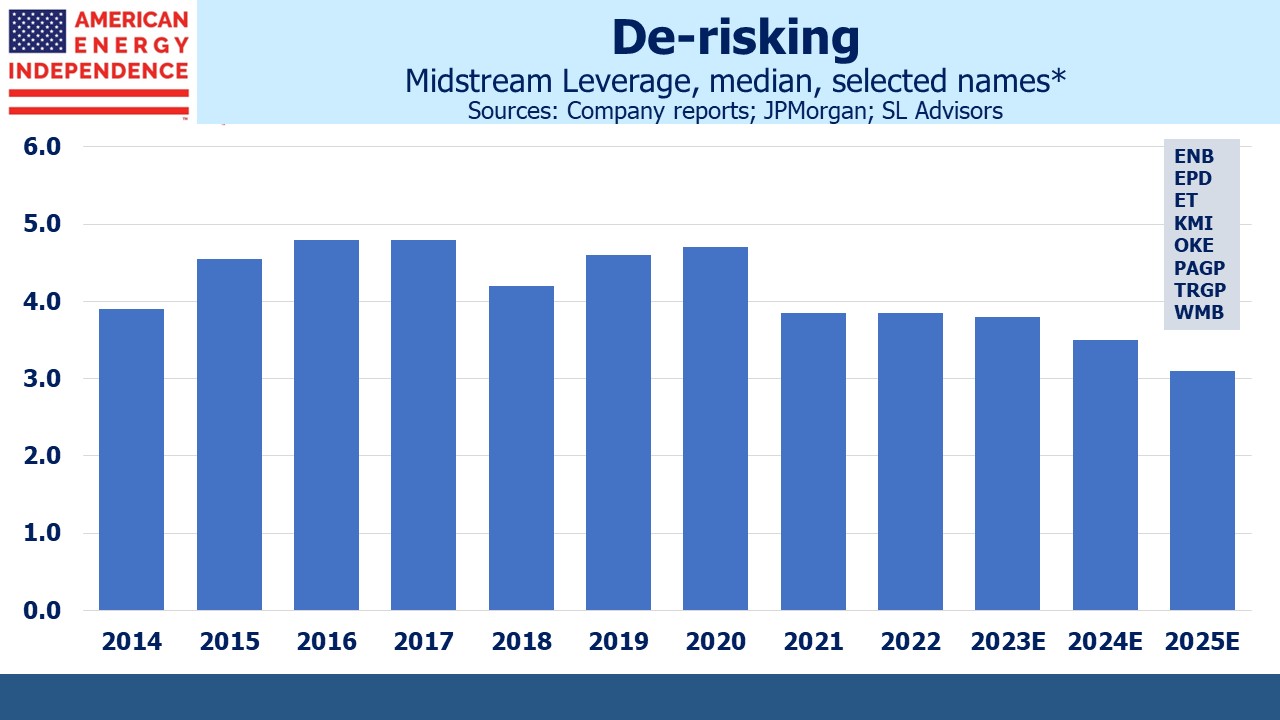
Investment grade Debt:EBITDA leverage of 3.5X continues to trend lower. Five years ago Kinder Morgan argued unsuccessfully to rating agencies that >5X was justified because of their diverse set of businesses. The industry has embraced a more conservative operating model.

It’s also worth remembering the driving force behind increased global energy demand – rising living standards. The chart below is several years old, but still neatly illustrates the close relationship between living standards and energy use. America’s per capita consumption may not be what the world should emulate, but there is no doubt that billions of people want to move up and to the right. This will endure as the dominating force in energy markets for decades to come, overwhelming rich countries’ desire for reduced greenhouse gas emissions. The last couple of years have exposed the inadequacy of extreme green policies followed in the EU and certain US states. Once again Californians are enduring a heatwave with insufficient power capacity.

.avia-image-container.av-u90dyr-b1f0795643312f41efd77844e5fc6c17 img.avia_image{ box-shadow:none; } .avia-image-container.av-u90dyr-b1f0795643312f41efd77844e5fc6c17 .av-image-caption-overlay-center{ color:#ffffff; }

Carrie Bentley, a former policy official with the California Independent System Operator, said California had allowed too much fossil fuel capacity to be shut down without adequate renewable sources and large-scale back-up batteries. She admitted, “We retired too many gas plants too early.”

A reassessment of extreme climate policies should work to the benefit of natural gas by increasing its substitution for coal burning power plants.

Elizabeth The Great

So said ex-PM Boris Johnson in his moving eulogy to the British House of Commons on Friday. King Charles III referred to “a promise with destiny kept.” I have felt a surprising sadness at Queen Elizabeth II’s passing, similar perhaps to losing a distant but benevolent aunt. Rarely for me, I have a desire to be in England at this time, an emotion I only previously felt when our team played in the European Cup Final last year at Wembley, London. She was a constant during times of change; queen for my entire lifetime and an apolitical figurehead often when one was most needed.

My grandparents tolerated no criticism of the royal family during my childhood. They remembered then-Princess Elizabeth and her parents enduring the German blitz of 1940 alongside other Londoners. Simon Schama, the erudite writer who chronicles major current events from the perspective of history’s great arc, called Elizabeth, “quintessential Britain; not all of it, of course, but more than the head of state — the heart of the matter, the personification of a common, idealised identity.”

Some Americans will question that hereditary leadership should provoke such sentimentality. I’ve never heard any regrets that George III was dumped in 1776.

But to be a British subject is to embrace the Crown. I live joyfully in America but part of me will always be there.

We have three funds that seek to profit from this environment:
Energy Mutual Fund

Energy ETF

Real Assets Fund

Please see important Legal Disclosures.


Will Energy Price Caps Work?

Few should be surprised that Russia has shut off all natural gas to western Europe, on a timing of their choosing not Germany’s. EU countries and the UK are implementing price controls and residential subsidies in various forms to cushion the blow from electricity prices that have risen as much as 10X over the past year. Italy plans to limit apartment thermostats to 66°F this winter.

Newly minted UK PM Liz Truss is considering a £100BN aid package that might reach £135BN ($155BN), around 5% of GDP. European governments are covering most of the increased cost of energy for households and/or waiving taxes, via loans to providers. The shortfall will be made up through future tax revenue and gradually increasing prices.

For many there is no plausible politically feasible alternative. By subsidizing demand, such policies delay the demand destruction that’s necessary to bring European energy markets into balance. It’s difficult to see governments exiting the subsidy business anytime soon. Since natural gas is often the marginal source of power in most European markets, it sets the price of electricity.

.avia-image-container.av-1md9ko8-6a15308104d503b0b4cbee259e85e55e img.avia_image{ box-shadow:none; } .avia-image-container.av-1md9ko8-6a15308104d503b0b4cbee259e85e55e .av-image-caption-overlay-center{ color:#ffffff; }

This has perversely created windfall profits for renewables businesses, which now face the prospect of a windfall tax across the EU. Ironically, solar and wind power generators are the big winners because their costs haven’t gone up. This ought to create strong incentives to invest in additional renewables capacity, except that’s where the proposed windfall profits tax will fall most heavily. European energy policies are turning into perhaps the biggest public policy failure since World War II. It should be called the Merkel Energy Crisis since Germany’s recently retired chancellor was such a significant architect.

At least Klaus-Dieter Maubach, the CEO of Uniper, Germany’s biggest importer of natural gas, had the honesty to concede that trusting Gazprom to be a reliable supplier and the absence of LNG import infrastructure were both mistakes. In a recent video he noted that wholesale power prices were as much as 20X the level of two years ago. Maubach warned that worse was to come for European customers.

Price caps on Russian crude oil are likely coming, although we think their enforceability will be difficult. Western insurance companies provide coverage on around 90% of seaborne trade, and the G7 plan relies on the threat of withholding such insurance from buyers of Russian crude oil that refuse to comply with whatever price cap G7 imposes.

This seems simplistic. If India wants to buy Russian crude, insurance could be provided by either country. It’s also possible such a move will induce OPEC+ to regard it as interfering with their price setting ability and trim demand. Yesterday they announced a modest reduction of 100K barrels per day.

The bottom line is that western sanctions on Russian energy supplies have so far served to raise prices and enrich Russia.

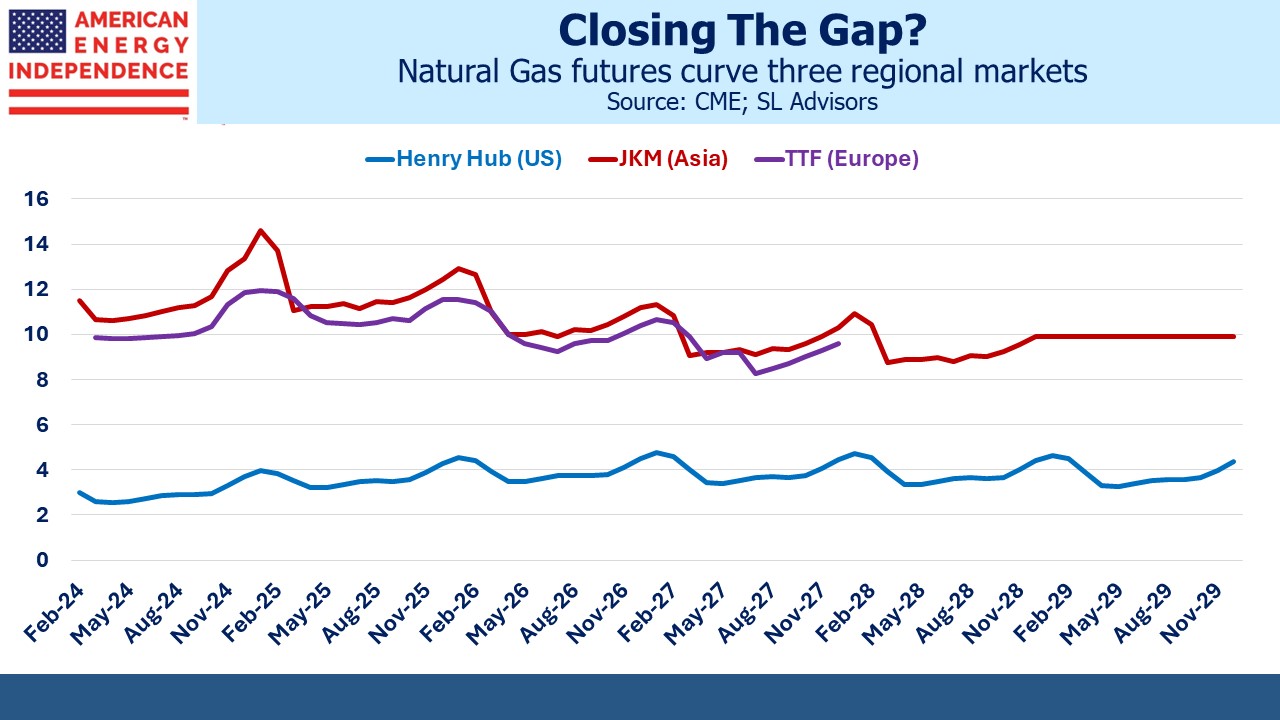
Markets continue to regard developments as positive for the US energy sector. Long term demand for US LNG seems assured. The enormous price difference between the US Henry Hub natural gas benchmark and both the TTF European and JKM Asian ones is likely to prevail for several years given the time it takes to add LNG export capacity.

This should continue to underpin US companies involved in natural gas infrastructure, such as Cheniere, Williams Companies and Energy Transfer. We also still like NextDecade, which is an early-stage LNG exporter we believe will soon start construction on their Rio Grande, TX facility. LNG exports are still some way off for NextDecade so it’s a more speculative holding than most midstream infrastructure companies. But we think the stock has substantial upside from current levels assuming ultimate success.

.avia-image-container.av-14kaaso-43e115eebc371018653befb0a06392f8 img.avia_image{ box-shadow:none; } .avia-image-container.av-14kaaso-43e115eebc371018653befb0a06392f8 .av-image-caption-overlay-center{ color:#ffffff; }

The US isn’t totally immune from poor energy policies. California is once again asking residents to curb power consumption during a heatwave. Years of shutting natural gas power plants has increased the state’s dependence on intermittent solar, an energy source poorly aligned with peak residential demand around dinner time. All while China pumps out ever more CO2.

.avia-image-container.av-vbrpfs-03ac22a5fa7293ff0f06f8ee39395a6f img.avia_image{ box-shadow:none; } .avia-image-container.av-vbrpfs-03ac22a5fa7293ff0f06f8ee39395a6f .av-image-caption-overlay-center{ color:#ffffff; }

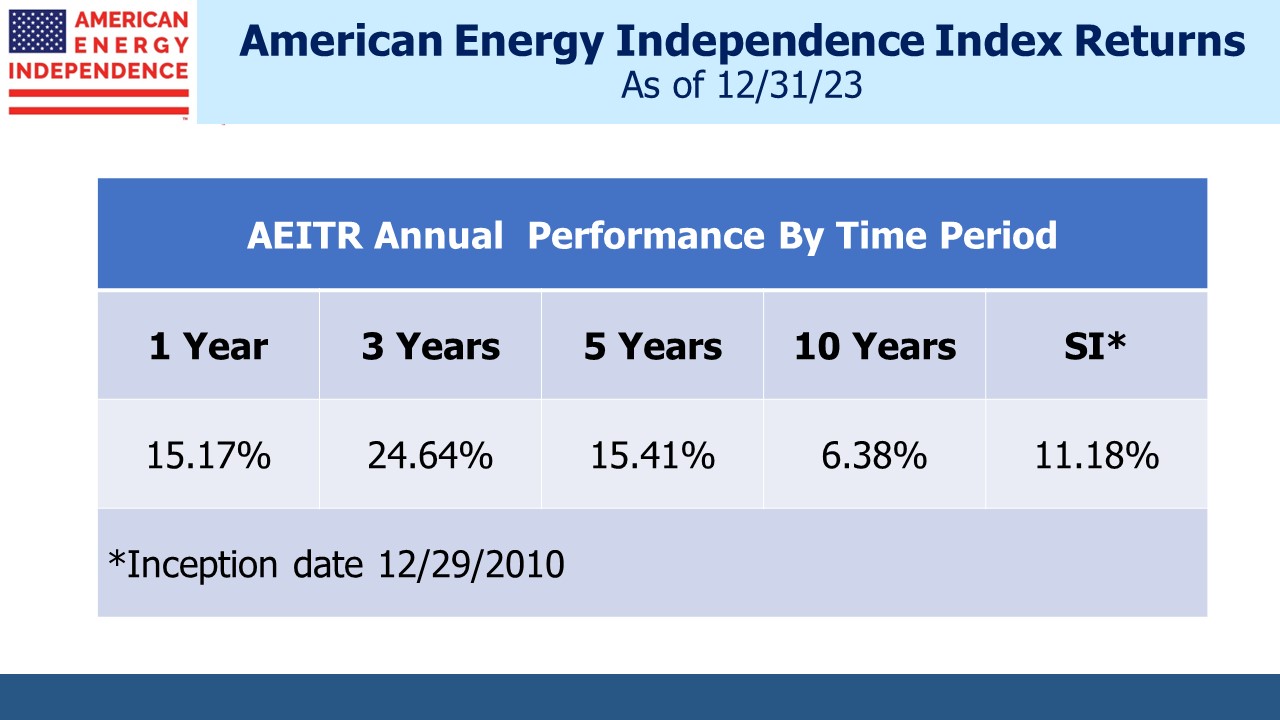
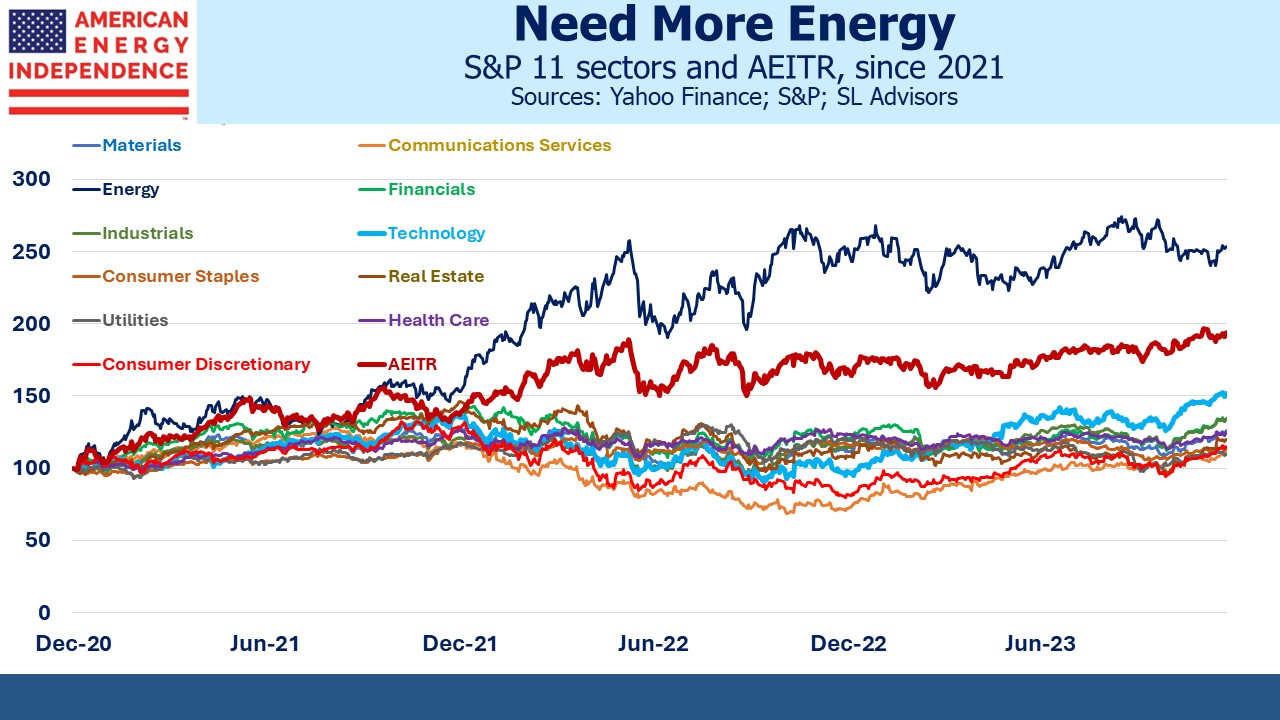
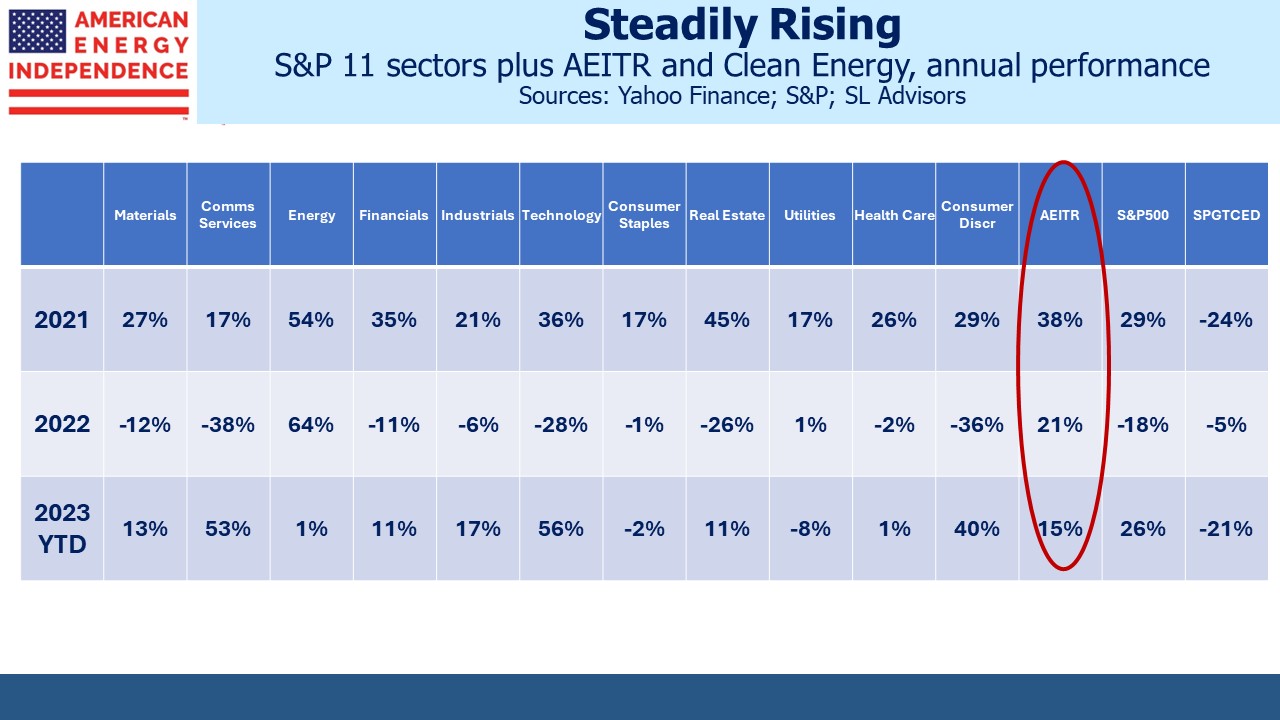
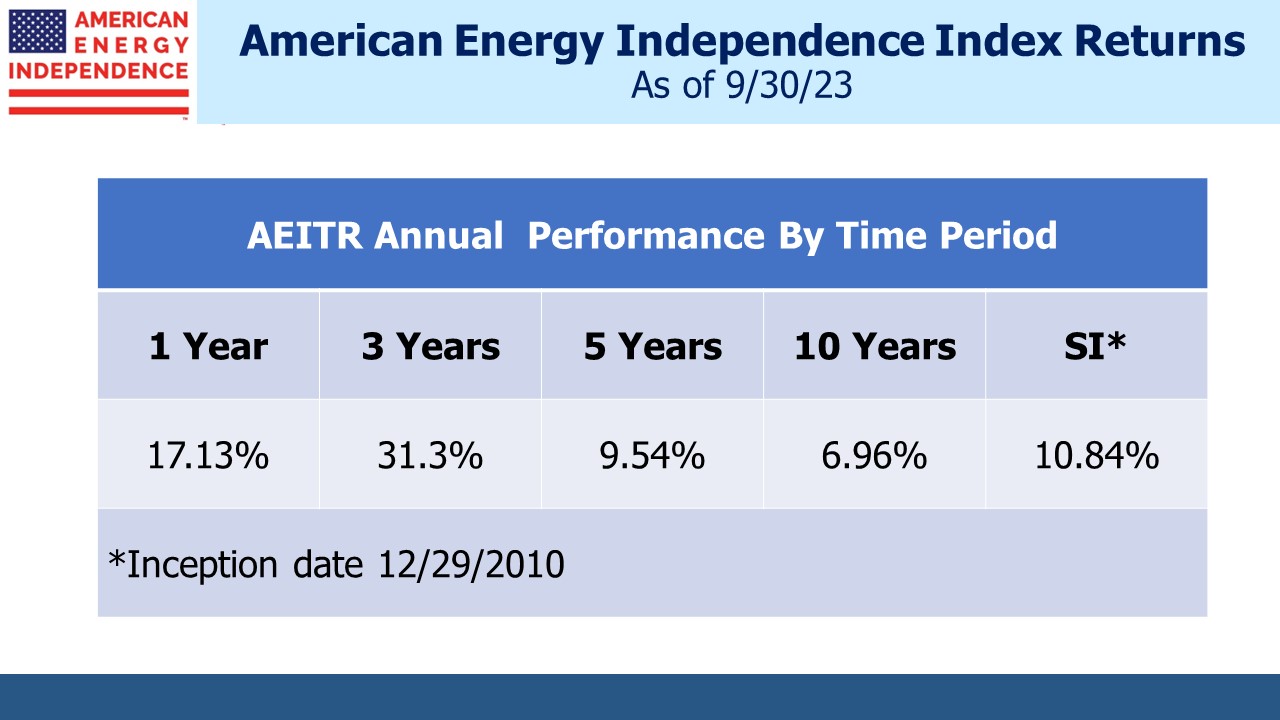
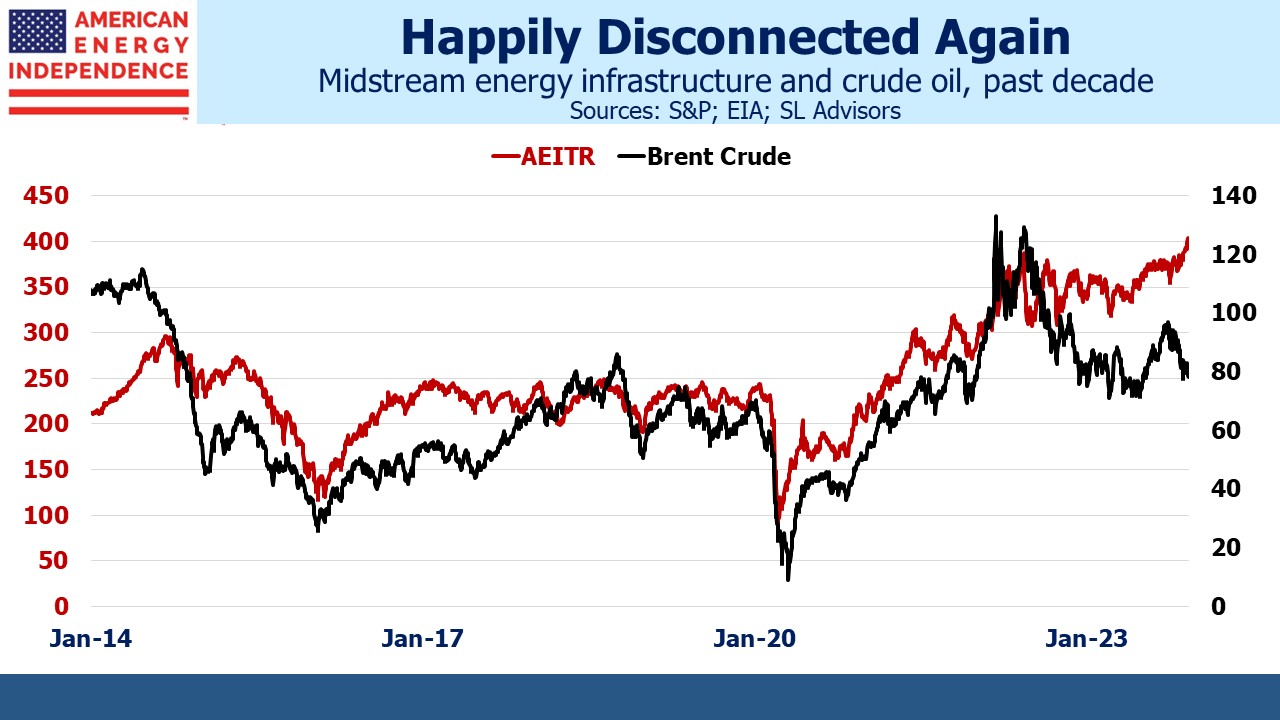
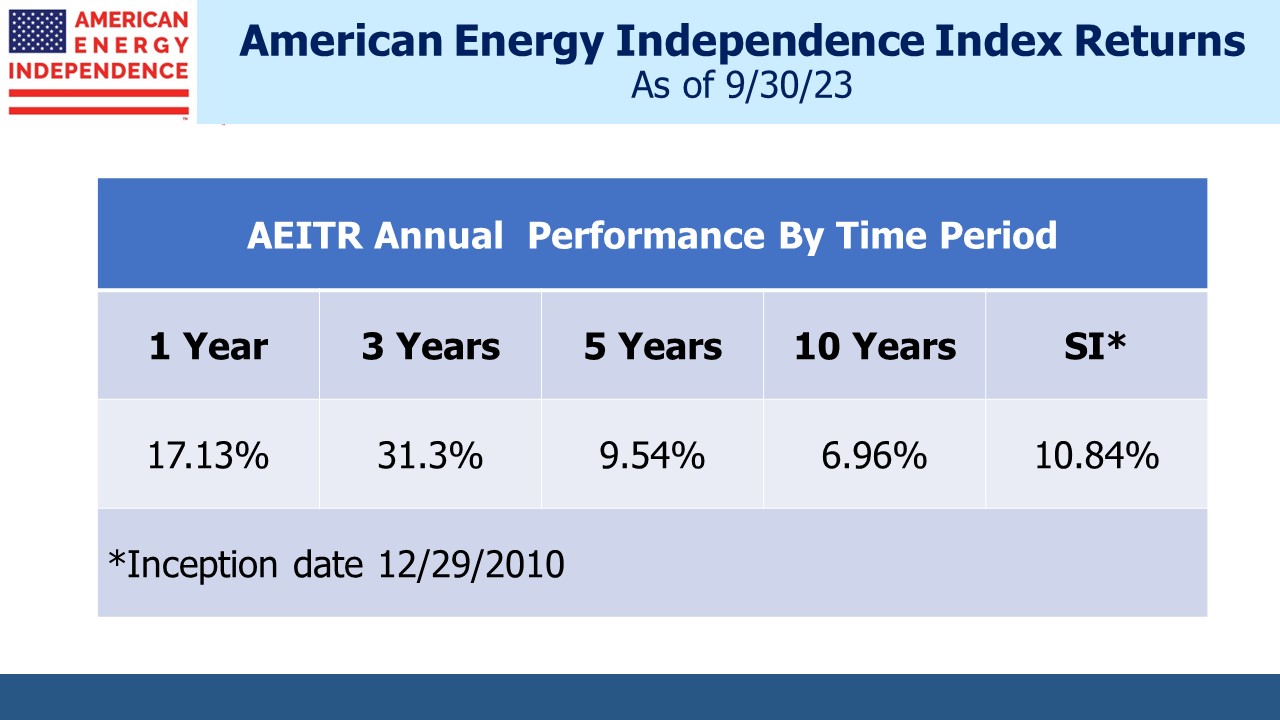
Sell side analysts have been revising down their 3Q earnings forecasts for most sectors over the past couple of months. Energy is the standout exception where the outlook continues to improve. Since the end of 2019 (ie before the pandemic) the American Energy Independence Index (AEITR) has returned 16% pa – solidly ahead of the S&P500 at 9% but still not euphoric.

The components of the AEITR have a market-cap weighted free cash flow yield of 10% and leverage (Debt:EBITDA) of 3.7X. The sector continues to generate growing cashflows with strong balance sheets.

We have three funds that seek to profit from this environment:
Energy Mutual Fund

Energy ETF

Real Assets Fund

Please see important Legal Disclosures.