Chip War – A Review

According to the American Automotive Policy Council, the world’s biggest auto companies can use over a thousand silicon chips in each car. This fact from Chip War: The Fight for the World’s Most Critical Technology resonated more than anything else in this fascinating book about the world’s reliance on computing power. Had I been asked to guess at the figure, I would have offered a few dozen as a ridiculously high number. Who knew? It’s estimated that in 2021, chip shortages resulted in 7.7 million fewer cars being produced.

Author Chris Miller walks us through the early days of computer chips which, like the internet, started with the Federal government. Fairchild Semiconductor, founded by Bob Noyce in 1957, found its first big customer in NASA when Sputnik ushered in the space race.

NASA paid top dollar for Fairchild’s chips, but Noyce recognized that to create a market he needed to slash prices. An integrated circuit priced at $120 in December 1961 was cut to $15 by the following October.

.avia-image-container.av-vi52bi-c468eba45e92225fe001f50b041104d3 img.avia_image{ box-shadow:none; } .avia-image-container.av-vi52bi-c468eba45e92225fe001f50b041104d3 .av-image-caption-overlay-center{ color:#ffffff; }

Demand boomed, and soon the Pentagon was looking at chips to guide its warheads. In 1962 the Minuteman II nuclear missile relied on a guidance computer that used Mylar tape with holes punched in it for instructions. Texas Instruments won the business, and by 1964 had supplied one hundred thousand integrated circuits to the Minuteman program.

By 1972 chips were being used in laser guided bombs which dramatically improved accuracy during the later stages of the Vietnam War. Many readers will remember video from the 1991 Iraq War when US bombs were dropped with precision accuracy on bridges and fortifications. I remember watching one missile drop through a ventilation shaft on the roof of the Iraqi Defense Ministry.

Global sales of semiconductors reached $556BN in 2021, but more amazing is that 1.15 trillion discrete semiconductor units were shipped. That’s around 145 new chips for every person on the planet.

Moore’s Law, that the number of transistors on a chip doubles about every eighteen months, tracked progress remarkably well for several decades but is expected to become obsolete by around 2025.

The world has been grappling with chip shortages since the pandemic. Fabrication factories (“fabs”) are wildly expensive to build and operate highly demanding processes with dust-free zones to manufacture ever more miniaturized chips.

Taiwan has 20% of the global market, and a bigger share in high-end chips. Long-time government support has helped the Taiwan Semiconductor Manufacturing Company (TSMC) build a dominant position. High fixed costs because of the complexities of manufacturing create benefits to scale.

Chips have long been a national security concern, both because of their use in modern weapons and their ubiquity in consumer products. This has led to US-led constraints on China’s ability to buy the most advanced chips as well as legislation to encourage domestic investment in fab plants. Last year Congress passed the Creating Helpful Incentives to Produce Semiconductors and Science Act of 2022 (CHIPS Act).

TSMC is investing $40BN in a fab plant to produce sophisticated chips in Arizona. It’s one more example of the reverse of globalization. Companies increasingly want vital inputs to be secure and closer to home. Ronnie Chatterji of the National Economic Council, said, “these two [factories] could meet the entire U.S. demand for U.S. chips when they’re completed.”

At a ceremony marking TSMC’s investment in Arizona in December, TSMC founder Morris Chang lamented that, “Globalization is almost dead and free trade is almost dead.” Recent trends support that. America is better situated than any other country to continue thriving in such an environment.

China’s increasingly bellicose statements regarding Taiwan’s independence have also caused concern about conflict upsetting global chip supply. The Economist recently ran a special section on Taiwan and warned in one article America and China are preparing for a war over Taiwan.

Russia has apparently struggled to access the right kind of chips for its invasion of Ukraine. There have been stories of Russia buying consumer products for the chips. Apparently, EU exports of breast pumps to Armenia almost tripled in the first half of last year, whereas their birth rate did not. But modern weapons systems use hundreds of chips of varying sophistication, and consumer products aren’t believed to be a relevant source of the type most needed. Based on developments on the ground, Russia is getting what they need.

Life without chips is unimaginable. Chip War offers a highly readable history of how we got here.

We have three funds that seek to profit from this environment:
Energy Mutual Fund

Energy ETF

Real Assets Fund


Always Cheaper By Sea

90% Of Everything moves by ship, at least according to author Rose George in her 2013 book that’s still fascinating reading today. George traveled as a passenger on a cargo ship called the Maersk Kendal. While onboard she interviewed the captain and crew members, enabling her to present an absorbing picture of maritime freight, an industry that enables free trade that few of us consider.

It costs one cent to ship a can of beer 3,000 miles, approximately the narrowest distance across the north Atlantic Ocean. That statistic reminds how waterborne trade has always been the cheapest way of moving goods. Moving a sweater costs 2.5 cents.

The Congressional Research Service estimates that moving crude oil by rail costs $10-15 per barrel. Just over four years ago the Energy Information Administration (EIA) estimated $3.50 per barrel to move crude by pipeline from Cushing, OK to the Texas gulf coast, around 560 miles.

.avia-image-container.av-p03keu-83e65b7b1db9c8d903e5c82d07511396 img.avia_image{ box-shadow:none; } .avia-image-container.av-p03keu-83e65b7b1db9c8d903e5c82d07511396 .av-image-caption-overlay-center{ color:#ffffff; }

A Very Large Crude Carrier (VLCC) that can hold 2 million barrels and costs $50K per day works out to 25 cents per barrel for a ten-day trans-Atlantic journey.

Shipping is incredibly cheap.

George finds that Scottish cod can profitably make a round trip to China and back for filleting, saving money versus employing Scottish filleters.

Ubiquitous steel shipping containers revolutionized the economics. It wasn’t uncommon for transport costs to eat up 25% of the value of the goods being used until TEUs (“twenty foot equivalents units”) created uniformity and reduced theft from longshoremen.

Statista estimates there are 5,589 merchant ships plying the world’s oceans, up from 5,079 in 2013 when Rose published her book. There’s no agreement on how many shipping containers exist – a Google search ranges from 17 million to 170 million.

The number of US-flagged merchant ships was declining until 2016 and remains very low. China has at least 30X as many. George estimates that Filipinos represent more than a third of all crews globally, with 250,000 of them at sea. If you’ve ever been on a cruise, you’ll know Americans are exclusively passengers, never crew. The US taxes its citizens regardless of domicile, contrasting with many other countries. The economics don’t work.

We follow the Maersk Kendal as she traverses the Suez Canal, blocked two years ago when the Ever Given ran aground. Rose George recounts a story from the Kendal’s captain when an error by the Egyptian pilot briefly left his ship stuck on a sandbar. The captain was able to maneuver off and found the pilot outside on deck praying.

The Maersk Kendal then sails off the coast of Somalia, causing George to turn to piracy which was more common in the Gulf of Aden than it is today. She recounts several tales of kidnappings, and the dramatic rescue of a kidnapped merchant captain by US Navy SEAL snipers who shot three pirates in darkness from a nearby boat while both were bobbing around.

Somali pirates are less active today, thanks to more active patrols in the region.

The US Navy plays an unparalleled role in protecting sea lanes for commercial traffic. Global trade rose as a % of GDP for several decades because of US military power as well as the falling cost of shipping. That trend has stalled in recent years.

The pandemic and Russia’s invasion of Ukraine have both caused a rethinking of supply chains. If the US at some point concludes that policing the world’s shipping is a lower priority, there’s no obvious replacement. The Council on Foreign Relations offers some background on this. If cargo ships faced longer routes with increased risk, this would further impede global trade.

The appeal of 90% Of Everything is the visibility it provides on an industry we rarely see and usually take for granted. Rose George describes the choreographed movements of global trade’s enablers and the cramped living conditions, work and tedium of crews who spend months or years away from home. She reminds that at sea, “…the captain is our god; he can marry you, baptize you, and even bury you without anybody’s permission.”

Covid lockdowns were especially tough on crews who were often stranded indefinitely on ships in sight of harbor while health officials wrangled with ship owners over pandemic protocols.

Statista calculates that today 80% of finished goods move by sea, and estimates volumes doubled from 1990-2020. 90% Of Everything may be a decade old but retains most of its relevance. You’ll finish it with a newfound appreciation of the maritime freight industry along with numerous obscure facts to be dropped in casual conversation.

We have three funds that seek to profit from this environment:
Energy Mutual Fund

Energy ETF

Real Assets Fund


The World Wants More American Gas

First Citizens Bancshares has agreed to buy most, but not all, of Silicon Valley Bank’s (SVB) carcass from the FDIC. They’re acquiring $72BN of loans at a discount of $16.5BN. The FDIC estimates SVB’s failure will cost it around $20BN. The Deposit Insurance Fund currently sits at 128BN. It’s funded by banks, which means by customers. Former SVB CEO Greg Becker is hopefully googling “clawback”.

Several former banking colleagues have been dismissive of a recent academic paper (Why do banks invest in MBS?) which estimated bank losses from rising rates of $1.7TN, most of their $2.2TN in capital. The $1.7TN figure has also made it into the WSJ.

The analysis doesn’t consider deposits, which increase in value when the Fed tightens because savings rates lag. Customer funds are often sticky. For asset/liability management banks assume a certain portion of their deposit base has long duration based on prior experience. Revaluing assets based on higher rates without considering liabilities is clearly wrong for the industry, although money market funds and treasury bills are increasingly competing for customer deposits. Many banks will likely have to be more responsive in raising savings rates, although I can report that JPMorgan for one still pays virtually 0%.

Another criticism was the assumed duration of 3.9 years on loans, which underpins the $1.7TN figure. Floating rate loans dominate according to one friend, a former senior banker who would know. He went on to wonder whether some banks even know the interest rate risk of their loan portfolios.

The banking crisis has dominated recent news, but it confirms the upside risk to inflation facing investors. Rates well below inflation are already causing financial stress. Markets expect the Fed to cut within months. Jay Powell is steadily becoming the worst Fed chair any of us can remember. Under his leadership the FOMC embraced temporarily higher inflation in 2020, only to abandon that position when their policies helped generate more than they bargained for. Expect a politically motivated pivot that claims victory is in sight so as to ease the pressure on banks.

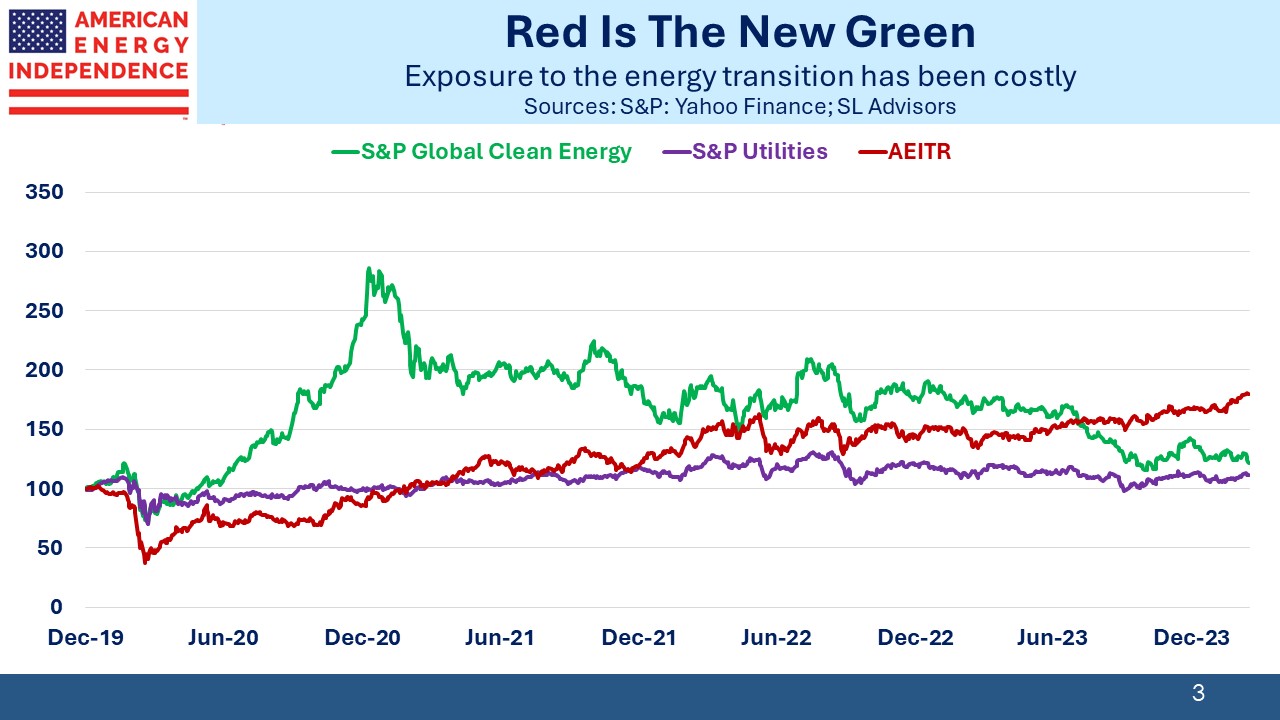
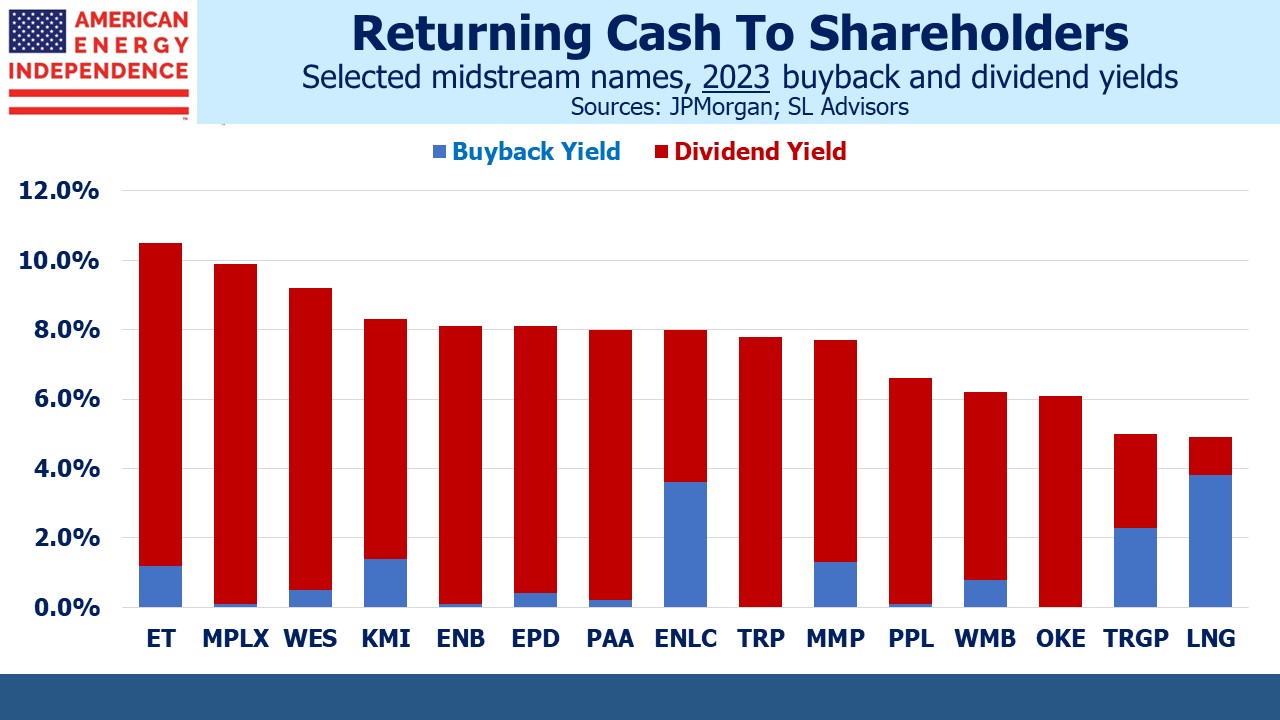
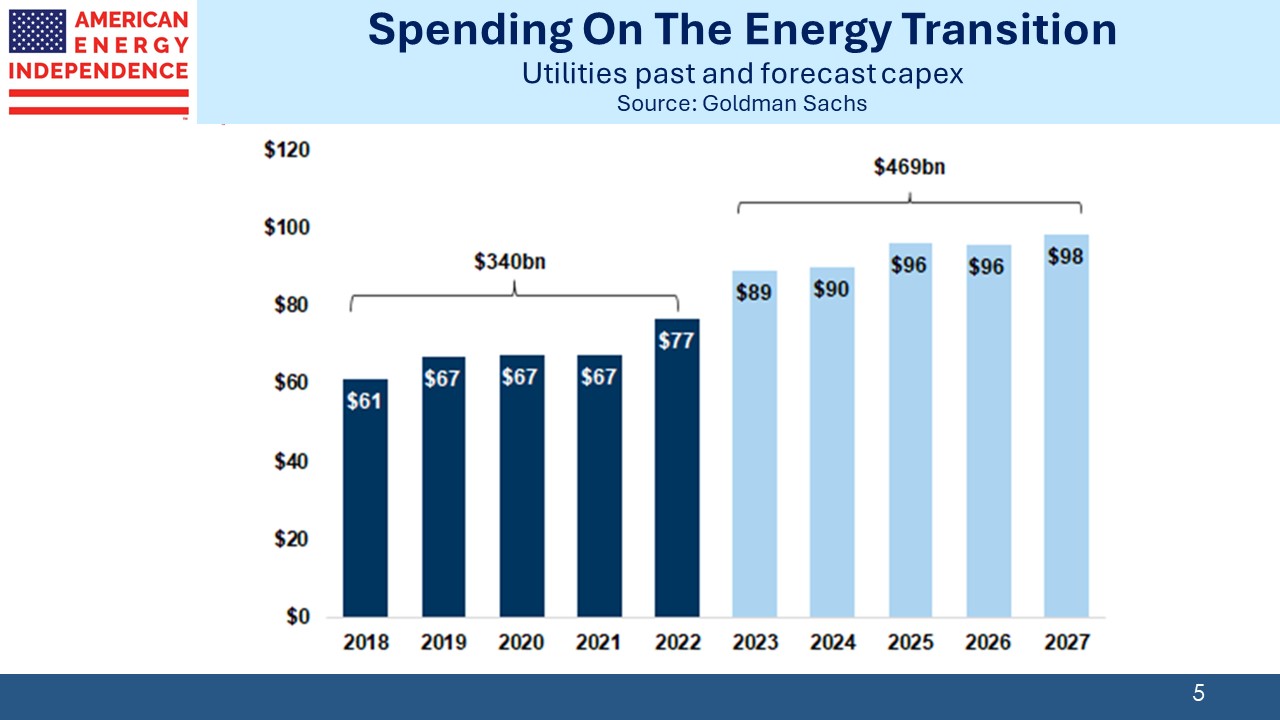
This is why energy infrastructure deserves a place in every portfolio. Pipelines often have tariffs that increase with inflation under rules overseen by the Federal Energy Regulatory Commission (FERC). The energy transition is impeding capex in reliable energy while enjoying enormous tax subsides for renewables, hydrogen and carbon capture. This underlies the strong relative performance of the sector in recent years.

Natural gas is especially well situated as a substitute for coal and a source of reliability as power generation adds intermittent, weather-dependent solar and wind.

The Energy Information Administration (EIA) just published its 2023 Annual Energy Outlook (AEO). In recent years they have revised up near term production of natural gas. Compared with their 2017 AEO, the government now expects 8% more natgas output through 2050.

.avia-image-container.av-219n0ay-3c6907cdb611030081e4378c4866e660 img.avia_image{ box-shadow:none; } .avia-image-container.av-219n0ay-3c6907cdb611030081e4378c4866e660 .av-image-caption-overlay-center{ color:#ffffff; }

Domestic consumption has been running higher than expected. Last year we used 18% more than the EIA thought we would in their 2017 forecast. They have a pattern of underestimating near-term demand. Nonetheless, over the forecast period to 2050 the EIA expects the domestic need for natural gas to decline modestly until 2035 when it will start drifting higher again. Production growth is fully due to exports, which are now forecast to be a third higher than in last year’s AEO.

.avia-image-container.av-riybd6-ecc2f2dd8fb296c036b227e33c2ec058 img.avia_image{ box-shadow:none; } .avia-image-container.av-riybd6-ecc2f2dd8fb296c036b227e33c2ec058 .av-image-caption-overlay-center{ color:#ffffff; }

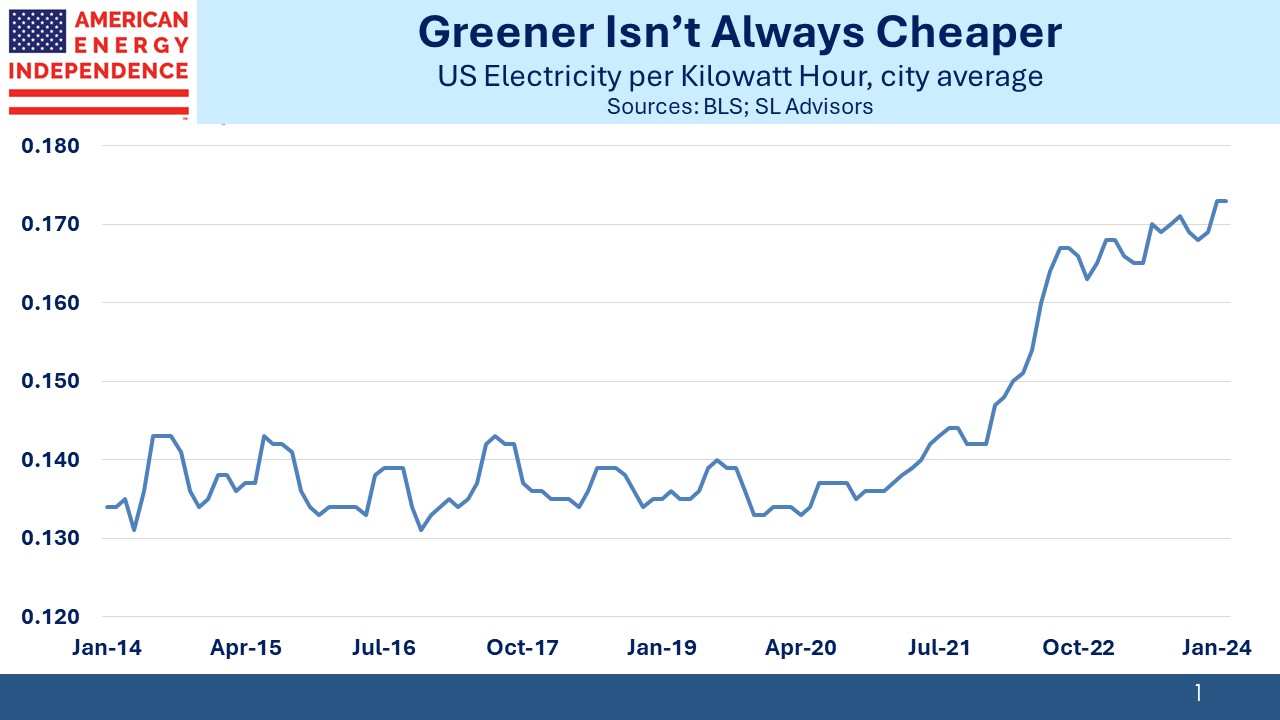
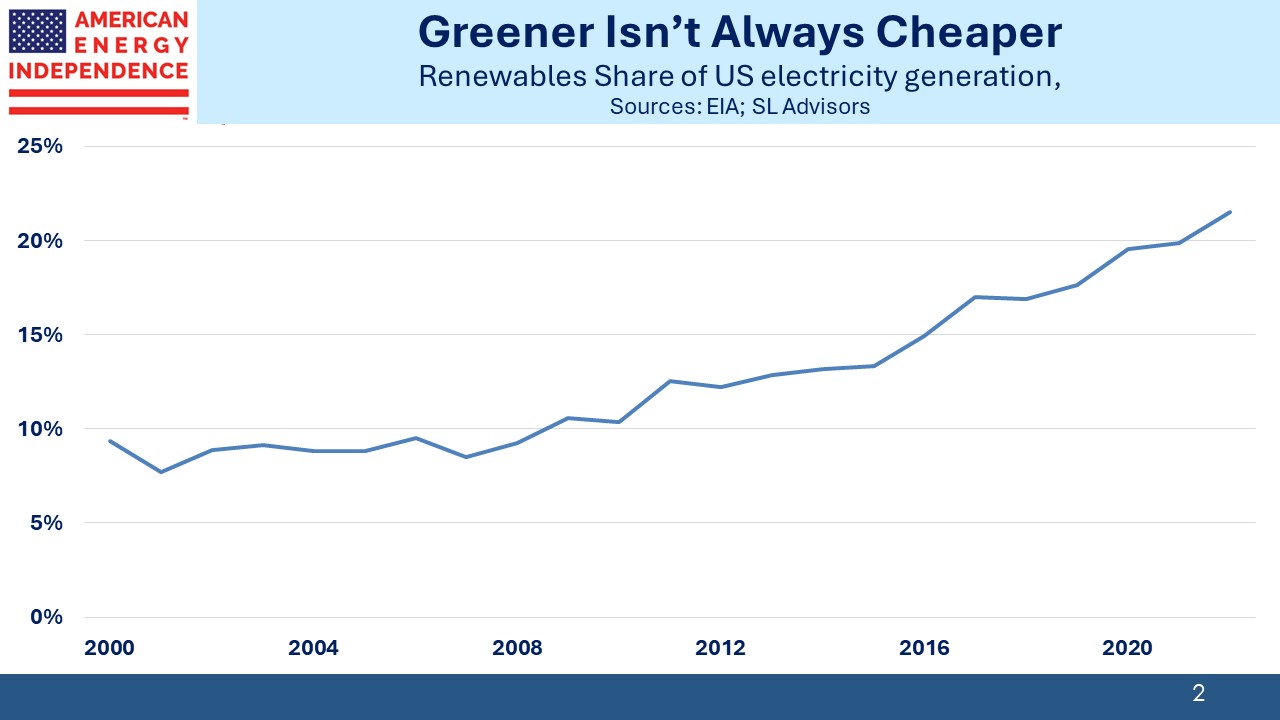
The EIA also expects renewables (mostly solar and wind) to displace natural gas as our biggest source of power generation by 2025. There are many negatives in this for America – electricity will become more expensive, less reliable and will need more room both for generation and transmission. It is the first time in human history that we’ve pursued an energy transition that is less efficient in every dimension.

.avia-image-container.av-12jpkwa-7b25bff56274b332f07aed39cc80e9fd img.avia_image{ box-shadow:none; } .avia-image-container.av-12jpkwa-7b25bff56274b332f07aed39cc80e9fd .av-image-caption-overlay-center{ color:#ffffff; }

There’s nothing about California, New England or Germany that appeals in terms of energy policy. We should be using more nuclear, displacing coal with natural gas and maintaining reliable power generation with carbon capture which now enjoys even bigger tax credits under the Inflation Reduction Act.

Nonetheless, this utopian vision for climate extremists won’t dent steady production growth because power generation is only 15% of domestic gas consumption

.avia-image-container.av-rehkbu-cdda3329f336b51453a9a2c70f54444e img.avia_image{ box-shadow:none; } .avia-image-container.av-rehkbu-cdda3329f336b51453a9a2c70f54444e .av-image-caption-overlay-center{ color:#ffffff; }

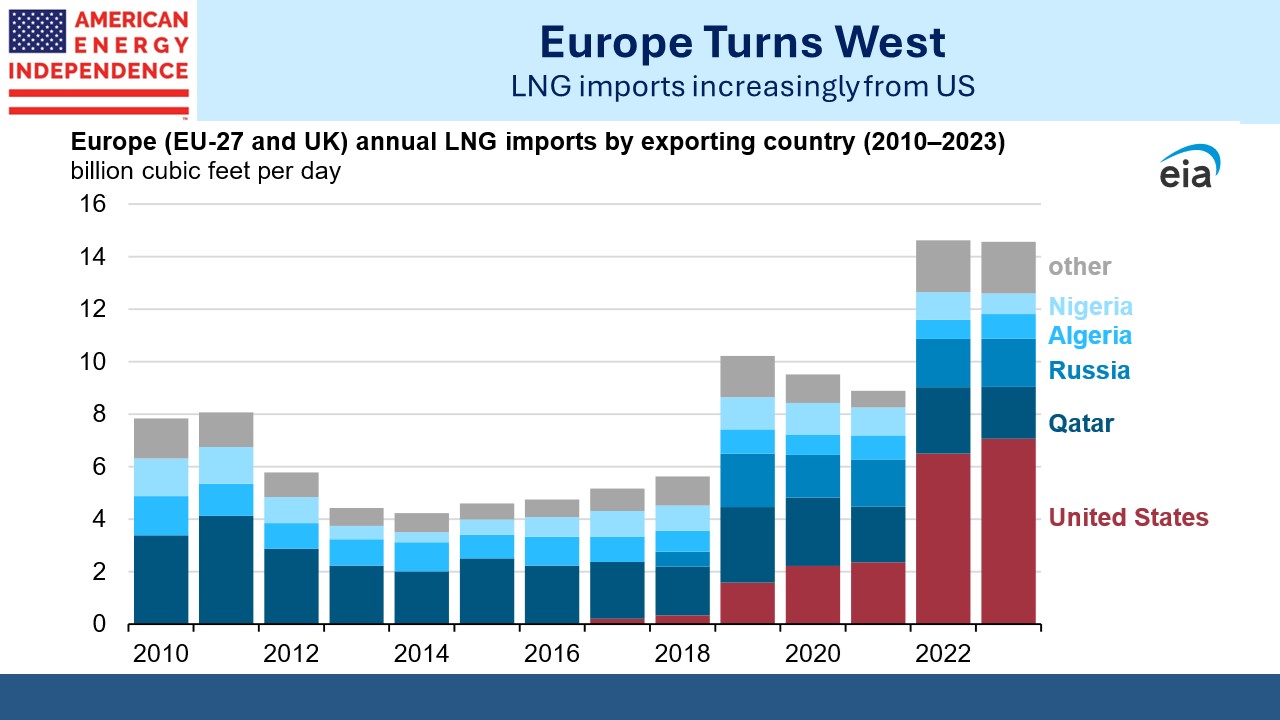
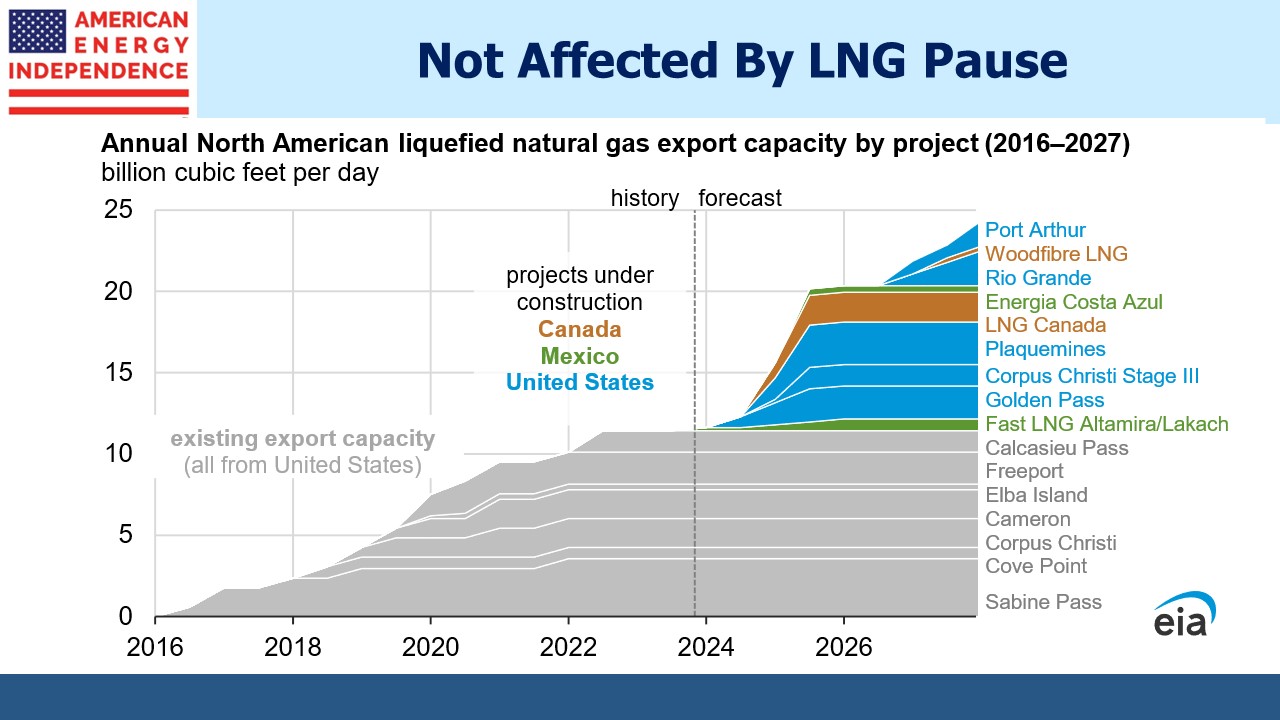
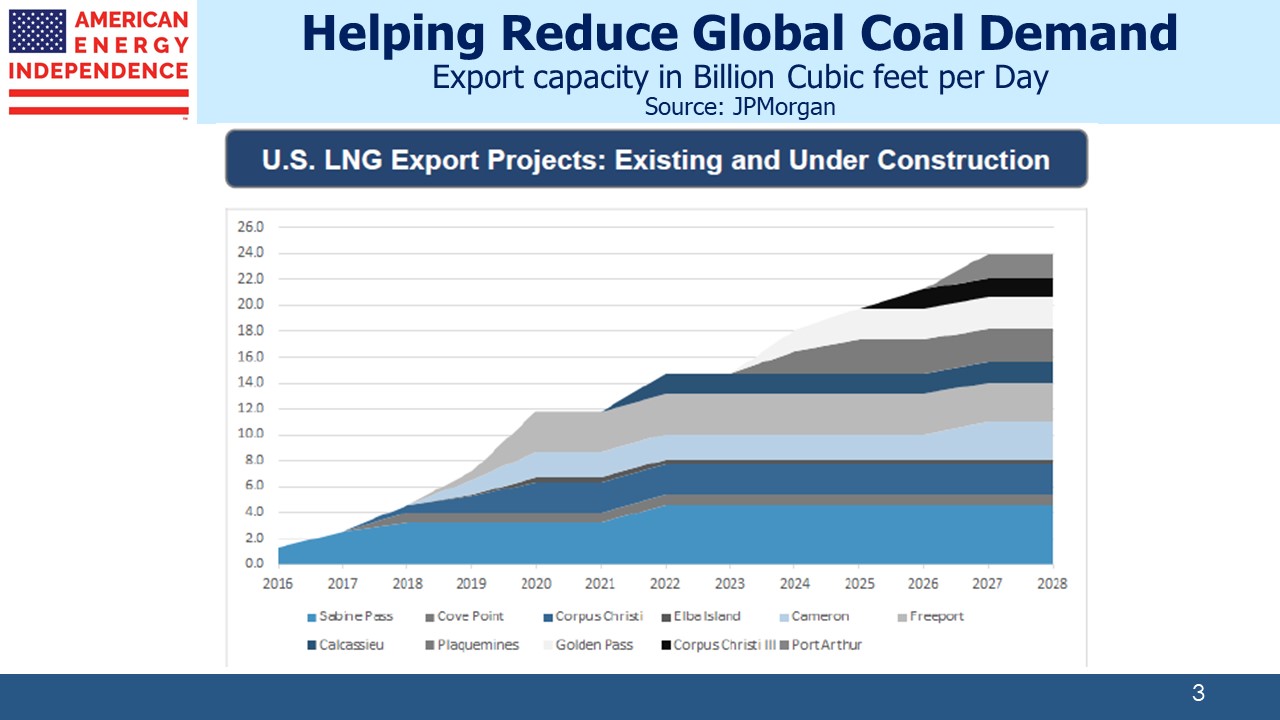
America has some of the world’s cheapest natural gas, and Russia’s invasion of Ukraine boosted its appeal. Europe’s absence of energy security has resulted in a surge in LNG imports. Regassification terminals have been built in record time by using floating storage and regassification units. The EU now expects to increase its import capacity by almost a third next year by adding 8 additional terminals (27 to 35).

US LNG exports to Europe more than doubled last year to over 7 Billion Cubic Feet per Day (BCF/D). That trend is likely to continue. The EIA continues to forecast a very bright future for reliable energy.

We have three funds that seek to profit from this environment:
Energy Mutual Fund

Energy ETF

Real Assets Fund


Time For Powell To Go

At some point Congressional oversight of the Federal Reserve should result in a careful examination of the central bank’s error-strewn record under Chair Jay Powell. Below is a roadmap for discriminating legislators willing to conduct a critical review of the Fed’s serial mistakes. 

Above the Fed’s twin mandate of seeking maximum employment with stable prices sits their overarching responsibility for financial stability. The collapse of Silicon Valley Bank (SVB) was an isolated event, the result of a largely non-FDIC insured deposit base that quickly ran when excessive interest rate risk forced the bank to dump bonds at a loss. But the banking system’s challenges are bigger than one bad interest rate bet in Santa Clara.  

.avia-image-container.av-9x48px-cd4b105a22c69c639714cdd26a311acb img.avia_image{ box-shadow:none; } .avia-image-container.av-9x48px-cd4b105a22c69c639714cdd26a311acb .av-image-caption-overlay-center{ color:#ffffff; }

SVB might be the worst run bank since the 2008 Great Financial Crisis (GFC), but similar imprudence is reflected across much of the industry. Loans and securities that are classified as Held To Maturity (HTM) don’t fluctuate in value on bank balance sheets, but they can still cause losses. Tier One equity capital of the US banking system fell by 2.2% last year (from 15.6% to 13.4%) partly due to lower valuations on Mortgage Backed Securities (MBS) and treasury securities. This is a bigger loss than at the outset of the pandemic, when provisions for bad loans soared. Unrealized losses are estimated at $620BN, against capital of around $2.2TN. US government debt carries favorable capital treatment because it has no credit risk. But that doesn’t mean it’s riskless.  

.avia-image-container.av-21ypcud-0936e90d93e925796f611b902299048e img.avia_image{ box-shadow:none; } .avia-image-container.av-21ypcud-0936e90d93e925796f611b902299048e .av-image-caption-overlay-center{ color:#ffffff; }

Including unrealized losses on loans would show bank capital is almost wiped out. Loans are rarely marked to market and are treated like HTM securities. But two recent academic papers show that, if they were valued like securities available for sale and assuming a duration of 3.9 years, banks would show losses of $1.7$2.0TN 

.avia-image-container.av-1qn659h-044ef77551a5fd9980bfe57fb445204e img.avia_image{ box-shadow:none; } .avia-image-container.av-1qn659h-044ef77551a5fd9980bfe57fb445204e .av-image-caption-overlay-center{ color:#ffffff; }

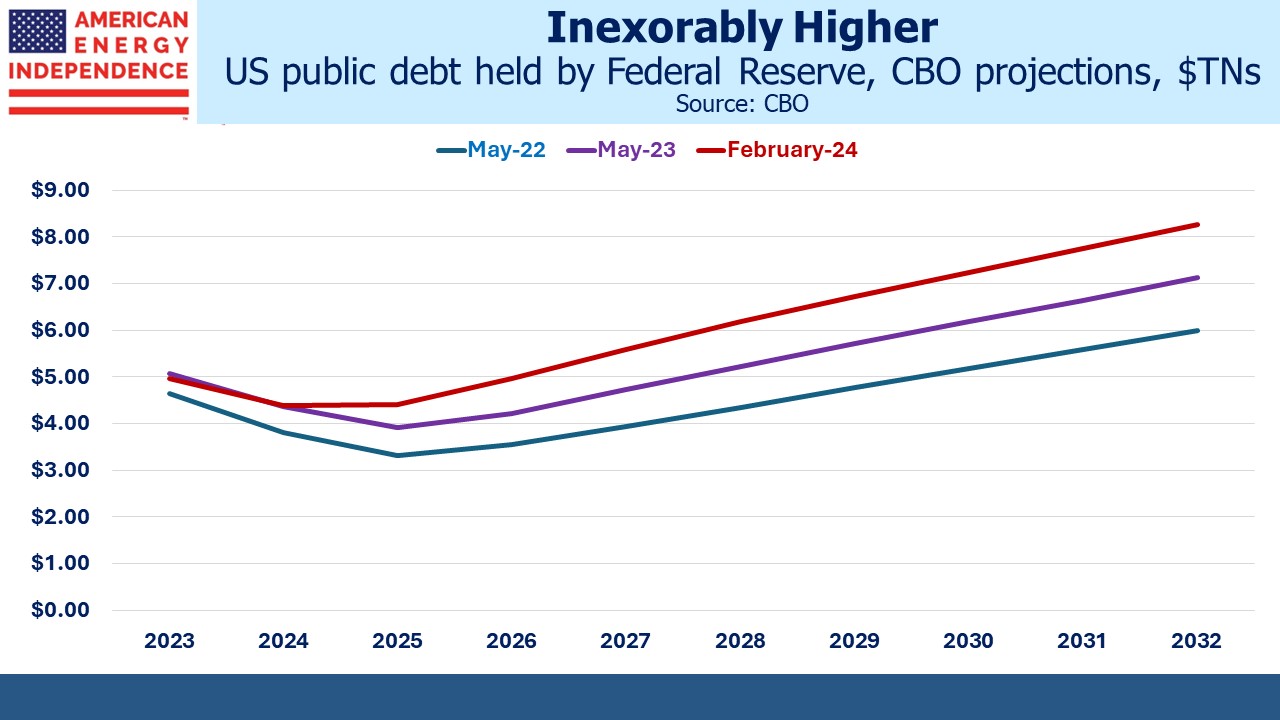
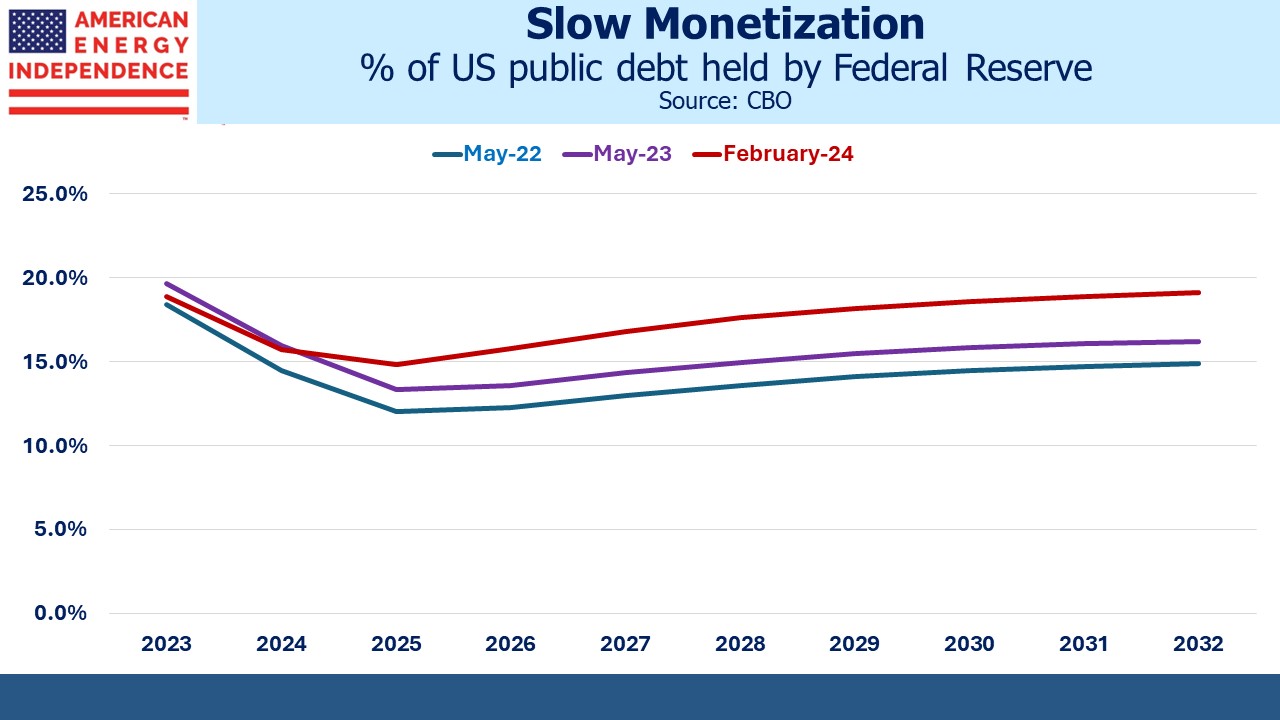
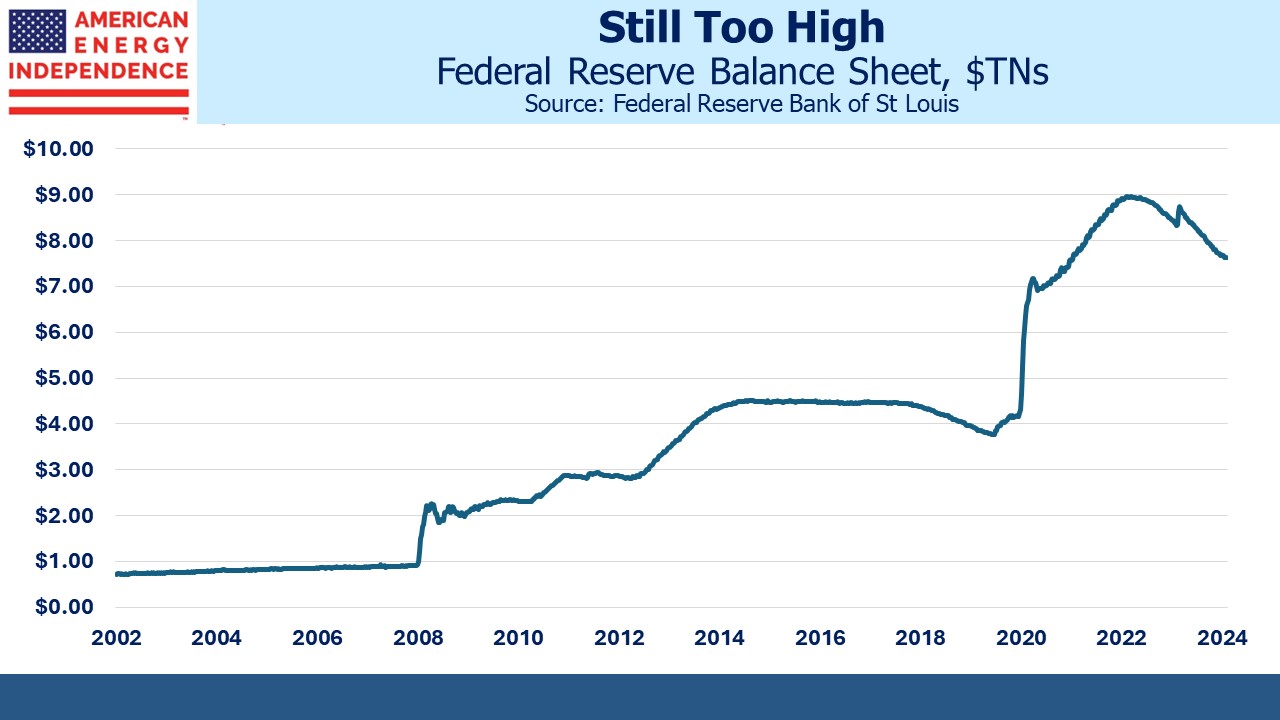
Interest rates have been unrealistically low since the GFC. Banks have responded by loading up on risk – the portion of loans and securities held with longer than three years’ duration has increased from 28% to 40% over the past fifteen years. Quantitative Easing (QE) saw the Fed’s balance sheet expand to $9TN as they acquired almost a fifth of all US government debt and depressed yields. SVB and many peers concluded that lower returns justified greater exposure. 

As a regulator the Federal Reserve has watched over this increase in duration with little public comment. FOMC minutes reveal no concern. Their Summary of Economic Projections (SEP) released quarterly provided little reason until recently for banks to worry that their low-yielding portfolios of assets would continue to be funded with even lower-yielding deposits. In March of last year the SEP still only forecast mildly restrictive policy of 2.8% vs a long run neutral rate of 2.4%. It wasn’t until June that the SEP warned of higher short term rates that would increase banks’ cost of funding and create competition for deposits from money market funds and treasury bills.  

.avia-image-container.av-169fjc5-a46b4e4d1550a34f716c1bbbd35d67de img.avia_image{ box-shadow:none; } .avia-image-container.av-169fjc5-a46b4e4d1550a34f716c1bbbd35d67de .av-image-caption-overlay-center{ color:#ffffff; }

Banks benefit from lethargy among depositors when rates rise by only slowly increasing the rates they pay. The average savings account pays 0.40%, compared with three month treasury bills at 4.5%. It’s as well most depositors don’t leave banks for higher returns because resorting to the Fed Funds market would create a negative spread against their low-yielding portfolios. SVB’s rejection of this choice led to their sale of bonds, aborted equity raise and FDIC takeover. 

You might think that years of low rates and a steady increase in duration would lead regulators to include the impact of an abrupt reversal among the many stress tests they run on banks. But in an absence of macroprudential foresight, there is no meaningful inflation stress test. They assume a benign 1.25% increase. Regulators model a sharp drop in real estate, jump in unemployment and emerging market crises but monetary accommodation is assumed to ameliorate the impact of any such shocks on the real economy. The only interest rate stress test contemplates a steepening yield curve with a 0.49% increase in ten year treasury yields and three month treasury bill rates up 0.14%. 

The Fed has overseen stress tests since they were introduced in 2013 under Dodd-Frank. The biggest stress banks have undergone since then has been caused by the Fed and wasn’t one of the scenarios they tested.  

Today’s economic and financial environment is the result of a series of errors and poor judgment by the Fed. They have implemented one of the fastest increases in monetary policy in modern times, which if banks marked their assets to market would wipe out virtually all their capital based on reasonable assumptions. FOMC minutes reveal very little awareness of exposure in the banking system the Fed oversees to sharply higher rates.  

Bank portfolios are full of low yielding assets because the Fed incorrectly maintained QE for too long. QE was a singularly useful tool during the GFC with little to justify its subsequent use. The pandemic’s economic hit was severe but brief. The Federal government’s initial fiscal and monetary policy moves were exemplary, but the largesse and accommodation were ultimately excessive, synchronized and damaging.  

Low mortgage rates and a behavioral shift to hybrid work boosted housing. This was evident to all except the FOMC with their slavish devotion to Owners’ Equivalent Rent (OER) and its theoretical notion of the cost of shelter (see The Fed Is Misreading Housing Inflation). Two thirds of American households are homeowners. Home prices matter to almost everyone. OER lags real estate by around eighteen months. The FOMC was similarly late in seeing inflation.  

In summary, the Fed has raised interest rates sharply because they were late, ravaging the capital base of the banking industry they oversee. On their watch banks have increased duration in low-yielding assets because the Fed maintained low yields with QE. The Fed has in effect led ruinous competition with banks for yield-bearing assets, and is now leading competition for cheap deposits with which to fund them, all with little apparent understanding of the industry’s overall exposure. 

SVB failed because of a depositor run, but that was preceded by a steady loss of deposits to higher-yielding money market funds and treasury bills. Banks now depend to a substantial degree on continued acceptance by customers of pygmy yields on cash, so they can continue to fund assets that yield too little. If money keeps leaving the banking system more banks will face SVB’s unenviable choice between funding assets at a loss or dumping them at a loss.  

First Republic National Bank is reported to have a tangible book value of negative $73 per share once their assets are marked to market. Who would buy a bank today? 

.avia-image-container.av-narx45-b993f8d73055ed4da92600511c0bc14e img.avia_image{ box-shadow:none; } .avia-image-container.av-narx45-b993f8d73055ed4da92600511c0bc14e .av-image-caption-overlay-center{ color:#ffffff; }

The FOMC released their latest SEP last week, forecasting another rate hike before the end of the year. Based on Fed funds futures, this is wrong by at least 1%. Such a gap between the FOMC and market expectations is testimony to the Fed’s loss of credibility. The inflation fight will be paused or declared won so that reduced short term rates can ease the banking system’s pain.  

The Fed can at least claim success in maximizing employment. Unfortunately, consumers and households report being as pessimistic as ever, reflecting today’s uncertain outlook. This is in spite of what remains, for now, a reasonably strong economy with a job available to anyone that wants one. Perhaps consumers and households have an intuitive understanding of how poorly monetary and regulatory policy have been administered.  

Fed chair Jay Powell should go. 

We have three funds that seek to profit from this environment:
Energy Mutual Fund

Energy ETF

Real Assets Fund


The Coming Squeeze On Bank Deposit Rates

An Op-Ed in the Washington Post last week suggested that unrealized losses on fixed income investments are likely much higher than the $640BN on held to maturity MBS. It was written by Sebastian Mallaby, who wrote about hedge funds in More Money Than God and has published several other finance books.

Mallaby relies on two recent academic papers which add interest rate exposure on loans to the MBS unrealized losses. Not much data is publicly available on duration risk in bank loan portfolios. Based on the reasonable assumption that loans have an average duration of 3.9 years, the academic papers Mallaby cites estimate US banking system mark-to-market losses of $1.7TN-$2TN, against a capital base of $2.2TN.

These staggeringly big numbers are theoretical and unrealized. Banks are not going to recognize losses anything like that. That’s not to say this isn’t going to be a problem.

It’s worth remembering how we got here. Since Quantitative Easing (QE) was first unleashed in the 2008 Great Financial Crisis (GFC), the Fed has generally found it easier to grow its balance sheet than shrink it. Their huge bond portfolio has depressed government bond yields, which are the benchmark from which all other fixed income securities are priced. The MBS and loans on bank balance sheets mostly originated within the last few years. From mid 2019 until early last year, the ten year yield was below 2%.

Bankrate.com calculates the average rate paid on savings accounts is 0.23%. The Federal Reserve Bank of St Louis calculates 0.35%. Depositors are normally a lethargic bunch but have been galvanized into action by Silicon Valley. Flight from shaky institutions is the current fear, most vividly represented in First Republic’s collapsing stock price. But this problem will likely be solved with a system-wide guarantee on all deposits, not just those under the FDIC $250K threshold. That is de facto government policy today having found Silicon Valley Bank to be systemically important. As the “too big to fail” tent gets bigger, the moniker no bank will want is “small enough to fail”. This is why Treasury Secretary Janet Yellen announced more support for small regional banks.

QE didn’t just help cause a housing bubble, it’s also weakened the banking system. Applied on a sustained basis, QE left them with little choice but to buy bonds and make loans at rates that only prevailed because of the Fed’s enormous portfolio.

Today’s inverted yield curve shows that the problem still exists. Ten year treasury yields are 1% below the Fed Funds rate.

That makes this week’s Fed announcement more important than most, because it’ll reveal how well they understand the banking system’s sensitivity to the funding costs of their vast portfolios of bonds and fixed rate loans that are theoretically underwater. If they regard the depositor run as localized and temporary it’ll mean higher rates to quell inflation remains their primary objective. This will put further pressure on net interest margins.

Held To Maturity (HTM) accounting has once again come in for criticism. The CFA Institute (I sit on the board of the Naples, FL chapter) thinks “hide to maturity” accounting should be abolished because it obscures information investors need. This was considered after the GFC but rejected in 2010 as adding unnecessary volatility to bank financial statements. The information is there if investors choose to look. The problem is that depositors rarely feel the need to consider creditworthiness.

Depositor inertia is what’s under threat. Last year Charles Schwab changed their sweep feature on brokerage accounts to make Charles Schwab Bank the default choice for cash rather than money market funds. Banks routinely pay paltry deposit rates, and this quiet change boosted Schwab’s profitability.  We duly adjusted client accounts to hold treasury securities.

This is the real threat facing the banking business model, not depositor runs which are solved relatively easily with a blanket guarantee.

.avia-image-container.av-m2f4j1-c6301035399c0dba79744b7bafcb835a img.avia_image{ box-shadow:none; } .avia-image-container.av-m2f4j1-c6301035399c0dba79744b7bafcb835a .av-image-caption-overlay-center{ color:#ffffff; }

Three academics recently asked Why do banks invest in MBS? in a paper published earlier this month. They include a chart showing how inadequately deposit rates rise during tightening cycles. This captures the banking system’s vulnerability. Deposit rates lag because of inertia among savers. There’s nothing like a banking crisis to make you pay attention to where your money is. Depositors are likely to become more sensitive to savings rates.

Notwithstanding turbulent markets, the case for higher commodity prices remains intact. Goldman’s Jeff Currie believes the commodities supercycle will take oil prices higher by June. Hedge fund manager Pierre Andurand expects oil to reach $140 by year’s end. Citadel’s head of commodities Sebastian Barrack doesn’t expect any long-lasting pressure on commodities.

Inflation risks haven’t meaningfully fallen, but the Fed’s flexibility to confront them has to be balanced with the poor interest rate decisions made across much of the US banking system.

We have three funds that seek to profit from this environment:
Energy Mutual Fund

Energy ETF

Real Assets Fund


Banking Crisis Means More Inflation Risk

Investors have reacted to the aftermath of Silicon Valley Bank’s (SVB) failure by assuming tighter credit conditions. This makes sense over the near term. The US banking system has been increasing duration risk, and while SVB was more reckless than most they were not alone.

Piling into long term government bonds and mortgage-backed securities required minimal amounts of capital because interest and principal are guaranteed. In perusing the Fed’s most recent stress tests, it’s clear a sharp jump in interest rates wasn’t given much consideration. Guided by the 2008 financial crisis, regulators focused on a sharp drop in equity markets, real estate and employment along with widening credit spreads.

In the interest rate stress test scenario, US interest rates are modeled to increase from 0.12% to 0.52% out along the yield curve. Regulators clearly focused on a slump in economic activity. The worst they could conceive of the bond market was a steepening of the curve led by falling prices on longer maturities. Stress scenarios largely assume an event is followed by accommodative policy.

There is no stress test remotely like the past year. An upside inflation surprise doesn’t appear anywhere.

Consistent with fighting the last war, an inflation stress test scenario will be added, designed along the lines of what we’ve just experienced. When implemented, it will force banks to reduce their tolerance for funding long term bonds with short term liabilities. It doesn’t matter whether those deposits are guaranteed by the FDIC or not – the rates banks pay will have to be more competitive than in the past.

The Fed is still in crisis mode, but a post-mortem is bound to expose the absence of co-ordination between the Fed’s setting of monetary policy and its impact on the banking system it regulates. The most recent FOMC minutes note that, “Vulnerabilities associated with funding risks were characterized as moderate.”

Elsewhere the minutes say, “Several participants discussed the value of the Federal Reserve taking additional steps to understand the potential risks associated with climate change.” It looks as if this was more important to them than the drop in Tier 1 capital ratios across the US banking system from 15.6% to 13.4% during 2022.

Silicon Valley Bank still has no buyer, and its parent Silicon Valley Bank Group filed for Chapter 11 bankruptcy protection on Friday. We’re unlikely to see a repeat of the Great Financial Crisis (GFC) of 2008-09 when the strong bought the weak – such as JPMorgan buying Bear Stearns and Washington Mutual, and Bank of America buying Countrywide.

By 2018 the banking industry had paid $243BN in fines related to the GFC. Bank of America paid $76BN, and JPMorgan $44BN, largely related to actions by the companies they had acquired in the lead up to the GFC.

For these two and other “too big to fail” banks, placing several $BN on deposit with Republic National Bank is much less risky than buying them. It’s doubtful any bank in distress could find a commercial banking buyer because the Fed isn’t empowered to issue immunity from subsequent lawsuits.

I was working at JPMorgan in 2008 at the time of the Bear Stearns acquisition. CEO Jamie Dimon described it as doing the right thing for America, because JPMorgan was in a position to help. His sentiments were not reflected in subsequent regulatory actions or litigation. He’s been very clear that he would not do the same thing again.

.avia-image-container.av-14647a6-06ced15637c032a00f651e730d287b49 img.avia_image{ box-shadow:none; } .avia-image-container.av-14647a6-06ced15637c032a00f651e730d287b49 .av-image-caption-overlay-center{ color:#ffffff; }

Testifying on recent events before Congress will be uncomfortable for Fed chair Powell. If there isn’t a pause in the cycle of rate hikes it’ll just confirm how out of touch they are. Banks need some time to rebuild their capital. Further tightening of monetary policy won’t help. With the focus shifted from inflation and the Fed forced to adopt more cautious changes in monetary policy, medium term inflation risk has gone up. Blackstone’s Larry Fink wrote in his recent annual letter that inflation is, “more likely to stay closer to 3.5% or 4% in the next few years.”

Infrastructure, especially in the energy sector, offers the potential to protect investors since around half the sector’s EBITDA is derived from inflation-linked contracts, according to research last year from Wells Fargo.

.avia-image-container.av-l1dyou-48acf213e2f6928663341459e26a7d4b img.avia_image{ box-shadow:none; } .avia-image-container.av-l1dyou-48acf213e2f6928663341459e26a7d4b .av-image-caption-overlay-center{ color:#ffffff; }

The sector has dropped too far in response to recent events. At a time when bond yields are declining the dividend stability of pipeline companies looks more appealing to us.

Over the past year pipelines have easily beat the S&P500 and other infrastructure such as real estate and utilities. The past week has seen a minor reversal. And yet, the case for inflation protection has never been stronger in the past 40 years.

We have three funds that seek to profit from this environment:

Energy Mutual Fund

Energy ETF

Real Assets Fund


The Fed Pivots To Financial Stability

Commercial banks have long benefited from depositor lethargy regarding rates. Although we now have a de facto guarantee of all commercial banking deposits, not just those up to the $250K threshold, customers are likely to pay a little more attention to return and risk, which will force banks to be more competitive.

On the asset side, capital rules that favor riskless US treasuries have encouraged banks to load up on longer maturities. Although a return of interest and principal is guaranteed, a profit is not when funded with floating rate debt. Regulatory scrutiny of banks’ duration risk will follow given the hit to capital ratios since the Fed started their belated, and therefore hurried, tightening a year ago. Bond purchases will be less eager, although the drop in rates caused by Silicon Valley Bank’s collapse has boosted bank portfolios.

The combination of having to pay more for deposits while being more cautious in taking risk represents the tightening of financial conditions long sought by the Fed. The consequences won’t be clear for months – under the circumstances a hike next week must seem imprudent. The path of monetary policy has correctly repriced to peak lower, and perhaps immediately.

.avia-image-container.av-uvtb3i-ee30fea4e4ec3a3120e521a39221ac86 img.avia_image{ box-shadow:none; } .avia-image-container.av-uvtb3i-ee30fea4e4ec3a3120e521a39221ac86 .av-image-caption-overlay-center{ color:#ffffff; }

The unwitting creation of tighter financial conditions the Fed’s rapid hikes caused now needs time to percolate. Monetary policy is best implemented slowly with few surprises. We’re seeing why. Tier 1 capital ratios for the US banking system fell by an unprecedented 2.6% last year.

The Fed interprets its twin mandate of achieving maximum employment consistent with stable prices as addressing whichever of the two metrics is farthest from target. The 2019 Jackson Hole symposium sought greater employment at the tolerance of higher near-term inflation because this was stubbornly low.

Last year’s pivot was late because of their disbelief that elevated inflation was entrenched.

But sitting atop the Fed’s twin mandate is an overarching responsibility for financial stability. Assuring that now takes priority.

What’s unfolding is a significant regulatory failure – the Fed leads banking oversight and failed to make the connection between countering inflation and the financial system it oversees. As a result, they’re relying for now on suddenly lost confidence in regional banks to slow inflation since the previously communicated rate path is untenable. Not for the first time, the blue dots on the FOMC’s Summary of Economic Projections (SEP) will need to be revised towards market forecasts.

All it would have taken was a speech by Jay Powell eighteen months ago warning that banks’ increased duration risk was going to receive greater scrutiny from regulators. Under Powell’s leadership the Fed can claim credit for low unemployment but little else. It’s often said that tightening cycles continue until the Fed breaks something. They have.

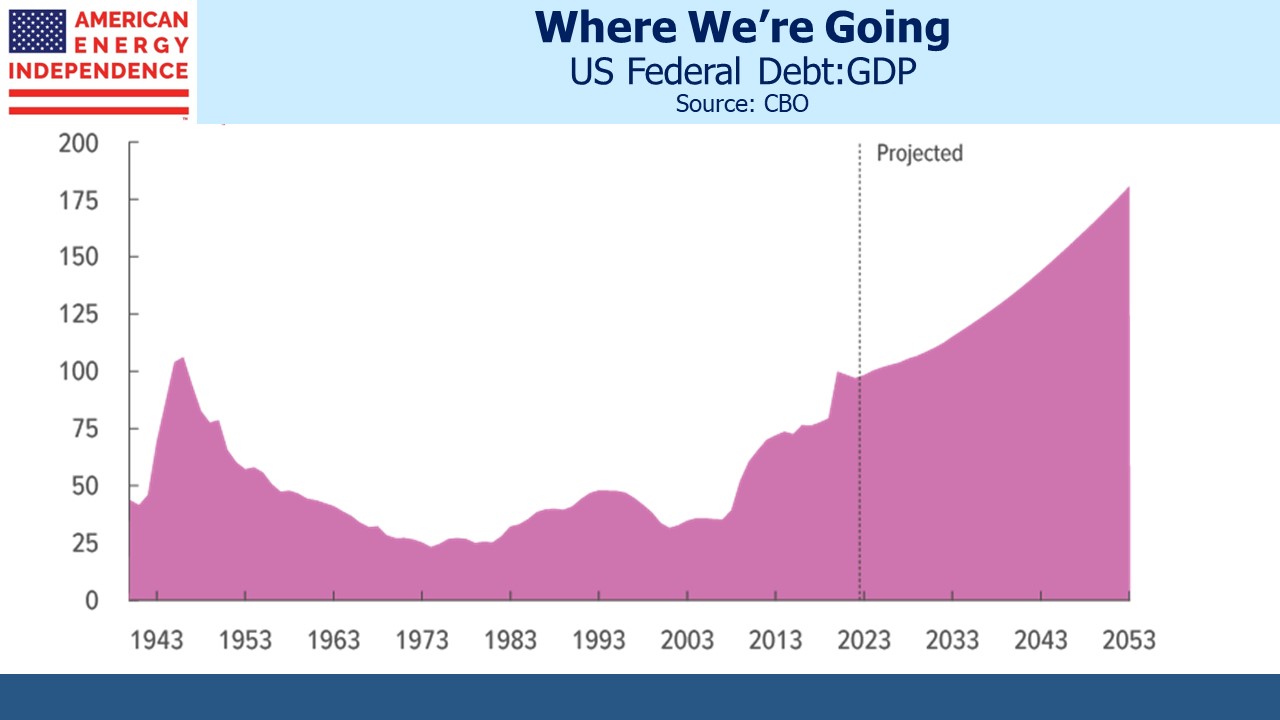
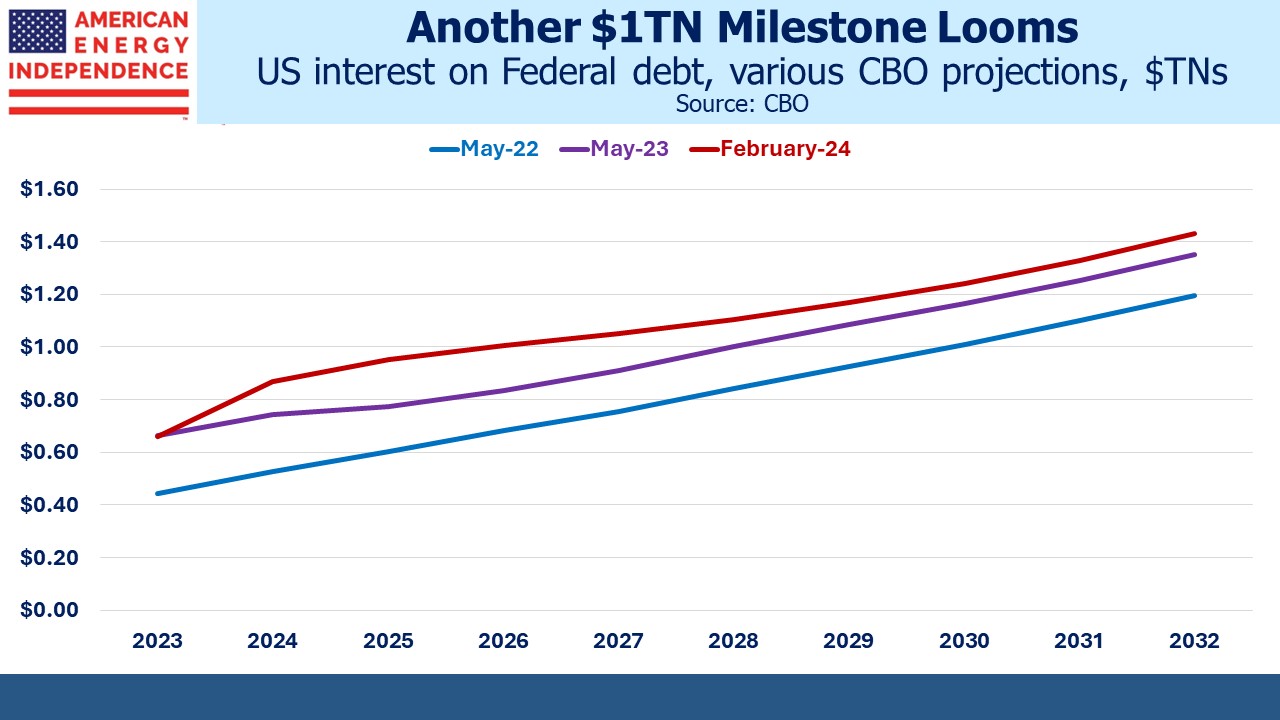
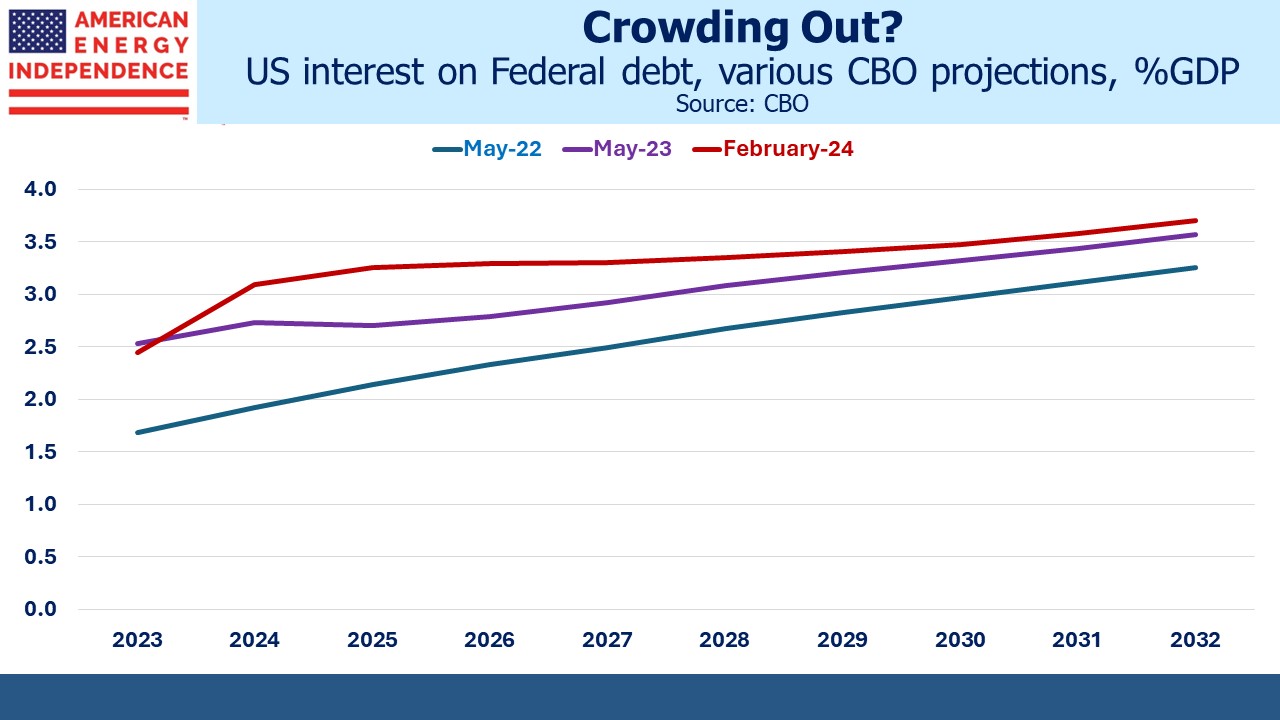
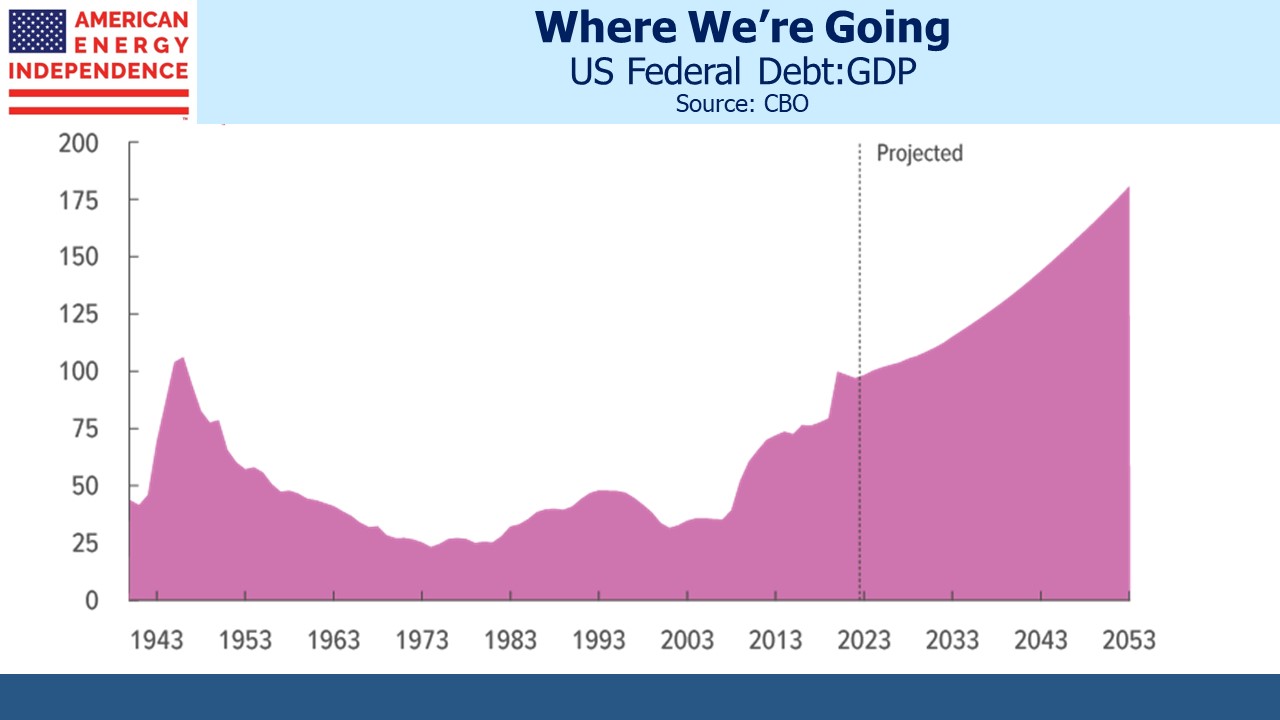
What this means for investors is that inflation risk has risen because it’s no longer the Fed’s primary concern. The rising share of Federal expenditures taken up by interest on our debt (see How Tightening Impacts Our Fiscal Outlook) will, over time, impact the conduct of monetary policy.

But the banking system’s exposure to interest rate risk presents a more immediate consideration. Industry Tier 1 Capital as a percentage of risk-weighted assets fell from 15.6% to 13.4% last year, arresting a steady trend towards a better capitalized industry begun after the 2008 Great Financial Crisis (GFC). Not every bank has JPMorgan’s fortress balance sheet, and markets have quickly identified the weak ones.

Capital ratios are now a consideration for monetary policy. The rate path indicated by the blue dots in the last SEP would likely hurt capital ratios further, so that’s no longer an option. The months ahead will determine whether the Fed’s done enough. FOMC members routinely make speeches about awaiting actual evidence of moderating inflation before slowing tightening. Circumstances now dictate that they must pause and await developments.

Yesterday’s CPI report exposed the Fed’s dilemma. Even though it showed that inflation remains elevated, tightening next week is hard to justify given recent events. Shelter was also a significant factor and this element provides a flawed reading of the housing market that lags behind actual developments by at least a year (see The Fed Is Misreading Housing Inflation). The FOMC might be relieved to explain this away as not indicative of underlying trends.

For now inflation expectations remain sanguine. Ten year TIPs imply 2.3% CPI over the next decade, not much changed since last summer. For those unconvinced that price stability will return so easily, energy infrastructure offers 5-6% yields from companies whose cashflows are linked to inflation via tariff price escalators.

The case for infrastructure, particularly in the energy sector, remains as strong as ever.

We have three funds that seek to profit from this environment:
Energy Mutual Fund

Energy ETF

Real Assets Fund


Fed Catches A Few Gullible Bankers

Silicon Valley Bank (SIVB) succumbed to poor risk management in holding long term bonds funded with demand deposits. If that’s all there was to banking we wouldn’t need many banks. But at a strategic level, Quantitative Easing (QE) as pursued for too long during the pandemic created the conditions for poor decisions.

Central bank strategy for many years has been to slowly squeeze the commercial return out of the government bond market. The banking system has responded by steadily lengthening the duration of its assets, moving out along the curve in search of increased yield. This sloppy thinking is now being exposed.

.avia-image-container.av-zwkicf-35fecd19246e761a5ef6d276f3e1b736 img.avia_image{ box-shadow:none; } .avia-image-container.av-zwkicf-35fecd19246e761a5ef6d276f3e1b736 .av-image-caption-overlay-center{ color:#ffffff; }

Since the 2008 Great Financial Crisis (GFC), the portion of all bank portfolios invested in loans and securities more than three years in maturity has grown from 28% to 40%. QE logically ought to have had the opposite effect on discerning chief investment officers, but the data suggests it caused the banking sector to compete with the Federal Reserve for yield.

Having been squeezed by the Fed on the asset side, sharply tighter monetary policy has created competition for deposits. Two year treasuries recently touched 5%, a level which beats savings accounts and even offers a plausible, safe alternative to stocks. Our big economic imbalances trace their roots to the $1.9TN Covid Recovery Plan shortly after Biden’s inauguration, and the Fed’s lethargic withdrawal of QE with ultra-low short-term rates. Both stoked inflation.

Nonetheless, SIVB made poor choices.

The result is a stunning leap in unrealized losses on banks’ holdings of securities. Not all of this is flowing through income statements. When bonds are classified as “Held To Maturity” (HTM), their mark-to-market losses show up in other comprehensive income under shareholders’ equity. In effect the losses are spread over the life of the bonds through a negative spread between the yield earned and cost of funding.

Ten year treasury yields dipped below 2% a few months before the pandemic in August 2019 and only moved back above 2% early last year. A sizeable portion of banks’ securities would have been purchased during that environment and now their deposit retention is competing with treasury bills at close to 5%.

.avia-image-container.av-vgaman-4760d6913bf17d7a24e68e36975fb6d3 img.avia_image{ box-shadow:none; } .avia-image-container.av-vgaman-4760d6913bf17d7a24e68e36975fb6d3 .av-image-caption-overlay-center{ color:#ffffff; }

The $620BN in unrealized losses represents around 28% of the banking system’s total equity capital of $2.2TN. Losing a quarter of the industry’s capital in a year, even if the losses are unrealized, does look like a regulatory failure. If not the beginning of another financial crisis it is at best likely to put a crimp on loan growth at banks that have found they took too much duration risk. And it may cause corporate clients and anyone with accounts over the $250K FDIC insurance threshold to shift large deposits to the biggest banks rather than analyze the credit risk they are enduring as depositors. For hundreds of smaller banks, that would start to look like a crisis.

YE2022 unrealized losses on HTM bonds at JPMorgan were 14% of common equity, but they’re 26% at Wells Fargo and 44% at Bank of America. 1Q23 results are unlikely to look any better.

Like a three card monte professional, the Fed convinced too many bank investment departments that low rates were here to stay and then sprung the trap with rapid hikes.

Skill in risk management is unevenly distributed. For every Jamie Dimon who avoided excessive duration risk, there are plenty of other CEOs who didn’t think that hard. We don’t have any clients with bond losses because, as one client kindly noted to me on Friday, we’ve shunned the asset class since the GFC. Only now are yields beginning to justify modest exposure.

It’s hard to imagine the Fed moderating policy because of bond losses at banks, but at the margin it means tighter credit conditions and that is the Fed’s objective. It also means that substantially higher short term rates of say 6-7%, especially if implemented over a brief period of time, would exacerbate the problem. The returnless risk that bonds represented for so many years has consequences.

At the CERAWeek energy conference last week, NextEra CEO John Ketchum surprised attendees by criticizing the expense of offshore wind projects. NextEra regards itself as a leader in renewables and is adding 45 gigawatts of power output from onshore wind and solar over the next few years. Such facilities typically operate 20-30% of the time. Offshore wind utilization tends to be 30-40%, since the wind blows more reliably at sea.

But Ketchum reported challenges with salt water corrosion, hurricanes, availability of ships and the installation of subsea cables. A renewables champion offered a dose of realism

Lastly, author and energy realist Alex Epstein testified before Congress last week on the Administration’s mis-use of the Strategic Petroleum Reserve last year to try and lower gasoline prices before the mid-term elections. Epstein showed more poise and energy understanding than his Democrat interlocuters in explaining why Biden’s expressed desire to end fossil fuel use has reduced investment and led to higher prices.

As we often tell clients, extreme greenies have helped impose capital discipline by discouraging growth capex. We have an alignment of interests. If you meet a climate extremist, give them a hug and offer a drive to their next protest.

We have three funds that seek to profit from this environment:
Energy Mutual Fund

Energy ETF

Real Assets Fund


Americans Work More Remotely

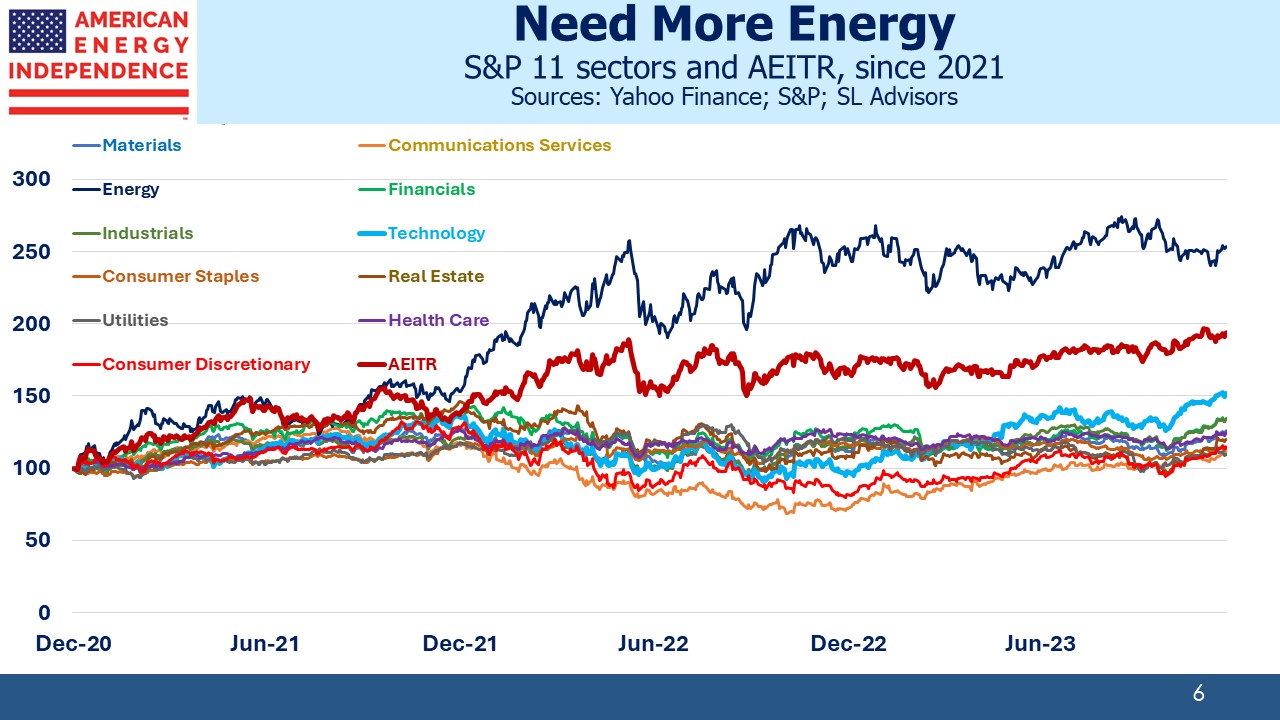
Real estate investors are keenly attuned to the Fed’s efforts to curb inflation. The Vanguard Real Estate Index Fund (VNQ) is down 18% over the past year, lagging the S&P500 which is –6% and the American Energy Independence Index (AEITR) which is –1%.

Rising rates have cooled the hot property market that the Fed’s bond purchases caused following the pandemic. The Economist believes real estate is signaling an imminent recession. An economic slump has been forecast for months even though hiring remains strong. Last month’s unemployment showed the startling resiliency in the job market. In my experience recessions rarely arrive when expected, and don’t start with 3.4% unemployment. Acknowledging the fortunate failure so far of doomsayers, the WSJ explained “Why the Recession Is Always Six Months Away.”

.avia-image-container.av-2zmagtg-a417a1175a48689390e61af870634646 img.avia_image{ box-shadow:none; } .avia-image-container.av-2zmagtg-a417a1175a48689390e61af870634646 .av-image-caption-overlay-center{ color:#ffffff; }

But real estate companies are getting more cautious. Forward guidance for 1Q23 was negative for all 26 members of the S&P500, and 20 of them revised down their full year outlook. Property may be a good long term inflation hedge, but rising mortgage rates and a realization that hybrid work is becoming permanent are substantial headwinds.

.avia-image-container.av-vgw1vo-4f0a38e7ab3f5cdd979c51e11fffaeff img.avia_image{ box-shadow:none; } .avia-image-container.av-vgw1vo-4f0a38e7ab3f5cdd979c51e11fffaeff .av-image-caption-overlay-center{ color:#ffffff; }

The Wall Street Journal recently reported that US office occupancy is around 40-60% of pre-pandemic levels compared with 70-90% in Europe and the Middle East. Asia is even higher, at 80-100%. This is partly due to American homes being bigger, averaging 2.4 rooms per person compared with other rich countries that are generally below 2.0 and average 1.7 across the OECD. If you live in Hong Kong which must be close to 100% apartments, going to the office and grabbing dinner afterwards is understandably more appealing.

Two years ago we converted the formal living room of our house, rarely used and little more than a furniture showroom, into my office. My wife didn’t share my enthusiasm for more efficient use of our home, but it’s the best office I’ve ever had. You can see it in our company video.

.avia-image-container.av-1zju7lw-0c281a3c07cfc6d2aa35386148877c07 img.avia_image{ box-shadow:none; } .avia-image-container.av-1zju7lw-0c281a3c07cfc6d2aa35386148877c07 .av-image-caption-overlay-center{ color:#ffffff; }

For 25 years I endured a daily commute of 75 minutes each way (or more) from New Jersey to New York City. Transit infrastructure in many US cities is often inadequate, and inferior to other big cities around the world. Like tens of millions, I have first hand experience.

Now I walk downstairs.

It helps that America is a big country. Covid caused us to spread out. There is a lot of available space. But bigger homes mean longer commutes which is another reason Americans are happier working remotely.

.avia-image-container.av-1s7717o-c42309ec27bbc98275da401f05d596f0 img.avia_image{ box-shadow:none; } .avia-image-container.av-1s7717o-c42309ec27bbc98275da401f05d596f0 .av-image-caption-overlay-center{ color:#ffffff; }

Real estate may be performing poorly, but it’s not yet attractively valued. The FTSE Nareit Index which covers the US commercial real estate industry yields 4.3%, less than two year treasuries and midstream energy infrastructure. It’s close to its ten year average EV/EBITDA multiple, whereas energy infrastructure is 28% cheap. One measure of the real estate sector’s rich valuations is that its current multiple is almost 2X the pipeline sector.

Wells Fargo has estimated that around half midstream’s EBITDA is derived from pipeline contracts that have explicit inflation linkage, usually via the PPI or CPI (see Pipelines Still Linked With Inflation). For energy infrastructure investors, inflation raises the value of the real assets they own as well driving commensurate increases in tariffs. Few investments offer the potential to so readily maintain their value with inflation.

Many innumerate climate extremists assert that solar and wind are the cheapest way to generate electricity. Nonetheless, running a profitable renewables business is surprisingly difficult. Last month wind turbine manufacturer Siemens Gamesa, which calls itself “the global leader in offshore power generation,” announced a quarterly loss of $967million.

BP has moderated an earlier pledge to reduce emissions and its production of oil and gas, because that’s where the returns are highest. Along with Shell, because they’re based in Europe both companies are more vulnerable to pressure from activists. Recently the market has perceived flexibility in their energy transition goals, because traditional energy is so profitable. Their stocks have performed well as a result.

.avia-image-container.av-1aemrgk-2a858d00d04a576674fac3eb5223912a img.avia_image{ box-shadow:none; } .avia-image-container.av-1aemrgk-2a858d00d04a576674fac3eb5223912a .av-image-caption-overlay-center{ color:#ffffff; }

Renewable infrastructure has been an especially poor investment. The Kayne Anderson Renewable Infrastructure Index is flat since 2018 (earliest available data) compared with midstream energy infrastructure which has returned 6.9% pa over the same period. We’re biased towards natural gas infrastructure because that’s where we believe the returns are most attractive. When windmills can offer similar cash flow visibility, we’ll take a closer look.

For now, it’s increasingly clear that when it comes to hard assets, or infrastructure, traditional energy is the place to be.

.avia-image-container.av-rojsck-bba090c53d42c883c882b9fdcd694b49 img.avia_image{ box-shadow:none; } .avia-image-container.av-rojsck-bba090c53d42c883c882b9fdcd694b49 .av-image-caption-overlay-center{ color:#ffffff; }

We have three funds that seek to profit from this environment:
Energy Mutual Fund

Energy ETF

Real Assets Fund


Using Carbon Technology To Reduce Carbon

From time to time we come across new companies and technologies that offer the potential to reduce emissions, thereby contributing to the energy transition. One recent example is Sea Forest, an Australian company developing a seaweed-based food additive for cattle that will reduce methane emissions (see How Seaweed Can Fight Global Warming). A few weeks ago Bill Gates invested in Rumin8, another Australian company with similar objectives to Sea Forest.

Recently I chatted with Mitch Swergold, whom I first met around two decades ago when he was running a long/short technology hedge fund. Mitch heads investor relations for Zentek, a Nasdaq-listed company developing new products using graphene, a one-atom-thick layer of carbon atoms arranged in a hexagonal lattice. Graphene is a carbon-based nanomaterial that Zentek believes will be a key building block for a sustainable future. Carbon may offer solutions to the world’s carbon problem.

Mitch connected me with Zentek’s CEO Greg Fenton. Thousands of businesses are finding ways to link their activities to the energy transition. At SL Advisors we believe fossil fuels will be needed for many more decades, and we focus on natural gas because it offers the world’s best opportunity to reduce emissions by replacing coal.

We have no investment or other relationship with Zentek, but thought it would be interesting to share their story. Nothing here should be interpreted as an endorsement by us of Zentek or their products.

.avia-image-container.av-i96pi9-7c742a8858a087648067c0b2db67392d img.avia_image{ box-shadow:none; } .avia-image-container.av-i96pi9-7c742a8858a087648067c0b2db67392d .av-image-caption-overlay-center{ color:#ffffff; }

Zentek has two technologies designed to reduce energy consumption. One is a coating for HVAC (Heating, Ventilation, and Air Conditioning) and PPE (Personal Protective Equipment) which improves its filtering of particulate matter. This higher efficiency promises to reduce the need for higher-rated HVAC that require more energy to run in schools and buildings.

Another Zentek technology reduces rust and corrosion on steel used in all kinds of construction, which can make it last longer.

They are presented below in the words of CEO Greg Fenton:

Zentek develops and commercializes Intellectual Property (IP) based on graphene, which makes it possible to develop new, sustainability-oriented solutions for some of the world’s biggest challenges.

Because of graphene’s nanomaterial properties, our proprietary IP innovations are expected to give our commercial partners a competitive advantage by making our clients’ high-volume products better, safer, and greener, at a low incremental cost per unit, which means they will help create real impact in the real world and should be good for the transition and for the more efficient use of energy well beyond that transition. If we reduce the amount of energy required to accomplish the same outcome/task, that is as good in our book as using energy generated or stored in a different way, and if we can improve the efficiency of those, as well, better yet.

ZenGUARD™ is our first success story. It is a patented antimicrobial technology platform from which we have already launched two applications, with more to come. HVAC filtration systems were designed to filter particulate matter, not viruses and bacteria. A new generation of effective filtration is needed, without requiring capital upgrades or greater energy consumption. ZenGUARD™-coated filters meet that need, providing nearly 5x the viral filtration of same-rated uncoated MERV (Minimum Efficiency Reporting Value) 8 filters, according to testing by the National Research Council of Canada and further confirmed by LMS Technologies in the United States.

This should give many buildings, schools, and transportation systems a viable option vs. upgrading to more expensive higher rated filters and, importantly, not only save on capital upgrade costs, but also provide substantial savings vs the increase in energy usage required for higher rated filters, which we estimate can be as high 15%. With no additional capital costs and a significant pricing umbrella vs. a higher rated filter, which can cost more than twice as much as a lower rated filter, ZenGUARD™ provides a simple, elegant solution with a compelling ROI for building and transportation system owners, operators, and tenants, etc.

We recently announced our second patent-pending technology platform, ZenARMOR™, for corrosion protection applications. Testing by Quantum Chemicals, a leader in corrosion protection, showed that ZenARMOR™ significantly improved their best product in a side-by-side comparison. We think it should be useful for preventing rust and corrosion in applications such as bridges/infrastructure, naval/marine, oil and gas pipelines and valves, and rebar and steel in construction, etc. Less corrosion means less demand for metals, which means less energy consumption to extract and transport those metals, which is good for the environment and good for investors.

The possibilities for graphene to have a positive impact on numerous industries are nearly limitless – and we believe Zentek is uniquely positioned to generate long-term growth as these possibilities unfold.

We have three funds that seek to profit from this environment:
Energy Mutual Fund

Energy ETF

Real Assets Fund