MLPs and Tax Reform

We’ve had a number of questions over the past 24 hours about the impact of the White House tax proposal on Master Limited Partnerships. Therefore, we’re posting our thoughts now rather than in our normal Sunday morning missive.

There’s not a great deal of specifics so far, but we’ve put together a table illustrating how it might impact after-tax returns for MLP investors and also how it might affect equity investors in corporations. Because MLPs are pass-through entities with no corporate tax liability, the tax reform proposal implies that the new, low corporate tax rate would apply to investors in MLPs rather than personal tax rates on investment income.

The proposed tax changes are good for most businesses. The biggest losers are likely to be taxpayers living in high-tax states such as NY, NJ or CA who currently receive significant deductions for state and local taxes (including property taxes) paid. We’ll leave that analysis to others.

For corporations, the lower corporate tax rate leaves more after-tax income to be paid to equity investors. We’ve assumed that tax rates on personal income and investment income are unchanged so as to focus in on the impact of the corporate tax rate change. We’ve also limited this analysis to Federal taxes. MLP investors often benefit greatly from deferring taxes on most of their distributions, which lowers their effective tax rate. We’ve ignored this deferral benefit as well for the analysis, although many investors (your blogger included) have MLP holdings that date back many years. But we’ve also assumed that corporations distribute all their after-tax income whereas in most cases they reinvest a portion back in their businesses and buy back stock which also defers taxes for the long term holder. Tax analysis inevitably requires making lots of assumptions.

.avia-image-container.av-35c7rh-f002b743380fd36745354c43fc746a66 img.avia_image{ box-shadow:none; } .avia-image-container.av-35c7rh-f002b743380fd36745354c43fc746a66 .av-image-caption-overlay-center{ color:#ffffff; }

With all these caveats, the boost to after tax income for all investors is significant, although it’s larger for MLP investors. It’s also worth noting that the relative attractiveness of MLPs compared with corporations increases with tax reform. In our example, MLP investors currently retain $60.40 from their investment versus $49.53 in a corporate structure, or 22% more. This advantage increases to 31% ($85 versus $64.77) following tax reform.

There are secondary effects too – if tax reform boosts GDP, corporate profits should rise as should energy consumption, which will drive increased demand for energy infrastructure.  Furthermore, while not specifically addressed in the proposal the administration has signaled its openness to accelerated write-offs benefiting capital intensive industries with large growth capex opportunities, such as the energy infrastructure sector.  They’ll also want to avoid creating economic uncertainty, so we shouldn’t expect contractionary moves, such as the ending of deductions for business-interest payments.

We think tax reform could provide a significant boost to MLPs by increasing the after-tax return to investors.

This blog discusses tax issues specific to MLPs. However, this is not intended to be specific personal tax advice. Each investor’s tax situation is unique and for specific advise you should seek the counsel of your own tax adviser.


MLP Investors Not Yet Convinced

Investors in Master Limited Partnerships (MLPs) have long become accustomed to daily fluctuations in crude oil affecting sentiment for the sector. The slide describing midstream infrastructure as a toll model with limited commodity sensitivity has been dropped from client presentations. It’s no longer credible. The Shale Revolution has shifted the industry from one of stable cashflows with modest growth to one where identifying growth opportunities is the most important element of security selection. It’s why this is the most attractive sector in the equity market.

The feedback loop between oil prices and MLPs persists – for short-term traders, lower crude suggests lower U.S. output and vice versa. Daily moves in commodity prices cause investors to recalibrate their MLP appetite, respecting the past pattern that oil and MLPs are irretrievably linked.

.avia-image-container.av-928to0-a8c759930df56976998ecb2e384c272b img.avia_image{ box-shadow:none; } .avia-image-container.av-928to0-a8c759930df56976998ecb2e384c272b .av-image-caption-overlay-center{ color:#ffffff; }

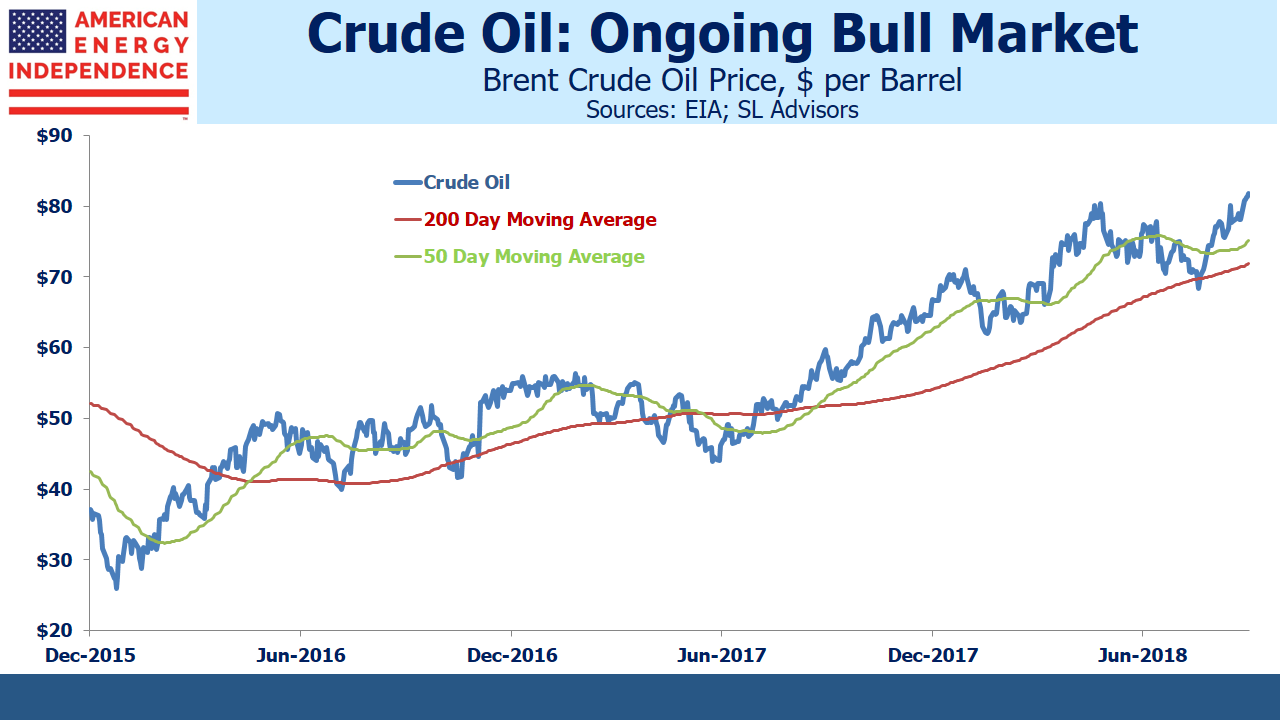
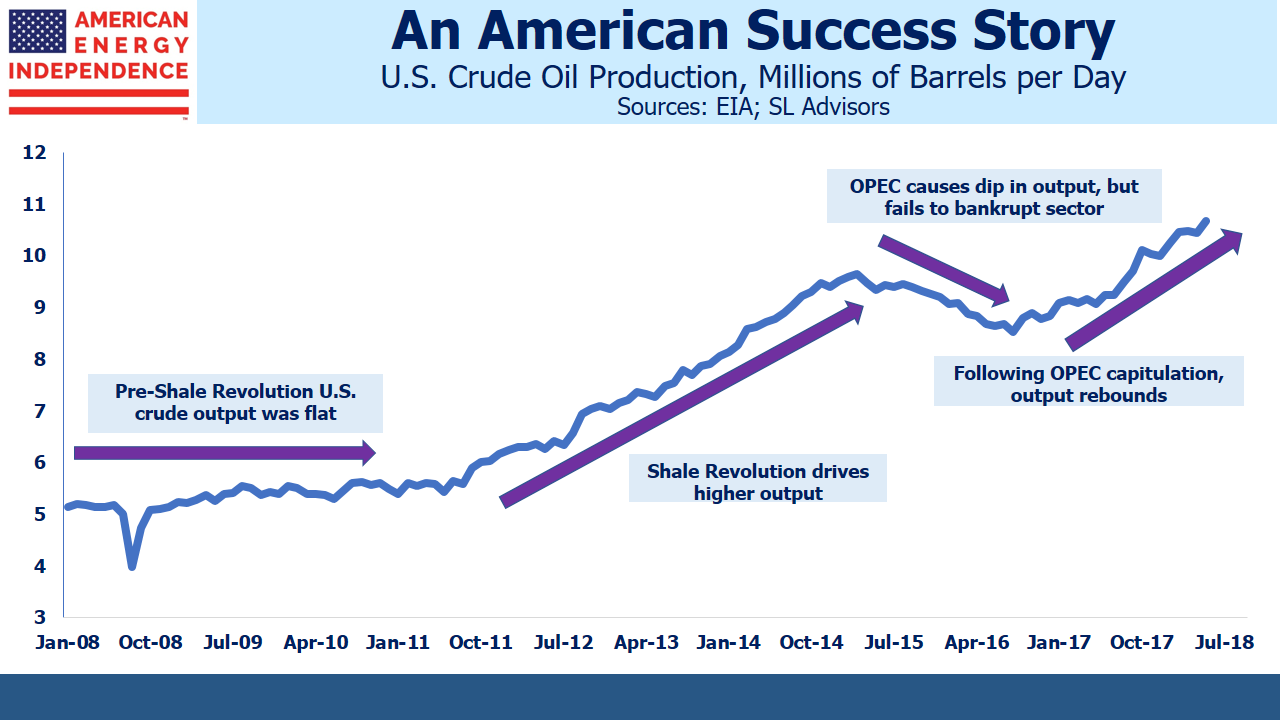
Oddly though, U.S. oil production seems fairly insensitive to prices. As the above chart shows, volumes have been increasing steadily even though the oil price has been going nowhere. It remains stubbornly below OPEC’s $60 objective following their strategy shift in November. During the collapse in 2015 MLP investors feared declining volumes would hurt cashflows, although the preponderance of long term shipper commitments meant that operating results were only modestly affected. Today, all the signs are that volumes will continue increasing. MLP investors are not yet convinced.

.avia-image-container.av-7oyzn4-b5ced9ab978ea2ab35d3fc2970dc2feb img.avia_image{ box-shadow:none; } .avia-image-container.av-7oyzn4-b5ced9ab978ea2ab35d3fc2970dc2feb .av-image-caption-overlay-center{ color:#ffffff; }

As we noted last month (see Why Shale Upends Conventional Thinking), short-cycle projects are commanding an increasing share of capex budgets of the biggest oil companies because they’re less risky. Shale projects generate output with far less up-front investment, allowing greater synchronization of capital deployed with revenue earned. This should also result in lower oil price volatility. The long lead-time of conventional projects means the supply response function is very slow. A spike in oil prices can’t easily induce immediately greater conventional supply. Short-cycle projects are much more responsive to price. U.S. shale drillers were able to curb unprofitable production quite quickly even while dramatic improvements in productivity allowed output to remain far more robust than OPEC expected. Unfortunately for oil traders, it’s likely to be a far less exciting market than in the past, because the U.S. is increasingly a nimble supplier easily able to adjust supply as conditions warrant.

Earlier last week Plains All American (PAGP) announced open season on a pipeline system from the Permian in West Texas to Cushing, OK. Recent quarterly earnings reports showed that most MLPs have plans to increase capacity in anticipation of greater volumes. In West Texas Leads a New Oil Boom we noted the entry of Exxon Mobil (XOM) into shale. They’re far better able to maintain their investment spending through a cycle than the independent drillers that came before them, which will in turn reduce volatility in output.

.avia-image-container.av-5ym9gg-5221b12380034fca37293cd639227e5b img.avia_image{ box-shadow:none; } .avia-image-container.av-5ym9gg-5221b12380034fca37293cd639227e5b .av-image-caption-overlay-center{ color:#ffffff; }

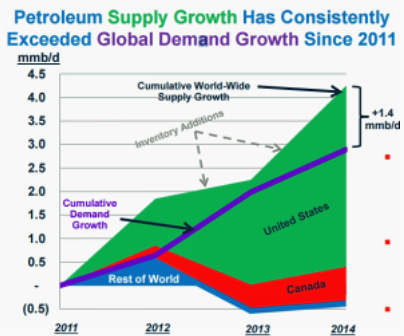
While the U.S. is increasing output, supply is shrinking elsewhere. The International Energy Agency forecasts a growing global supply shortfall, the result of the sharp capex reduction that’s taken place since 2014 (see America Is Great!). For the same reason, the head of Saudi Aramco warned of a looming oil shortage. Goldman Sachs (see chart below) noted that global oil inventories are the lowest in three years. It doesn’t look as if we’ll be short in the U.S., but globally there are plenty of reasons to expect gradually tightening supply.

.avia-image-container.av-4xve00-2bc8b141003163694b18f95f33530721 img.avia_image{ box-shadow:none; } .avia-image-container.av-4xve00-2bc8b141003163694b18f95f33530721 .av-image-caption-overlay-center{ color:#ffffff; }

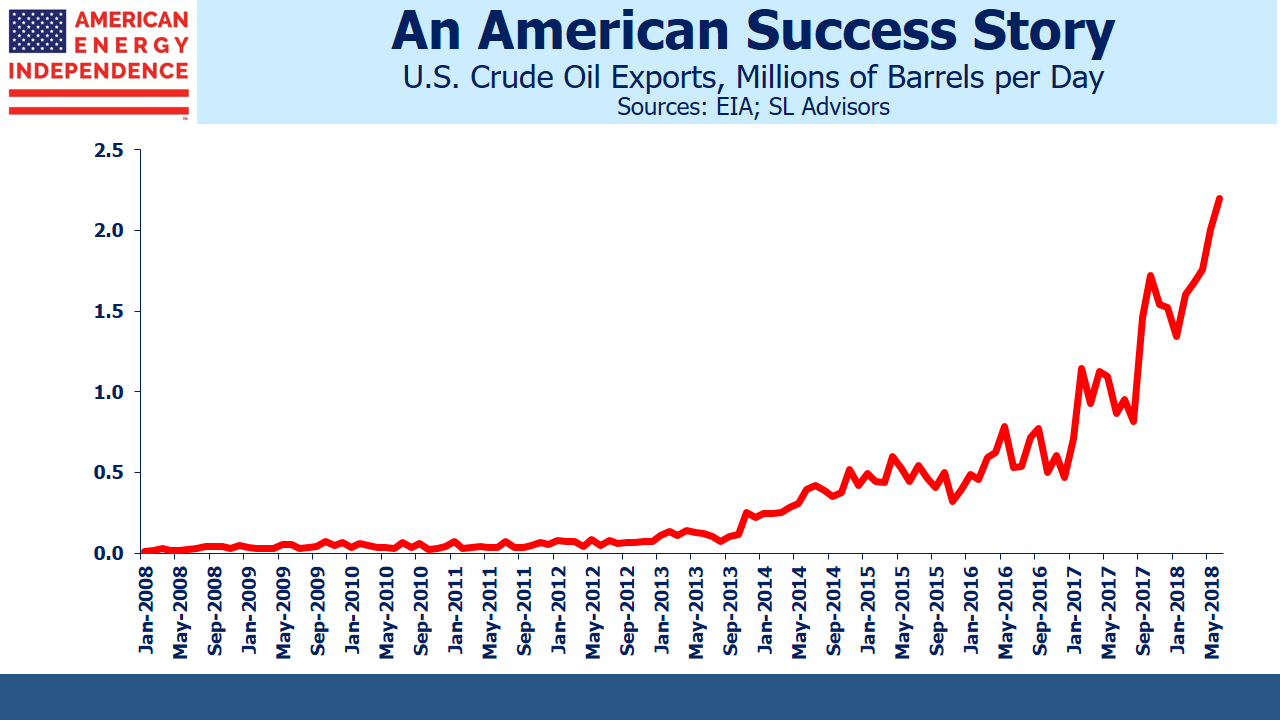
Consistent with this, U.S. exports have also been increasing since Congress lifted the export ban in late 2015. Prior to that, U.S. oil could only go to Canada, and while they’re still our biggest buyer, the next three in 2016 were the Netherlands, Curacao and China.

.avia-image-container.av-2y8q7k-1507c9760ed2fcaa6d18a6ac8c3d2052 img.avia_image{ box-shadow:none; } .avia-image-container.av-2y8q7k-1507c9760ed2fcaa6d18a6ac8c3d2052 .av-image-caption-overlay-center{ color:#ffffff; }

Investing in businesses positioned to benefit from the growing need to transport oil (PAGP), store it (NuStar GP Holdings, NSH) and provide sand for fracking (US Silica, SLCA) hasn’t been especially rewarding this year. But the signs increasingly point to growing demand for the assets and services provided by companies such as these.

We are invested in NSH, PAGP and SLCA


NuStar Acts Like a Hedge Fund

Last Tuesday, in a kind of return to normalcy, NuStar Energy (NS) funded an acquisition the way Master Limited Partnerships (MLPs) normally do; by issuing equity.

NS is an MLP controlled by a publicly traded General Partner (GP) called NuStar GP Holdings (NSH). As we’ve noted in the past, an MLP with a GP looks very like a hedge fund with a hedge fund manager. In this version of the analogy, NS is the hedge fund and NSH the hedge fund manager (i.e. hedge fund GP).

So to clarify what NS has done – they’ve invited in some new Limited Partners (think hedge fund investors) via their secondary offering of 12.5 million LP units raising $579MM (before fees). This money will, along with additional debt proceeds and cash, be invested in their $1.475MM purchase of Navigator Energy Services, owner of gathering and processing assets in the Permian Basin in West Texas. This looks just like a hedge fund leveraging new client capital to invest in assets, except that NS is buying physical assets rather than stocks, bonds or currencies like a hedge fund.

Like a hedge fund manager the GP, NSH, has directed all this activity while only providing their minor 2% GP share of the equity capital. NSH receives Incentive Distribution Rights (IDRs) from NS which are a function of NS’s Distributable Cash Flow (DCF). Since NS owns more assets, they’ll throw off more DCF which can only be good for NSH. So like any competent hedge fund manager, NSH will receive a portion of the cashflows generated by assets that it controls but does not finance.

We’ve written about this in the past (see Energy Transfer’s Kelcy Warren Thinks Like a Hedge Fund Manager)

.avia-image-container.av-14v1p-ef3b283d662077daf24609a643f58d7a img.avia_image{ box-shadow:none; } .avia-image-container.av-14v1p-ef3b283d662077daf24609a643f58d7a .av-image-caption-overlay-center{ color:#ffffff; }

NSH CEO William E. Greehey understands this profitable asymmetry better than most, because he personally owns 21% of NSH. He also regularly buys additional NSH units on the open market. The Hedge Fund Mirage; The Illusion of Big Money and How It’s Too Good To Be True (Wiley 2012) revealed that 98% of the profits generated by hedge funds had gone in fees to managers. Being a hedge fund client is often financially punitive and rarely anything like as lucrative as being a hedge fund manager. Although MLPs have easily outperformed hedge funds, it’s often still the case that GPs do better.

Greehey’s $250MM personal investment in NSH is augmented with $150MM in NS, so he is in a way invested alongside other NS holders. However, since the IDRs paid by his NS units are returning to him via his NSH ownership, he’s enjoying substantially better terms than the others. It’s like investing in a hedge fund for no fees, which given that industry’s history is usually the only sensible way to do so.

Of course, there’s always the risk that NS might have agreed to pay too much to acquire Navigator Energy Services, in the same way a hedge fund might invest its clients’ capital in a low-returning asset. The risk of overpaying is largely borne by NS (i.e. the hedge fund clients) since it’ll reduce the returns they’d otherwise earn. The impact on NSH is more muted – after all, they didn’t provide the capital in the first place so their downside is a bit less cashflow received on virtually nothing invested. NSH has agreed to waive its IDR payments on the new money for the first ten quarters, which helps the numbers in the short term but will still nonetheless provide accretive cashflows for the GP indefinitely thereafter.

Since investors are generally advised to place their capital alongside management, which in this case is clearly in NSH, one might ask what is driving the selection of investors who instead choose NS? But we won’t ask the question too loudly, because it is the existence of willing NS investors that creates value in NSH. After all, what use is a hedge fund manager with no hedge fund? Similarly, an MLP GP without a ready market for units in the MLP he controls is worthless. So NS holders will gamely look past the 7% drop in stock price on the day the secondary was announced and draw solace from the exciting prospects described by management on their explanatory conference call (although failing to allow questions made the exercise fairly pointless).

Hedge fund clients often warmly regard new investors as confirming their earlier insight, and pay little heed to the possibilty of a dilutive return on the additional capital raised. The more astute GPs chant “We Love Our LPs”, which is the mantra of every GP in finance. As holders of NSH, we love NS investors. Not so much that we’d want to be them of course, but they can feel the love and that’s what counts.

We are invested in NSH


The Global Trade in Natural Gas

One of the many benefits of the Shale revolution has been a reversal of the U.S. terms of trade with respect to natural gas (see U.S. Natural Gas Exports Taking Off). We’ve long been a net importer and the Sabine Pass LNG (Liquified Natural Gas) facility in Louisiana was originally intended to augment pipeline inflows with waterborne imports. The discovery of so much commercially viable and cheap domestic natural gas upended these plans and several years and billions of dollars later Sabine became the first of several LNG export facilities.

Owner Cheniere Energy (LNG) just announced their 100th LNG shipment. One of the most stunning developments in this arena has been LNG shipments of natural gas from the U.S. to the United Arab Emirates (see Coals to Newcastle). You have to be pretty good at producing it cheaply in order to cover shipping costs to a region of the world awash in hydrocarbons. And in America, we are.

Natural gas pricing has always been a much more local market than is the case for crude oil. This is because moving natural gas long distances generally requires a pipeline. Seaborne shipments involve chilling gas which is expensive. Consequently, shipping costs for gas are typically a far larger proportion of the value of the commodity than is the case for crude oil, which is why you’ll hear reference to a global crude market but rarely one for natural gas.

.avia-image-container.av-80zik9-2e1899c9b7db44819c81e49ddfadb249 img.avia_image{ box-shadow:none; } .avia-image-container.av-80zik9-2e1899c9b7db44819c81e49ddfadb249 .av-image-caption-overlay-center{ color:#ffffff; }

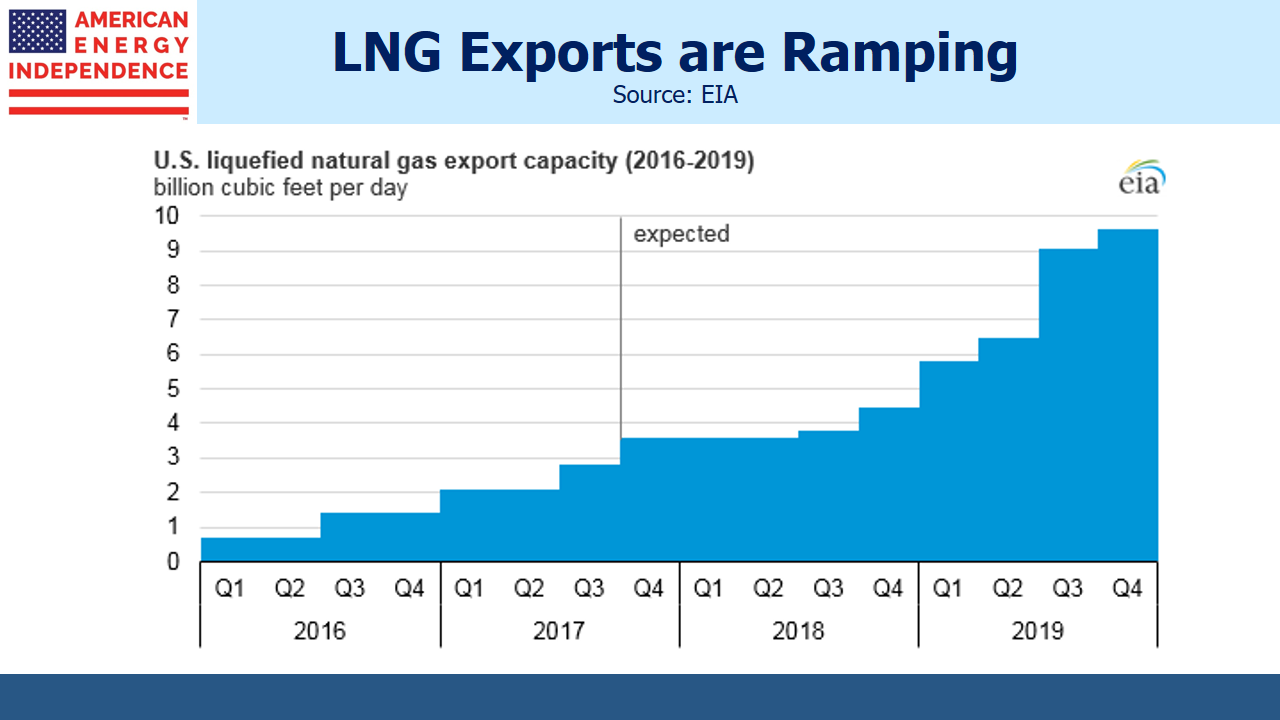
However, this is beginning to change and the commencement of U.S. LNG exports last year is part of this new trend. Although the U.S. is currently an insignificant player, our exports are set to grow steadily in the coming years. Qatar is the world’s biggest exporter but is expected to be passed by Australia next year, which has ten LNG projects at various stages of production. One of the most extraordinary LNG projects currently underway involves liquefying natural gas that is sourced from beneath the seabed around 125 miles from the coast of Western Australia. Shell Australia is building a floating LNG facility called Prelude FLNG.

.avia-image-container.av-6dj63d-30f417ca1aebee56b3b10cc1888e18f6 img.avia_image{ box-shadow:none; } .avia-image-container.av-6dj63d-30f417ca1aebee56b3b10cc1888e18f6 .av-image-caption-overlay-center{ color:#ffffff; }

Prelude’s construction involves components from all over the world. The hull has been built in Geoje, South Korea, one of the very few shipyards in the world big enough to accommodate it. Other key components have been built in Malaysia, Dubai and France. Shell’s website has some interesting videos on the project.

Some numbers will illustrate: at 533 yards, it is longer than four English football pitches (or five American football fields). When complete, it will weigh as much as six of the largest aircraft carriers combined. It will be tethered permanently to the floor of the Indian Ocean, designed to withstand a 1 in 10,000 year typhoon (let’s hope that’s right). When chilled to -260 degrees Fahreinheit, LNG occupies 1/600th of the volume it would in a gaseous state. Prelude’s production could more than fully meet the needs of Hong Kong.

.avia-image-container.av-44n7uh-155d14c875025a8c8f38a53c72609b68 img.avia_image{ box-shadow:none; } .avia-image-container.av-44n7uh-155d14c875025a8c8f38a53c72609b68 .av-image-caption-overlay-center{ color:#ffffff; }

Shell’s Final Investment Decision (FID) to proceed with the project was made back in 2011 and construction began the following year. It’s safe to say the arrival of U.S. LNG exports on the market was not a factor that received much attention during Prelude’s planning. Natural gas prices around the world are lower than was the case when much of today’s LNG export facilities were initiated.

Only last year Woodside Petroleum cancelled a planned A$40BN FLNG project in the same area because of depressed commodity prices. But Shell has pressed ahead, and when in operation later this year Prelude will confront a changing world landscape. Japan has become a more significant buyer following the Fukushima nuclear disaster, which at one point led to a halt in output at all of the country’s nuclear power facilities.  China is also seeking to shift away from coal to cleaner sources of electricity generation.

Australian LNG exports chiefly supply China, Japan and South Korea. In fact, as the pie chart shows, imports of LNG predominantly go to Asia which in 2016 received 73% of the world’s total LNG shipments. The global trade in LNG grew 7.5% from 2015 to 2016, up from an annual growth rate of 0.5% over the prior four years. China’s imports jumped by 37% and India’s by over 30%. 72% of LNG trade in 2016 was conducted under long term contracts (defined as greater than four years). LNG trade requires substantial capital investment, so supply/demand certainty is sought by both sides. Altogether, 39 countries import LNG from 19 exporting ones.

.avia-image-container.av-2mdcc9-4ca56060cf3bf92082c961b01566133a img.avia_image{ box-shadow:none; } .avia-image-container.av-2mdcc9-4ca56060cf3bf92082c961b01566133a .av-image-caption-overlay-center{ color:#ffffff; }

Although there are enormous technical challenges in building an FLNG facility, there are some benefits too. Prelude’s location will allow it to draw over 13 million of gallons of water every hour from the ocean to help cool the natural gas it’s processing. And the fact that it’s offshore means that the permitting process need not be quite so concerned with the consequences of a catastrophic failure as with land-based facilities.

All these developments are leading towards increasing trade in natural gas and the concurrent development of a global market, pulling together the many regional ones.

We are invested in Cheniere Energy (LNG)


The Folly of Leveraged ETFs

Recent weakness in crude oil has spilled over into Master Limited Partnerships (MLPs). Some connection between the two is understandable, because part of the bull case for MLPs lies in growing shale output increasing demand for energy infrastructure. Lower oil prices dampen the enthusiasm for the idea that Exploration and Production (E&P) companies will be competing for sometimes scarce pipeline resources. For our part, we think the short-cycle nature of shale offers a substantial advantage for producers (see What Matters More, Price or Volumes?). MLP investors often feel they must have a view on crude oil before investing; because U.S. volumes are likely to rise in almost any price scenario, we think it’s less important other than over the short term perhaps. Shifting your MLP exposure around in response to oil prices is not a good long term strategy. If you have a view on oil, invest in oil.

Profiting from owning crude oil is harder than you might think. Many ignore storage costs. While these aren’t directly reflected in spot prices, they are most assuredly part of the return from owning securities linked to the price of oil. The costly “rolldown”, by which the expiring near futures contract has to be regularly rolled into the next, higher priced one simply reflects the cost of storage. The approximately $1.20 per barrel price difference between May and August crude futures is largely due to the cost of storage for three months. Think of it as the time value of money applied to crude oil.

Exchange traded products linked to oil have a checkered past, which some think shows the need for a better solution aimed at those who would like to profit from their view of oil prices. ProShares, a purveyor of leveraged ETFs, has come up with a doozy.

Oil has been pretty volatile over the last few years. From its peak in 2014 its spot price dropped by 75% through February 2016, before doubling over the next year. If your version of excitement is a commodity price that gyrates wildly, you need look no further than oil futures.

But some find this tame. Downhill skiing may appear sedentary to those who insist a true mountain experience must be preceded by a helicopter ride to find real deep powder. But the kite skier needs a three-dimensional snow experience; if it’s not dangerous it’s not worth the trouble.

.avia-image-container.av-4l3n07-5c789f5eced0c4ec77682c2c3b85e184 img.avia_image{ box-shadow:none; } .avia-image-container.av-4l3n07-5c789f5eced0c4ec77682c2c3b85e184 .av-image-caption-overlay-center{ color:#ffffff; }

The kite skier is the type of buyer attracted to the ProShares UltraPro 3x Long  Crude Oil ETF, designed for those wanting to profit from rising crude oil (Ticker: OILU). And because excitement need not be limited to a rising market, they also have a bear market version (Ticker: OILD).

These two investments share a couple of traits with kite-skiing, in that they’re dangerous and not everyone involved will have a good time. OILU is designed to move each day by three times the percentage move in the Bloomberg WTI Crude Oil Sub-index. In order to maintain this 3X exposure to daily moves, OILU will need to rebalance its holdings every day. Without going into the messy details, this introduces the insidious nature of the use of leverage, in that rebalancing will always necessitate trading in the direction of the market. Following a rise in crude, they’ll need to buy more oil futures to bring their exposure back up to 3X. When it falls, they’ll need to sell oil to bring their exposure down to 3X.

As you can appreciate, if oil goes up and down but doesn’t make much overall progress, the buy high/sell low rhythm of re-hedging will relentlessly eat away at the holder’s value.

The last couple of years were interesting to say the least for oil traders. It’s possible to simulate how OILU and OILD would have performed for their holders over this period. The simulation omits fees and transactions costs, so the real results would have been a bit worse.

.avia-image-container.av-2694zr-1c74788f8a940625bbf02282195f67d2 img.avia_image{ box-shadow:none; } .avia-image-container.av-2694zr-1c74788f8a940625bbf02282195f67d2 .av-image-caption-overlay-center{ color:#ffffff; }

It might not surprise to learn that OILU lost money when oil went down. It is after all designed to make money if oil rises, so if your forecast is wrong OILU will not be your friend. Crude peaked in April 2014, and OILU would have lost 90% of its value by Christmas. Its chart looks rather like a kite skier suffering cardiac arrest. Although it’s hard to see, I can report that OILU did double in price when oil began to rally, albeit after falling 95%.

More surprising is that the bear market version, OILD, ultimately fared little better. Although crude oil is roughly half its value from three years ago, the OILD holder who made this correct forecast nonetheless saw his investment lose 70% of its value.

The point here is that 3X levered ETFs are not for those who develop an emotional attachment to their securities. The longer your holding period, the greater the certainty that you will lose money. Therefore, the optimal holding period is correspondingly as short as possible – or, if you’re not a kite skier, no holding period at all. Leverage means you care not just about the accuracy of your forecast but also about how quickly it happens. Predicting the near term path of prices as well as their ultimate resolution is how the over-confident are separated from their money. Leveraged ETFs are designed with the expectation that rebalancing will inexorably drive their value to zero.

The seductive and eye-catching part of the chart is of course the eightfold and eventually tenfold increase in the price of OILD. It was most definitely possible to make a lot of money from OILD. It required the possession of both oil price insight and exquisite timing, but for those blessed with both a healthy gain was to be had.

The problem is that, since few could have had such luck, over the three year simulation the typical holder lost money. Because ETFs don’t have a fixed share count some might quibble with this assertion; buying might have been substantial at low prices and inconsequential at high ones. It is unknowable of course, but in securities markets activity inevitably rises with prices. There would have most likely been many more buyers of these levered ETFs when they’d risen, further increasing the ranks of ultimate losers.

So you have a product that will be profitable for some but unprofitable for many and certainly for most. Should it even exist? How should we regard the supplier of something of whom the customers will for the most part suffer financially from their purchase? Is ProShares part of the efficient channeling of savings towards productive capital formation, the reason public capital markets exist? Or are they the casino owner, profiting from customers who on average will be richer by not entering?

And what’s wrong with that? Lottery ticket buyers, even the least financially sophisticated, pretty much understand that the odds are against them. In willful defiance of classical economic theory, lotteries nonetheless thrive even though the customers are selecting negative expected outcomes. They do this because the hope of winning, the dreaming of how that payoff would transform life, itself comes with positive utility. No ticket, no dream. Hope has value.

Is it therefore also true that users of ProShares products similarly comprehend the adverse odds they face and nonetheless derive utility from the hope of profit? Or is it more likely that they don’t perform the analysis above, and attribute any financial outcome to their expressed opinion rather than poor choice of product? In this case, the buyers of ProShares 3X products are less financially sophisticated than the lottery buyers they might regard with disdain. When waiting in 7-11 to buy milk while a customer ahead purchases a lottery ticket, the ProShares buyer should seek his financial advice. He might learn something. Lottery ticket buyers have more realistic expectations than ProShares buyers.

The ProShares prospectus details various dire outcomes that may result from a purchase. But of course nobody reads prospectuses, so they are legally compliant if not informative. However, shouldn’t there be a presumption that the typical holder of a ProShares product will profit if his underlying view is correct? What use is a supplier of financial products that largely destroy value? Demand certainly exists, as ProShares proudly notes on its website the $27BN in such ETFs they offer. But size of capital raised doesn’t prove intelligence by the investors, as the hedge fund industry routinely proves.

If some regard “ethical financier” as an oxymoron, it might be in part because of the values behind the offering of 3X leveraged ETFs. Just because something can be created doesn’t mean it should be.


The Slow Shift in Power

The U.S. produces electricity from diverse sources; burning coal and natural gas each provide just under a third of our needs (natural gas is steadily displacing coal, which is good for those MLPs that transport, process and store natural gas). Nuclear is 19%, with the rest being other renewables of which hydro is the biggest. Solar from all sources (which includes both utility scale production as well as rooftop panels that supply back to the grid) is currently 1.4%. In 2016 we used around 4,100 TWH (Terrawatt Hours).

To explain the dizzying numbers: One Terrawatt (TW) is 1,000 Gigawatts (GW). One Gigawatt is 1,000 Megawatts (MW). Capacity is measured by output capability, while use is measured by quantity consumed per hour. So a 100MW power plant could supply 100MWH if it ran at 100% capacity for sixty minutes.

.avia-image-container.av-7tmlgf-8a8e7a1f3f37d5b164966cb674bb8034 img.avia_image{ box-shadow:none; } .avia-image-container.av-7tmlgf-8a8e7a1f3f37d5b164966cb674bb8034 .av-image-caption-overlay-center{ color:#ffffff; }

For those who forecast big shifts in how the U.S. generates electricity, year-to-year change is disappointingly slow. This is because the net additions to electricity generating capacity each year are only a small fraction of total capacity.

.avia-image-container.av-5ipzgv-fd2806eaa723477f622af0fb07cd9b8d img.avia_image{ box-shadow:none; } .avia-image-container.av-5ipzgv-fd2806eaa723477f622af0fb07cd9b8d .av-image-caption-overlay-center{ color:#ffffff; }

Last year we added 15 GW of net new generating capacity, the biggest in five years including a decent jump in wind and solar. Also notable was the ongoing retirement of coal plants. As the third chart shows, this is likely to continue because older power plants are more likely to be coal-burning. The challenge with wind and solar is that it’s not always windy and sunny, and since commercially viable, large scale storage is still ahead of us, utilization is lower for these categories than others.

.avia-image-container.av-46gsvz-4c37ac90513baf12e679b64478abab19 img.avia_image{ box-shadow:none; } .avia-image-container.av-46gsvz-4c37ac90513baf12e679b64478abab19 .av-image-caption-overlay-center{ color:#ffffff; }

To illustrate how slowly the existing electricity generation capacity changes, consider these figures: total generation capacity is 1.1 TW, or 1,100 GW. Very approximately, 1.1TW of capacity could theoretically produce 9,600 TWH in a year if everything ran at 100% (i.e. 1.1 X 365 days X 24 hours in a day is 9,636). So our consumption means we used 42% of this theoretical capacity. Since power needs fluctuate depending on the time of days as well as the seasons, and facilities need to be shut down for periodic maintenance, the industry is more efficient than this sounds.

.avia-image-container.av-2mzf0v-f532437ca3ba047a712aab1ec9d642c5 img.avia_image{ box-shadow:none; } .avia-image-container.av-2mzf0v-f532437ca3ba047a712aab1ec9d642c5 .av-image-caption-overlay-center{ color:#ffffff; }

But it puts the 15GW of new capacity in perspective since it represents around 1.5% of the installed base.  Even this overstates its impact because of the lower utilization rates of wind and solar.

Change is surely coming to how we source our power. Future generations will almost certainly rely far more heavily on solar. But over the next decade or so, change will appear slow.


Emerging Markets: Promises Unfulfilled, Time to Upgrade into MLPs

Most MLP investors are attracted by the regular distributions paid out by midstream infrastructure businesses. Some though, are wary of a repeat of the heightened volatility of 2015 even though evidence increasingly supports our analysis from early last year that an improbable confluence of circumstances was responsible (see The 2015 MLP Crash; Why and What’s Next).

I had just this conversation with a financial advisor last week, and I offered him the following perspective: if MLPs are too volatile to be an income substitute, an alternative approach is to consider them as a replacement for equity sectors that have similar volatility and with whom they share a meaningfully positive correlation.

Many advisors recommend an allocation to Emerging Markets (EM). The theory behind this is that because developing countries have faster GDP growth than developed countries, they should offer commensurately higher equity returns. The problem with this theory is that the transmission mechanism from GDP growth to equity returns is not uniformly effective all over the world. Weak corporate governance and property rights, uncertain contract law and government corruption can all interfere with a foreign investor’s GDP insight translating into appreciation of stock holdings.

Since 1996 (the inception of the Alerian Index, AMZX) the correlation of monthly returns on the MSCI Emerging Markets Index (MSCI-EM) with AMZX is 0.42. But it’s been rising, and over the past ten years it’s 0.53 and for the past five 0.55.Because the U.S. High Yield bond market is dominated by Energy issuers, when investors flee more risky borrowers their actions tend to ripple across Energy as well as EM. Asset class correlations generally have been rising, diminishing the benefits of some types of diversification. MLPs also have only around 80% of the volatility of EM. Moreover, since 1996 AMZX has returned 13.2% annually, almost four times the MSCI-EM’s 3.4% even though 2015 was a terrible year for the energy sector. Switching out of EM and into MLPs offers just this type of opportunity for a portfolio upgrade that doesn’t increase overall risk.

.avia-image-container.av-2xckpq-5d71e5adc2216b732ce7fb4ef58d215f img.avia_image{ box-shadow:none; } .avia-image-container.av-2xckpq-5d71e5adc2216b732ce7fb4ef58d215f .av-image-caption-overlay-center{ color:#ffffff; }

Some years ago when I was with JPMorgan, I was in India and had the opportunity to chat with a senior member of the Reserve Bank of India (RBI), the country’s central bank and securities market regulator. We had been meeting with Indian hedge fund managers while we considered the wisdom of adding an Indian investment to our portfolio.

“How many insider trading cases does the RBI prosecute in a typical year?” I casually enquired. “Oh none. There is no insider trading in India.” was the barely credible response. To which the only rational conclusion is that if your Indian investment manager isn’t actively using inside information, you’re unlikely to make much money. A JPMorgan due diligence questionnaire that sought an affirmative response on this question would have taken internal meetings with Compliance in a wholly unhelpful direction. We did not invest in India.

Most global companies have revenues and profits linked to EM. They have to allocate capital where they see the best opportunities, and navigate their way through each country’s business practices, laws and taxes to realize an appropriate return. The collective capital allocation decisions of the management of the S&P500 companies is almost certainly far better than that of any EM money manager screening locally listed stocks. If Coca Cola, P&G, Nike, Apple and so on in aggregate seek 3% exposure to Brazil, it takes a substantially mis-directed degree of self-confidence to assume one knows better. Therefore, many investors can hold their large cap equity positions and consider their optimal EM exposure achieved as well.

The S&P500 has generated an annual return of 8.6% since 1996, handily beating the MSCI-EM return of 3.4% noted earlier. In fact, the EM index is still 30% below its high from 2007, before the Financial Crisis. The figures clearly show that the relatively faster GDP growth of Developing Economies doesn’t translate into higher equity returns. Those investors seeking direct exposure are getting severely penalized.

Given the history and figures listed above, switching EM into MLPs is pretty compelling. The lower volatility of MLPs combined with their increasing correlation with EM means that the switch is likely to improve your portfolio’s risk characteristics. More importantly, it should substantially improve your return profile. MLPs regularly beat EM; since 1996, the one year trailing return on MLPs has beaten EM by at least 10% fully 48% of the time (the reverse statistic is only 24%). By contrast with EM, your domestic energy infrastructure investment benefits from attractive valuation, the tailwinds of America’s path to Energy Independence and a White House that is clearly supportive. Disputes over trade, a strengthening dollar or the overthrow of a foreign potentate are all challenges for the EM manager that will leave the MLP investor blissfully unharmed.

So if you’d like to participate in the secular growth in U.S. energy infrastructure that is driven by the Shale Revolution but are wary of classifying it as an income generating investment, use your EM bucket and improve your overall portfolio quality. If the K-1s put you off, look for a RIC-compliant mutual fund that provides 1099s.


What Matters More, Price or Volumes?

If you talk to investors about U.S. energy infrastructure, you’re pretty soon going to get to crude oil. A view on one is seemingly predicated on the other. Some investors mutter darkly about assertions in years back that Master Limited Partnerships (MLPs) are a toll-like business model with limited sensitivity to commodities. Although it remains largely accurate, such talk is rarely heard nowadays because it’s so at odds with recent market history. Fee-based cashflows and a pipeline network that is 93% non-crude oil (natural gas is a more frequent pipeline user) don’t sway people. So here are some charts and numbers to help.

.avia-image-container.av-asqwn8-c9121863f0f9e0fbb70b9baafc17310d img.avia_image{ box-shadow:none; } .avia-image-container.av-asqwn8-c9121863f0f9e0fbb70b9baafc17310d .av-image-caption-overlay-center{ color:#ffffff; }

Visually, MLPs and crude have had strong and weak relationships. We’re currently in a period of high correlation, because part of the MLP story relates to volume growth versus infrastructure capacity. Natural gas prices and MLPs have no statistical connection.

.avia-image-container.av-8gqn6s-bb6f8b7feb954fa75afc272a2ff847d9 img.avia_image{ box-shadow:none; } .avia-image-container.av-8gqn6s-bb6f8b7feb954fa75afc272a2ff847d9 .av-image-caption-overlay-center{ color:#ffffff; }

As we noted in MLP Investors Digest Supply, getting granular involves forecasting hydrocarbon output versus take-away capacity. The chart below on the Permian Basin illustrates.

.avia-image-container.av-rg06s-31f4611c3eb79e09f8ee4f142a389a49 img.avia_image{ box-shadow:none; } .avia-image-container.av-rg06s-31f4611c3eb79e09f8ee4f142a389a49 .av-image-caption-overlay-center{ color:#ffffff; }

Crude oil production and the means to transport it away are both expected to grow. Exploration and Production (E&P) companies co-ordinate closely with infrastructure providers to match oil supply with take-away capacity. An E&P company with no ability to get its output in a pipeline network is no happier than the owner of an empty pipe. Future Gathering and Processing take-away capacity has more visibility than does future output, but both sides are trying to match expectations. And of course there are many players of all sizes, which makes it a complex dance.  If you own infrastructure in the region you want output to grow faster than expected, increasing demand for your scarce resource. Higher oil prices make this more likely. Hence, some sensitivity between crude oil and MLPs makes sense, although not to the degree seen recently.

.avia-image-container.av-5u40as-1626abd1e316e5ecd12ab392fb346911 img.avia_image{ box-shadow:none; } .avia-image-container.av-5u40as-1626abd1e316e5ecd12ab392fb346911 .av-image-caption-overlay-center{ color:#ffffff; }

Over the last decade, U.S. crude oil and natural gas output have steadily increased, with a modest pullback in 2015-16. The above chart also shows that on an energy equivalent basis we produce almost twice as much natural gas as crude oil, which is why we often note that U.S. energy infrastructure is more of a natural gas story. As the chart below shows, natural gas production has expanded rapidly, seemingly oblivious to steadily declining prices. Dramatic improvements in efficiency are the reason, and the same thing is happening with shale production of oil.

.avia-image-container.av-enm44-54406e3029cd279e083e88f544c1abf9 img.avia_image{ box-shadow:none; } .avia-image-container.av-enm44-54406e3029cd279e083e88f544c1abf9 .av-image-caption-overlay-center{ color:#ffffff; }

Higher volumes have driven the need for more infrastructure and growth for MLPs. This is the more important relationship, and as the chart below shows, volumes have tracked MLPs better than prices. So a positive view on MLPs today rests on a forecast of continued growth in output. On Friday the weekly Baker Hughes U.S. rig count leapt by 21 to 789, up from 476 a year ago. The continued increase following the drop in crude prices shows that the domestic energy industry is less worried about falling oil than MLP investors seem to be.

.avia-image-container.av-23j6pw-79c87e66f6cd11921728b965da9d8fac img.avia_image{ box-shadow:none; } .avia-image-container.av-23j6pw-79c87e66f6cd11921728b965da9d8fac .av-image-caption-overlay-center{ color:#ffffff; }

Forecasting prices is difficult, but steadily higher volumes over time look like a much safer bet. As we noted last week in Shale Upends Conventional Thinking, demand for short-cycle projects is causing a shift in capex to the U.S. because that’s where a lot of those projects are. Long-cycle projects whose capital recycling extends out beyond the liquidity of the futures market (two-three years) are a bet on prices. That’s far more risky nowadays following last year’s collapse in crude pricing. The Energy Information Administration’s recent Annual Energy Outlook 2017 forecasts steadily rising crude oil production and continued near 4% annual growth in natural gas output. Crude prices matter in the short term, but over the long term volumes will drive returns.


Why Shale Upends Conventional Thinking

Long time subscribers will recall that back in 2015 this blog sought ever more creative and different ways to communicate the same message, which was that MLP prices had fallen far enough and represented compelling value. Bear markets have an unfortunate tendency to last longer than their opponents would like. Although the sector rebounded strongly in 2016, some of those 2015 blog posts were premature.

One lesson is that if you’re going to write constructively during a bear market, marshall your arguments and prepare to spread them over more weeks than you might anticipate. Last week MLPs and crude oil rediscovered their once close relationship, to the detriment of investors in energy infrastructure. Forewarned, your blogger will not expend all his constructive thoughts right away.

Prior to the Shale Revolution, MLPs were fairly described as having little correlation with commodity prices. Pipelines were a toll-like business model whose returns were driven by volumes. Today, much of the point of investing in the sector relies on the growth prospects made possible by the Shale Revolution. Ten years ago the need for new investment was limited; today it’s clear that to exploit newly accessible hydrocarbons, infrastructure needs to support these new locations. North Dakota was not known for oil, nor was Pennsylvania known for natural gas.

Therefore, the returns on energy infrastructure investments are nowadays more sensitive to growing domestic production and the consequent utilization of existing as well as planned infrastructure. To take one example, Plains GP Holdings (PAGP) anticipates a substantial increase in EBITDA if growing oil production absorbs more of its available pipeline capacity. Oil production reacts to prices; PAGP’s prospects are linked to those of its customers.

Last November’s strategy shift by OPEC to cut production was an ignominious admission that their prior effort to bankrupt the U.S. shale industry through low prices had failed. It represented a watershed event, the moment when it became clear that a new paradigm was in place, as we noted in The Changing Face of Oil Supply.

“Short-cycle opportunities” are what every oil company needs. Shale now counts the biggest integrated oil companies among its proponents. Exxon (XOM) CEO Darren Woods recently noted that a third of their capex budget is devoted to such opportunities. The key here is the liquidity of the oil futures market. If your project’s timeframe extends beyond the availability of hedge instruments, your IRR is going to be driven by things you can estimate but not control. The real revolution of shale is its short capital cycle; numerous wells are drilled cheaply, with fast but sharply declining production. Capital invested is returned with a year or two and risk can be hedged. Conventional projects require huge upfront commitments with long payback times and consequently uncertain economics.

The recent sharp drop in oil prices hasn’t been pleasant for producers anywhere. But consider the planners of a conventional project – a Final Investment Decision to proceed is a little less certain. Once capital is committed beyond a certain point, there’s little choice but to press on and accept whatever outcome markets deliver. Whereas shale producers, the group whose success ostensibly caused the 2015 crash, can cut back activity with comparative ease. They can just stop drilling, and wait. They can take advantage of even brief rallies in crude futures to hedge production and increase output.

.avia-image-container.av-2wthy3-9c85ce9ed87fb3d9b4e596ea621b33b6 img.avia_image{ box-shadow:none; } .avia-image-container.av-2wthy3-9c85ce9ed87fb3d9b4e596ea621b33b6 .av-image-caption-overlay-center{ color:#ffffff; }

This is why capex on conventional projects continues to fall, as shown in the attached chart from a recent presentation by Lars Eirik Nicolaisen of Rystad Energy. The longer term problem is shaping up to be insufficient investment in new supply to offset depletion of existing fields and new demand (estimated to require around 6% of new supply annually, about 6MMBD, or Millions of Barrels a Day).

The recent drop in crude demonstrates no shortage of supply currently, but also makes providing new supply less attractive in the long run.

MLP investors easily recall the 50.8% drop in the Alerian Index from August 2014-February 2016, its low coinciding to the day with that for oil. We don’t know where crude prices will go over the short term, but it’s becoming increasingly clear that the U.S. is set to gain market share because its short-cycle opportunities represent a substantially more attractive risk/return than conventional projects.

Reaching the long term requires navigating the short term. While you’re doing that, consider how you’d seek your company’s Board approval for a conventional oil project requiring ten years of output to recover its upfront cost. Those shale guys in the Permian could wreck your assumptions, and then protect themselves from the damage they’d wrought by quickly cutting their own capex and production. Without an adequate response, you might feel like moving to West Texas.

We are invested in PAGP

A few weeks ago I did an interview with friend Barry Ritholtz for his Bloomberg series “Masters in Business”. It was just posted online, so for those that are interested you can find it here. Comments on MLPs are at the 65 minutes mark.


MLP Investors Digest Supply

My partner Henry Hoffman and I spent Thursday last week at the Capital Link MLP Investing Forum in New York. The mood was cautiously optimistic but certainly wary of another commodity-linked swoon in prices. Meeting one-on-one with company managements is often the best part of such events. We had a very useful discussion with Crestwood’s (CEQP) Heath Deneke, COO and President of their Pipeline Services Group, along with Josh Wannarka, Investor Relations. We gained an improved understanding of CEQP’s strategic partnerships with long-time sponsor First Reserve and JV partner Con Edison. Both these relationships are important to CEQP’s growth prospects and represent a key differentiating feature.

Companies have been reporting 4Q16 earnings over the past few weeks. For Master Limited Partnerships (MLPs), the generally positive outlook has been at odds with market performance. In February the “Trump Bump” rally in the S&P500 was only weakly reflected in MLPs, resulting in +4.0% versus +0.4% respective performance.

The Permian Basin in West Texas remains the hottest area for shale production in the U.S. Earnings calls with those companies active there focused on growing production and whether the existing take-away infrastructure would be sufficient. The U.S. produces around 9 MMB/D (Millions of Barrel per Day) of crude oil. Approximately half of that is “tight”, and half of that comes from the Permian Basin (currently producing around 2.25MMB/D). When combined with Permian natural gas output on an energy equivalent basis, production is almost 3.5MMB/D.

Permian output was the most resilient of any of the major shale plays through 2015-16 with production continuing to grow almost oblivious to the collapse in pricing. This was entirely due to the ongoing productivity improvements that have led to high single digit annual cost improvements for Exploration and Production companies operating there. The Energy Information Administration (EIA) forecasts U.S. crude production will increase by another 0.5MMB/D 2017-18, and much of that is likely to occur in the Permian.

.avia-image-container.av-4riot5-ed4bdc5f9fbf3f5a9fbc722071eeafb1 img.avia_image{ box-shadow:none; } .avia-image-container.av-4riot5-ed4bdc5f9fbf3f5a9fbc722071eeafb1 .av-image-caption-overlay-center{ color:#ffffff; }

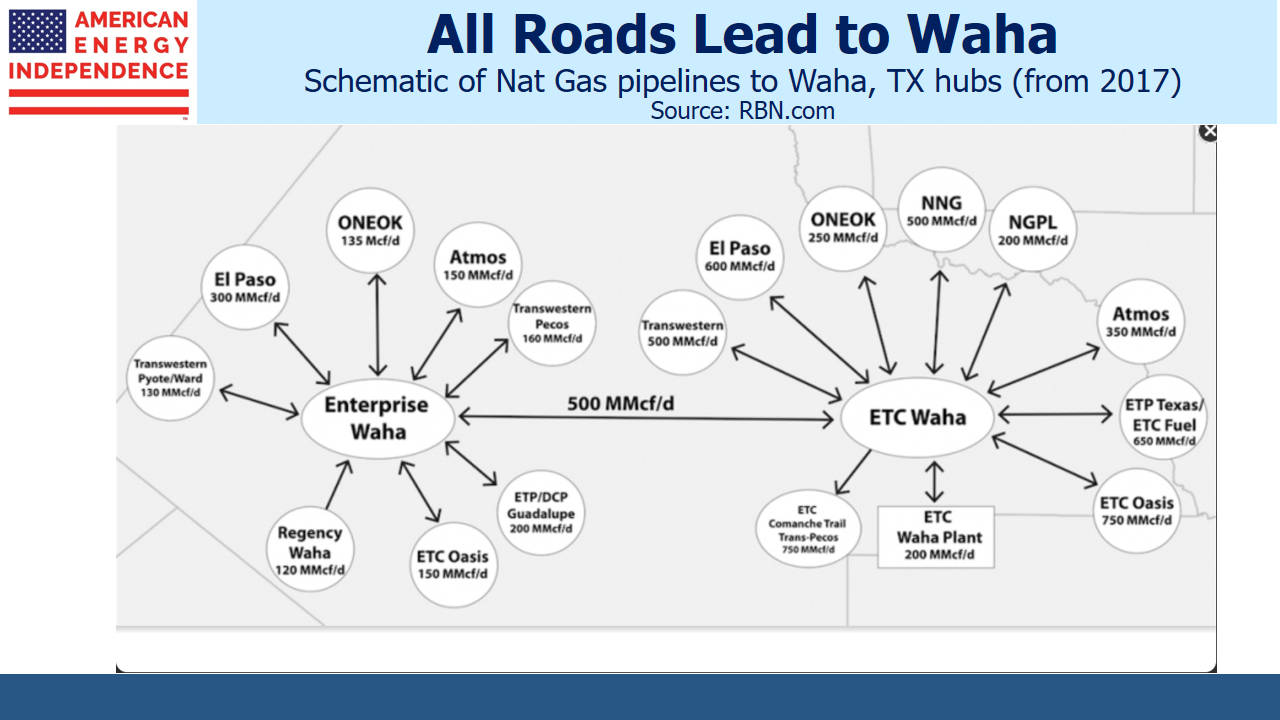
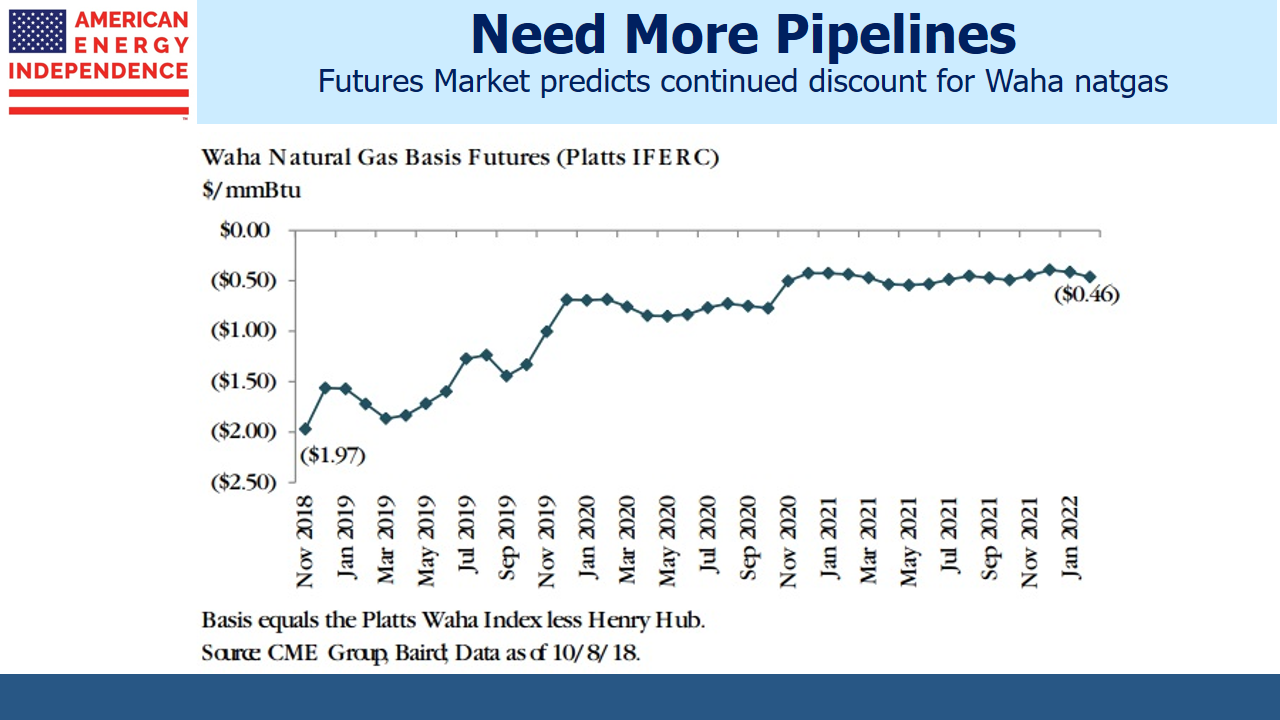
Reflecting the increased production forecast by E&P companies, several MLPs with Permian assets announced plans to increase take-away pipeline capacity where needed. These include 60MB/D (Thousand Barrels per Day) on Plain’s All American (PAGP) Cactus pipeline to Gardendale, Texas, 100 MB/D on the BridgeTex line into Houston (jointly owned by Magellan Midstream (MMP) and Plains All American (PAGP)) and 300 MB/D on the Permian Express II to Nederland, TX owned by Sunoco Logistics (SXL). In addition, Energy Transfer Partners (ETP) has an existing 100MB/D pipeline that is currently idle but could be restarted if demand was there. In summary, industry debate on this issue revolves around the ability to move increasing volumes.

This increased production is not necessarily consistent with OPEC’s objectives when they announced their own production cuts late last year. A gently rising oil price with minimal variability is their preferred scenario. Reports indicate that some OPEC members would like to see $60 oil so as to stimulate additional long term investment in new supply, thereby lowering the odds of a short-term, ruinous price spike that could hurt demand. As we’ve noted before (see The Changing Face of Oil Supply), conventional projects with their large up-front capital commitments and long payback times are vulnerable to U.S. shale production in a way that wasn’t previously contemplated.

Relying on the spot price of oil in assessing a 10+ year project is nowadays recklessly simplistic, making investments in conventional new supply riskier than in the past. Although U.S. production is growing, it won’t be sufficient to meet new global demand plus make up for depletion from existing fields (estimated at 6MMB/D, see Listen to What the Oil Price is Saying). Gently higher prices remain the most likely outcome but there’s more risk of a sharp move up rather than down.

Exxon Mobil (XOM) CEO Darren Woods reflected this new mindset in recent comments: “More than one third of the capex [capital and exploration spending] will be invested in advancing our large inventory of … short-cycle opportunities. They are primarily Permian and Bakken unconventional plays and short-cycle conventional work programs. This component of our investment plan is expected to generate positive cash flow less than three years after initial investment.”

In other words, long payback times are risky. Short payback projects are in the U.S.

The MLP investor who feels she’s missing out on the recent equity rally is rather non-plussed by this optimistic analysis. “If you’re so smart, how come I’m not richer?”

.avia-image-container.av-33awop-e932e984d66ac48ab7cb3dba7ce3bb30 img.avia_image{ box-shadow:none; } .avia-image-container.av-33awop-e932e984d66ac48ab7cb3dba7ce3bb30 .av-image-caption-overlay-center{ color:#ffffff; }

One reason is the overhang of equity being issued by some MLPs, to strengthen balance sheets and fund new projects. PAGP issued $1.3BN in equity; Targa Resources (TRGP) issued $450M to help fund it’s acquisition of Permian focused Outrigger Energy. There was also a sale of 7.2MM shares in Targa Resources (TRGP) by a private equity investor who converted warrants acquired a year ago, booking a nice profit. And a few weeks earlier Williams Companies (WMB) raised $1.9BN. The table shows the many issues of new equity in recent weeks, as well as inflows to mutual funds and ETFs. It’s an incomplete picture, and by definition the almost $6BN in equity sales has been matched with an equal amount of buying. The use of this new capital, mainly to strengthen balance sheets and fund accretive growth, is definitely positive. But over the near term this new supply approximately absorbed 1Q distributions paid by MLPs.

Another headwind is that it’s once again been a mild winter. Rapidly receding snow has plenty of appeal, but the downside is that it reduces natural gas demand. MLPs care about volumes, and we’re using less natural gas than expected to heat homes in the north.

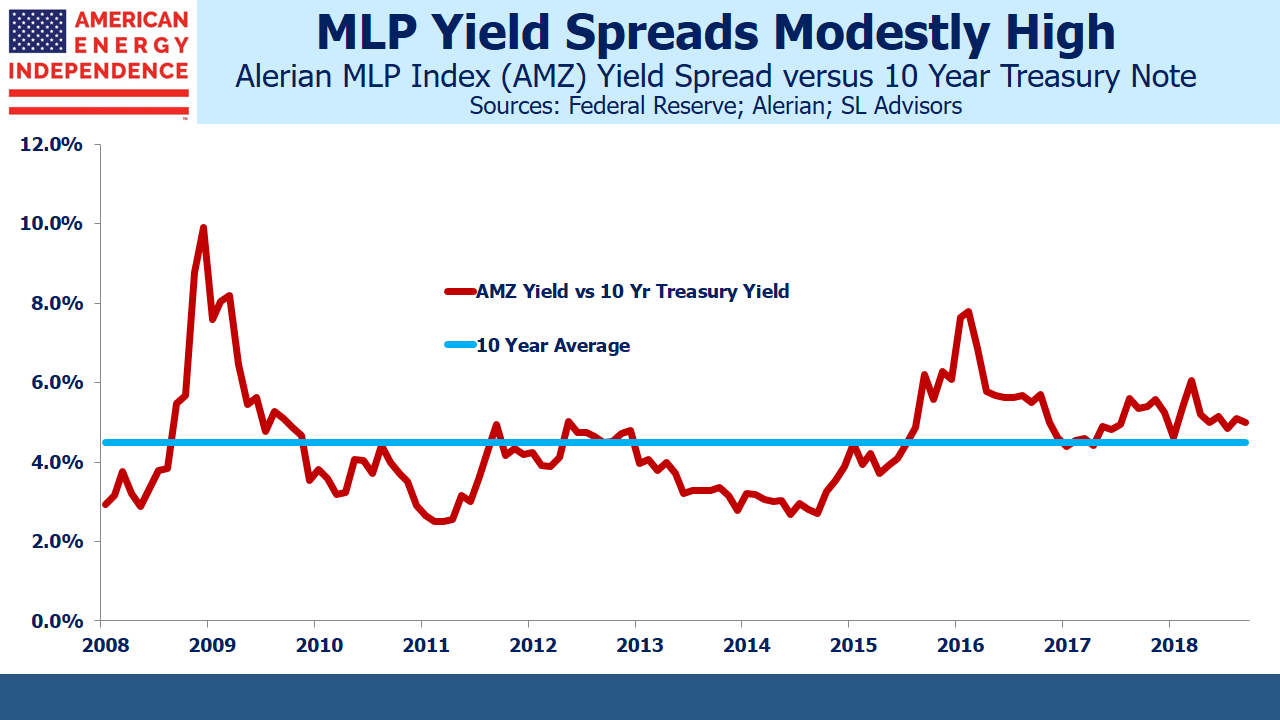
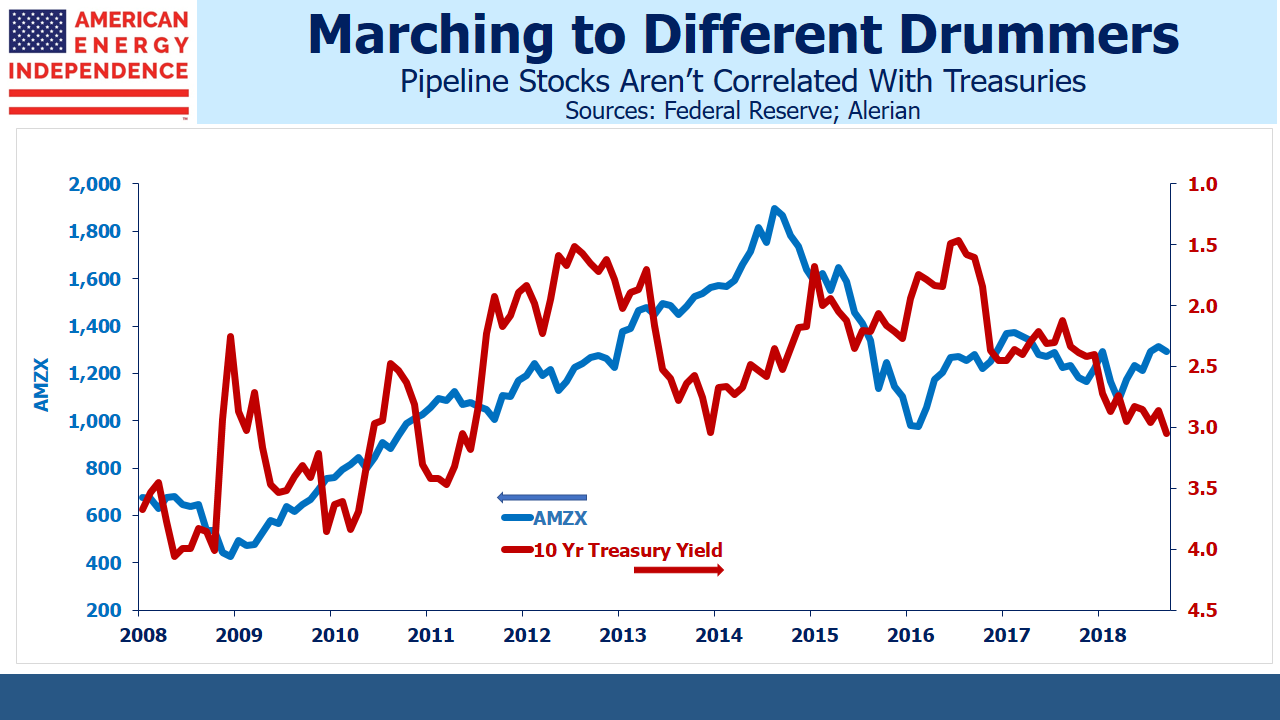
Nonetheless, valuations remain compelling. For the momentum investor it’s easy to feel good buying stocks. But for the more discerning who care about values, at a time when most sectors of the stock market are close to all-time highs, the Alerian Index yields around 6.8%, 4.6% above the ten year treasury and still 1.2% wider than the 20 year average. We may have bounced 75% off the low of February 11th, 2016 but still remain 27% off the August 2014 high.

We are invested in CEQP, MMP, PAGP, TRGP, & WMB