Some MLP Investors Get Taxed Twice

There is around $53BN invested in MLPs via ’40 Act funds – the term used to describe the three major types of funds issued under the 1940 Investment Company Act (mutual, exchange traded and closed end funds). It’s safe to say that an important motivating factor driving these selections is investors’ desire to hold Master Limited Partnerships (MLPs) without receiving K-1s. ’40 Act funds issue 1099s, which makes tax reporting simpler. We have warned before about these frogs masquerading as princes (see Are You in the Wrong MLP Fund?)

Providing investors MLP exposure while avoiding the K-1s was once an objective of industry pioneers who identified a new source of capital from retail investors, if only this problem could be solved. Although much energy and expensive tax advice were deployed, an elegant solution remained elusive at that time. All that remained was a decidedly inelegant one – offer retail investors shares in a C-corp, which would hold MLPs and issue its investors a 1099. The significant problem with this solution was that the C-corp’s returns would be subject to Federal Corporate Tax, as with any corporation. The investors in this C-corp would only receive 65% of the result, since 35% would go to the IRS.

Some dismissed this “solution” as impractical. After all, who would knowingly make an investment that could only earn around two thirds of what the assets themselves generate? But the absence of a better (i.e. more tax-efficient) solution frustrated a few, and they redirected their attention away from solving the problem to instead convincing investors that a deeply flawed structure was what they really wanted.

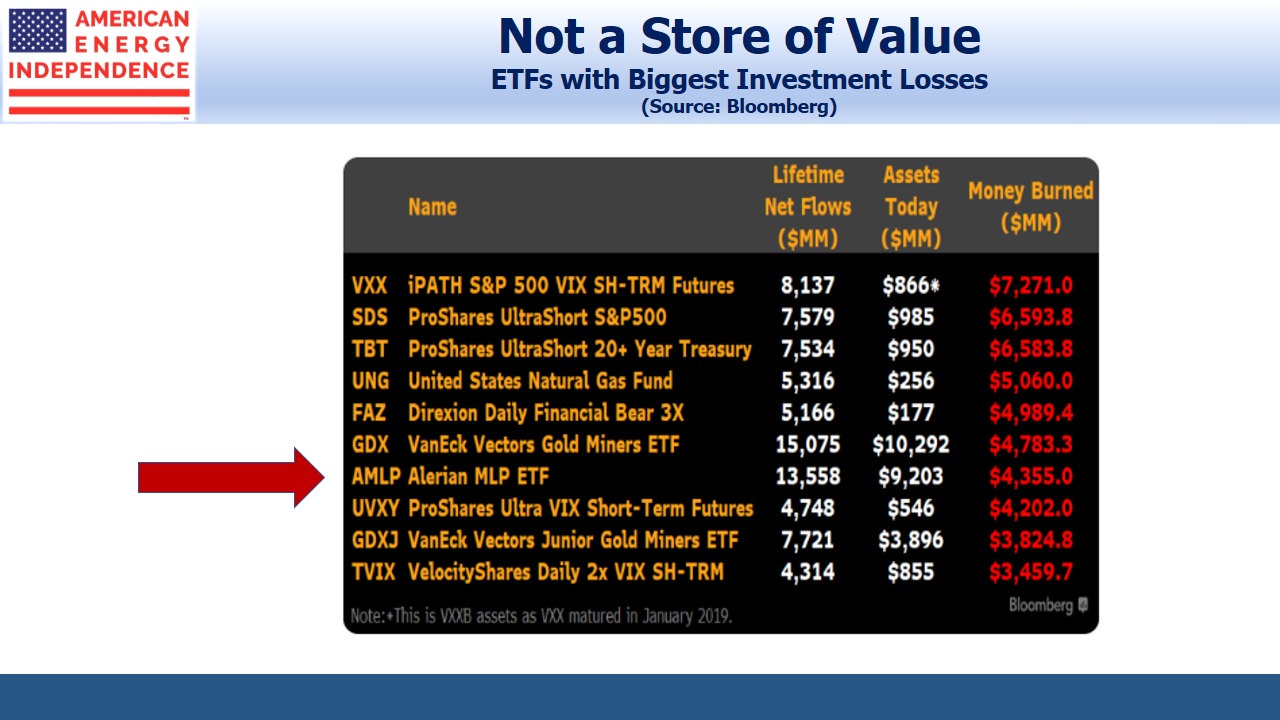
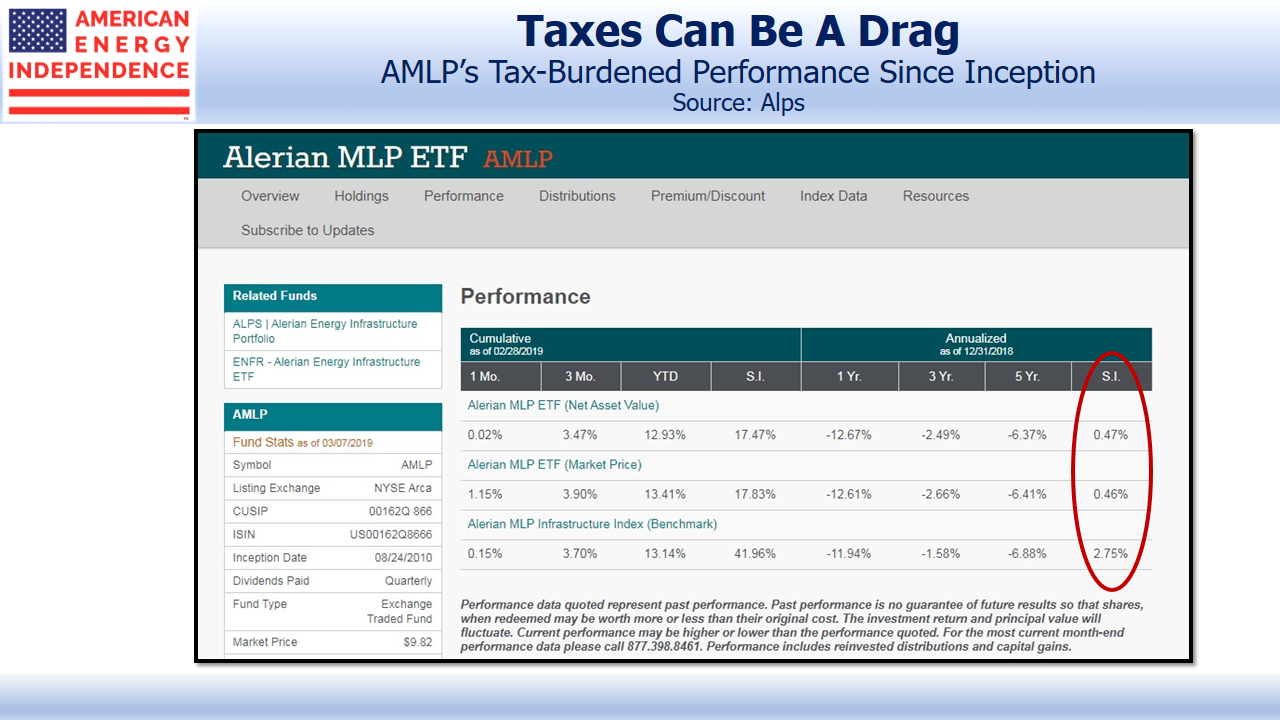
The result is that 83% of the $53BN mentioned above is invested in vehicles that have no hope of ever coming close to earning the return of the MLP sector. A careful reading of prospectuses issued by the offending vehicles reveals wording that is technically accurate while still misleading.

Quite a few claim an objective of results corresponding to their chosen index before fees and expenses. Since ’40 Act funds (outside of MLP funds) are very largely RIC-compliant (which means they don’t pay corporate tax), few MLP fund investors consider that by far the biggest line item in the inferior funds’ list of fees and expenses is taxes.

The Alerian MLP ETF (AMLP), the largest repository of mis-directed capital by poorly informed investors, goes further and says it, “…delivers exposure to the Alerian MLP Infrastructure Index”. Exposure to an asset class is not the same as providing good results from investing in it. The carefully worded prospectuses of AMLP and its tax-hindered cousins are technically correct. But I can personally attest that few holders of such securities are aware that they’ve essentially tied their running shoes together at the start of the race. What’s worse is that the tax expense isn’t deducted from the yield, but comes out of the NAV. So the 7.5% yield on AMLP is before the corporate tax expense is paid. Imagine if a corporation paid all its pre-tax cashflow out in distributions and then wrote another, separate check to the U.S. Treasury, thereby reducing its book value. That’s what taxable C-corp MLP funds are doing.

Pointing out to such an investor the mistake they’ve made is not especially fun, and I’ve had to do it numerous times. It’s somewhat akin to noting the toxic dump near an unwitting home buyer’s recent purchase. The reaction to missing such an obvious value destroyer is usually a combination of embarrassment (at their own evidently shallow research) and anger at being guided towards a fundamentally flawed investment.

.avia-image-container.av-3943b1-1c341490e1640d60638274c9d95f7b11 img.avia_image{ box-shadow:none; } .avia-image-container.av-3943b1-1c341490e1640d60638274c9d95f7b11 .av-image-caption-overlay-center{ color:#ffffff; }

Picking a tax-paying MLP fund is an especially tragic choice when returns have been good, and in some cases very good indeed. Moreover, based on recent fund flows some new investors are making the same mistake. Holders of such funds are accepting the downside risk of the sector while only being able to earn 65% of any upside. This is careless to say the least. By choosing to invest in a fund that splits its profits two thirds/one third with Uncle Sam, these investors are supporting the tax base twice – once, before they get their returns, and again after they pay their own tax obligation on what’s left.

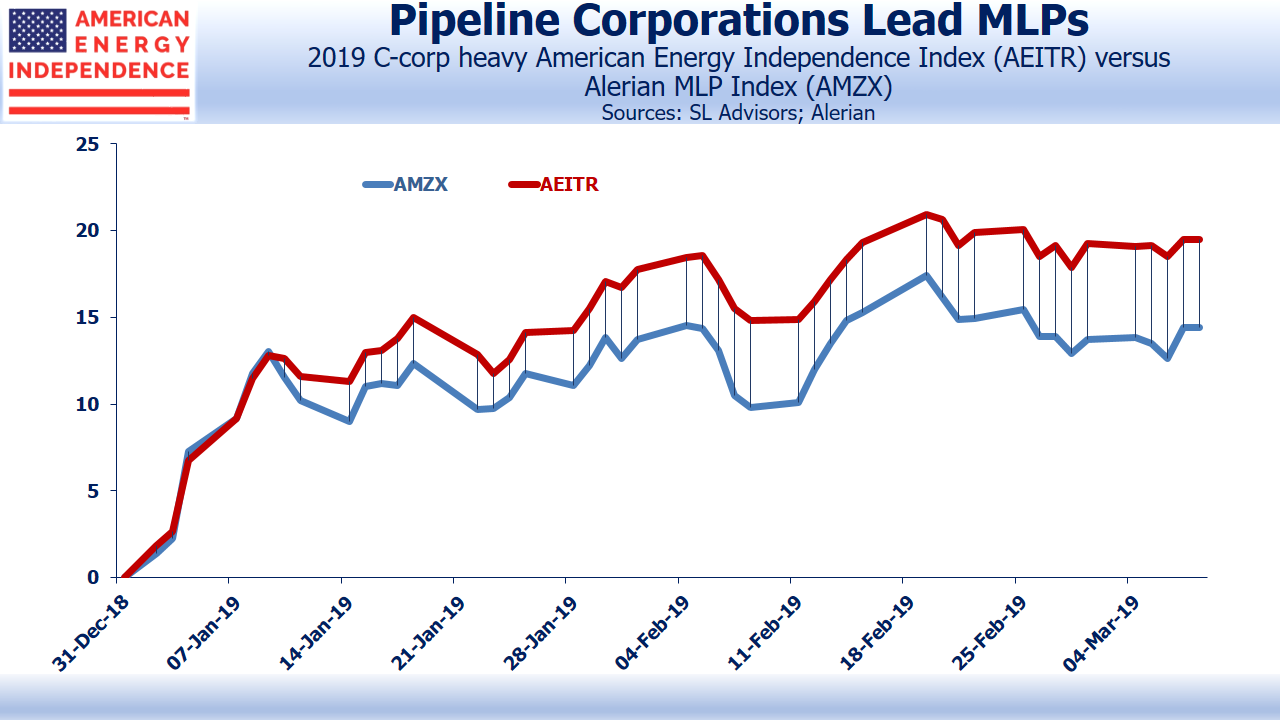
The list of such offending funds is too numerous to include here, reflecting the unfortunate tendency towards highly superficial investment research by too many investors. However, if you look at Morningstar’s list of MLP funds and sort by the 1 Year Return column, the structurally impaired can helpfully be found in an undignified heap languishing towards the bottom. At the top you’ll find the funds who thought enough of their investors to at least provide the non-taxable, pass-through structure they assumed they were buying.

If you’re invested in one of the lousy funds, correct that mistake sooner rather than later. And if your financial advisor has put you in one, you may wish to reassess the depth of research carried out on your behalf.


Wall Street Needs More Clients Like Tetra

Once again a corporate executive team has demonstrated childlike innocence when dealing with the hard-nosed providers of equity capital. Tetra Technologies (TTI) is the latest firm to combine a good business with a clueless approach to funding it. TTI supports the oil and gas industry, providing a wide array of products and services including fluids, compression equipment, well-testing and decommissioning. They are as much part of the Shale Revolution as the E&P companies that drill for oil and natural gas.

TTI decided they needed some additional equity capital as they were in danger of violating one of their debt covenants. On December 8th they issued a press release noting that the company was “…considering capital raise alternatives  to strengthen its balance sheet.” They blamed potential weakness in 2017 Gulf of Mexico activity along with the delay of certain projects from 4Q16 into early next year.

The phrase “capital raise alternatives” clearly includes more than one type of capital, and strongly suggests that the simplest form, a public equity offering, was not the most likely outcome. A reasonable guess would have been a private placement of some type of preferred security convertible into common. TTI stock duly fell as investors digested both the slowdown in revenues from certain projects and the likelihood of some additional equity dilution.

.avia-image-container.av-2nvk5h-8a223097410e71c98a7cb8c8b3b88011 img.avia_image{ box-shadow:none; } .avia-image-container.av-2nvk5h-8a223097410e71c98a7cb8c8b3b88011 .av-image-caption-overlay-center{ color:#ffffff; }

On December 9th, TTI then surprised the market by announcing a generously priced secondary offering of common equity. The 19.4 million shares (expected to be upsized to 21 million) along with 10.5 million warrants represented a substantial 33% increase of the share count, a hefty dilution for existing shareholders.

TTI’s poor handling of the offering weakened their stock price, requiring the issuance of more shares than was otherwise necessary in order to raise the desired amount of capital. To see how this is so, consider the two announcements they made twenty four hours apart.

Their first press release, on December 8th, was pointless unless they had secured capital in some form. Companies don’t have to disclose that they might raise capital. A company is always interested in raising capital if the terms are attractive. Most likely TTI believed they were sufficiently close on agreeing terms that the desired “capital raise alternatives” were pretty much done. Their stock price fell on the news.

Consequently, the announcement of a public offering the following day communicated that the presumed private capital raise implied in the prior release had fallen through. In fact, it’s highly likely that the potential investors watched TTI stock plummet after the first anouncement, and concluded that they needed more generous terms. The price of TTI now had to reflect that private equity investors had considered an investment and passed.

There was no point in the first press release. All it did was to weaken their negotiating position and eventually force them into a dilutive public offering. CEO Stuart Brightman was paid $2MM last year but only has around $3MM in TTI stock, so the market’s response to his poor handling of the capital raise didn’t cost him very much personally.

Wall Street underwriters (in this case JPMorgan and Wells Fargo) are blessed to have such incompetent clients. It makes their jobs much easier.


Give Your Loved One an MLP This Holiday Season

This is the time of year when thoughts turn to family and the holidays, but as you plan your celebrations keep in mind that MLPs care about the seasons too. In fact, MLP returns exhibit a marked pattern driven by the calendar and the idiosyncrasies of their investor base.

The chart below shows the average return for each month of the calendar year, and to illustrate how the 2014-15 bear market altered these, we’ve included what those averages were without the last two years. The most striking feature is that investing for just four months of the year gets you almost all the annual return. January, April, July and October are “distribution months”, the time when MLPs declare their quarterly distributions to holders of record (the actual payments typically go out a month later). Only those four months historically provide returns above the monthly average of 1.1%; so much above that the other eight months of the year in aggregate have provided less than a tenth of investors’ returns.

In theory an investor should be indifferent to whether a stock is about to declare a dividend or has just gone ex-dividend, but MLP investors love their distributions – irrationally so. The result is that there tend to be fewer sellers in those months as some holders opt to wait a little longer and receive that chunky payment.

.avia-image-container.av-20ev6p-6196cf5d3f7725db4b92c0c901fe21a2 img.avia_image{ box-shadow:none; } .avia-image-container.av-20ev6p-6196cf5d3f7725db4b92c0c901fe21a2 .av-image-caption-overlay-center{ color:#ffffff; }

The other clear pattern revolves around year-end. The power of distribution months wanes during the year, and is strongest earlier in the year when it combines with the turning of the calendar. K-1s are probably a factor here – clearly some investors contemplating a purchase of MLPs in November opt for delay so as to avoid the additional tax work of a K-1 for the last few weeks of the year. Similarly, selling before year-end rather than just after avoids an additional K-1 for a few weeks of exposure. Both factors tend to create more motivated sellers late in the year and more motivated buyers early in the new year. And many investors intersperse family time over the holidays with some personal portfolio analysis, at least some of which results in the decision to buy more MLPs in January.

Of course, seasonal patterns don’t always work, and in any one year the power of the prevailing trend can overwhelm these factors. Last year was an example, and January 2016’s -11% result was the worst of any January for the 21 years of the Alerian Index’s history. This one month was sufficient to turn April into the seasonally strongest period of returns, pushing January to #2. Nonetheless, January has been profitable 76% of the time since the inception of the Alerian Index in 1996.

But as long as the seasonal patterns are caused by something, they are likely to prevail more often than not. K-1s, investors’ attraction to MLP distributions and year-end planning all remain part of the financial landscape. Therefore, it’s worth paying attention to these because if you’re contemplating the timing of a buy or sell, understanding these forces could help you achieve a better result. As with many investment decisions, it’s worth bucking the trend. So November isn’t the best time to sell. For that, wait until the end of January or after the first month of the quarter.

Most obviously, if you expect to pore over your investment portfolio during a quiet moment in late December, anticipating your MLP purchase decision and executing it a few weeks earlier could brighten up your returns. And if you do follow this advice and present your better half with a seasonally informed MLP gift, you might want to include some bling too, in case the romance of a well timed security purchase is lost on her.


The Flexibility of MLPs

A couple of weeks ago we came across a research note from Wells Fargo titled “Do MLPs Still Make Sense?” Their conclusion was a qualified “Yes”, although it’s not wise to be highly negative when you have a thriving business underwriting their equity offerings.

Last year’s collapse in the sector provoked the question. In our view, this wasn’t so much an issue of operating performance but one of financing growing capital expenditures. As we wrote in The 2015 MLP Crash; Why and What’s Next, the Shale Revolution has led to a substantial increase in the demand for new energy infrastructure, since the new reserves of hydrocarbons are not always well served by the traditional infrastructure configuration (i.e. North Dakota was only recently a significant region for crude oil production; similarly so for Pennsylvania and natural gas).

By 2014 the needed cash to finance this growth exceeded the cash generation capacity of the MLP sector. Since MLPs don’t retain earnings, they mostly tap the capital markets for such finance. The multi-year nature of many projects led to a “just-in-time” philosophy around financing in the same way manufacturing businesses maintain minimal supplies of inventory to limit their need for working capital. A temporary closure of the capital markets as the most recent MLP investors (mostly ETF and mutual fund buyers) fled late last year exposed this model. MLPs have taken many steps in response including greater distribution coverage, less leverage and higher return targets on new projects. They’ve adapted.

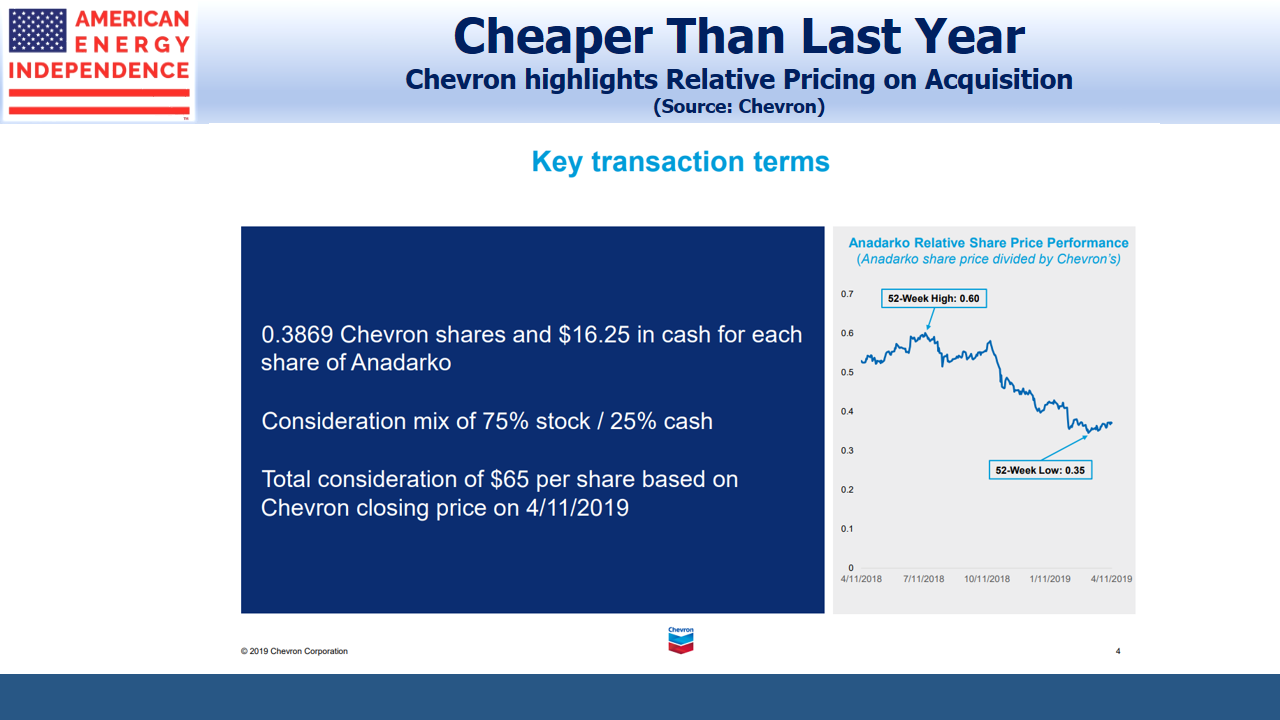
It really comes down to whether the Master Limited Partnership structure combined with the General Partner is the best way to finance the assets. Since MLPs are pass-through vehicles with no tax liability, it’s hard to improve on a tax-free structure as the holding vehicle. Any corporation holding eligible assets will be subject to Federal corporate income tax on the profits, which is why a common maneuver is to “drop down” those assets from a C-corp parent into an MLP. The C-corp often retains control through its GP interest in the MLP, and shares in the future economics without providing the capital. The retained connection can be value-enhancing for both entities. An Exploration and Production (E&P) company can finance its E&P assets as a C-corp where capital is cheapest, but still control the infrastructure critical to supplying its customers while using cheaper, MLP capital. Examples include Devon Energy (DVN) with Enlink Midstream Partners (ENLK) and Anadarko Petroleum (APC) with Western Gas Partners (WES). The MLP/GP structure often exists as a symbiotic relationship.

.avia-image-container.av-3qj8fg-251a494018319684d9c6a4ee2b0b0a64 img.avia_image{ box-shadow:none; } .avia-image-container.av-3qj8fg-251a494018319684d9c6a4ee2b0b0a64 .av-image-caption-overlay-center{ color:#ffffff; }

There are many analogous financing structures to be found. As regular readers know, we like the comparison with hedge funds and private equity, where the MLP is the fund and the GP is the hedge fund/private equity manager. The fees paid to the manager clearly take away from the returns earned by the investors – indeed, in the case of hedge funds, spectacularly so as I have often noted (see The Hedge Fund Mirage). However, the size and history of alternatives (hedge funds, private equity and real estate) confirm that a substantial pool of capital is available to finance assets that require active management with payments to the operators. MLP investors are in many ways better off than the investors in these private partnerships; they have the liquidity to sell whenever they want, their investments are subject to all the disclosures of publicly listed companies, and the ten year annual return of 9% is better than REITs, Utilities, the S&P500, Bonds and, most assuredly, hedge funds.

Another analogy is with companies that have two or more classes of equity outstanding. Alphabet (GOOG) and Facebook (FB) both sold shares to the public that allowed the founders to retain substantial control. You’re unlikely to see an activist acquiring a position in these two companies when their performance stumbles, because voting control doesn’t lie with the public shareholders. Clearly, to a substantial number of investors this passive ownership is no barrier. GOOG has returned 12.5% p.a. over the past decade, better even than MLPs.

.avia-image-container.av-37hksc-38b3dcac48883de51deee4f1c19b2d3f img.avia_image{ box-shadow:none; } .avia-image-container.av-37hksc-38b3dcac48883de51deee4f1c19b2d3f .av-image-caption-overlay-center{ color:#ffffff; }

From time to time investors ask us whether GPs are more volatile than MLPs, and therefore more risky. The history on this topic doesn’t go back that far, because only in recent years has a sufficient number of MLP GPs been publicly available to create a portfolio. Our own Separately Managed Account strategy (which focuses on GPs) has outperformed the Alerian Index by 4.0% p.a. since inception, albeit with modestly higher volatility (20.6% versus 19.8%). Last year certainly saw cases of GPs falling more than MLPs; perhaps most memorable was the 80% collapse in Energy Transfer Equity (ETE) from June 2015 to April 2016. This was mostly due to the ultimately failed effort to merge with Williams Companies (WMB), but nonetheless is now part of the historic performance of MLP GPs.

Financial performance of MLP GPs is highly correlated with the MLPs they control but not obviously more volatile. GPs can exercise substantial control over their cashflows by, for example, directing their MLP to raise capital or divest assets. Moreover, most MLPs today are investing in new infrastructure in support of the Shale Revolution. This increase in their assets will continue to benefit their GPs, similarly to how hedge fund asset growth directly profits the hedge fund manager. If you could buy a hedge fund manager knowing his assets would be growing, how much concern would you really feel over the volatility of his cashflows given that they’ll be increasing?

Finally, MLPs can get too big. Like hedge funds, beyond a certain size it can be hard to generate attractive returns while still growing. There is, in effect, a lifecycle to MLPs. Kinder Morgan (KMI) most obviously demonstrated this. Their solution, to collapse their structure back into a C-corp, was inevitable in hindsight if clumsily executed (see Rich Kinder’s Wild Ride). In 2014 when KMI acquired the assets of Kinder Morgan Partners and El Paso, its two MLPs, the stepped up cost basis created a substantial tax shield for KMI (see The Tax Story Behind Kinder Morgan’s Big Transaction). These two MLPs had depreciated their assets far below their economic value, to the profit up until then of their taxable investors who directly benefited from tax-deductible depreciation not matched by actual economic depreciation in those assets. KMI revalued them, thereby creating a much higher annual depreciation charge on these same assets.

The next logical step will be for KMI to drop down some of these assets into a newly created MLP where the cashflows will not be taxable and the investors in this new MLP can benefit from this higher depreciation. It’s probably too soon for KMI to contemplate such a move, but the tax code creates the possibility of a virtuous cycle whereby assets are first dropped into, and depreciated in, an MLP; subsequently acquired by the C-corp parent with a stepped-up cost basis that resets the depreciation based on current values; and then later dropped again into an MLP. As long as the assets involved have recurruing cashflows, minimal need for maintenance capex and appreciate over time, it’s a legitimate strategy.

The MLP/GP structure contains myriad possibilities. Note also that in November the U.S. was a net exporter of natural gas. Existing in support of an industry that is taking America towards Energy Independence, we think adverse changes to the tax code are highly unlikely and that MLPs have a rich future.

We are invested in ENLC (GP of ENLK), ETE, KMI, WGP (GP of WES), and WMB


Energy Transfer Shows Who's the Boss

Ten days ago, investors in Energy Transfer Partners (ETP) were content with a high distribution yield of 11%, albeit with little growth and (if they were honest with themselves) some risk of a cut in the future. Investors in Sunoco Logistics (SXL) had similarly come to terms with a 7.6% yield bolstered by the prospect of high single digit growth. The buyers of each security had self-segregated to the combination of current income and growth prospects that suited them.

Once again, Energy Transfer Equity (ETE) CEO Kelcy Warren has surprised, creating sharp price movements and fresh blog material in the process. As General Partner (GP) of ETP and SXL, ETE controls them both, and that control was on full display. So it is that SXL is acquiring ETP, upsetting the basis on which investors in both securities had made their decisions. ETP investors currently receive a $4.22 annual distribution. In exchange for their ETP units they’ll receive 1.5 SXL units. SXL pays a $2.04 distribution, so the new $3.06 distribution (i.e. $2.04 X 1.5) represents a 27.5% cut for ETP investors. They weren’t happy.

Meanwhile, SXL’s high single digit distribution growth prospects may now be challenged following its combination with the slower-growing ETP assets, although the $200MM in annual operating synergies will help. In short, ETP and SXL investors will both shortly own something different than they bought. If ETP investors had favored growth over income they would have already held SXL. It was a demonstration that Limited Partners (LPs) in MLPs are limited in more ways than one.

Both ETP and SXL were down sharply once the deal was announced. It’s not an obviously bad transaction, and Kelcy Warren made a good case for the combination on a conference call later the day of the announcement. It just imposes a different return profile on current investors than they sought. So there will probably be some turnover as the unhappy sell their holdings to the optimistic.

.avia-image-container.av-2klo9s-eb0ea5eec5a7c56435bc0757c92689a4 img.avia_image{ box-shadow:none; } .avia-image-container.av-2klo9s-eb0ea5eec5a7c56435bc0757c92689a4 .av-image-caption-overlay-center{ color:#ffffff; }

The winners include ETP bondholders, since less cash paid to equity holders in the form of distributions means improved debt coverage. The other winner is ETE, which shouldn’t be surprising because that’s where Kelcy Warren invests his money. Although near term Distributable Cash Flow (DCF) to ETE will be lower than before, since distributions to the former ETP investors will be lower, it makes the Incentive Distribution Rights (IDR) forgiveness that ETE has extended likely to lapse within a couple of years rather than possibly continuing on. The new SXL will be larger and more diversified, which should in time lead to a lower cost of capital.

We’re invested in ETE, alongside management because that’s what we do. Even that close alignment doesn’t always guarantee success; earlier this year we noted how Kelcy Warren issued new convertible preferreds to himself and the management team that gave them the ability to reinvest dividends at a fixed, low price of ETE (see Is Energy Transfer Quietly Fleecing its Investors?). As a result, Kelcy is regularly buying new ETE units at $6.56 each, the level they hit earlier this year because of his ill-advised pursuit of Williams Companies (WMB), even though the collapse of that transaction and subsequent rebound in the sector has taken ETE back as high as $18.

Investors in ETE are there rather than ETP or SXL precisely because we understand the favorable asymmetry that benefits the GP. The dilution of ETE investors that these convertible preferreds causes was therefore a bitter pill for the non-management ETE investors to swallow. A class action lawsuit followed (Energy Transfer Equity LP Unitholder Litigation), in which the plaintiffs alleged these securities unfairly transferred wealth from them to management. Based on reviewing the transcript of oral arguments earlier this month, the memorably named Judge Glasscock appears to be sympathetic to this claim although allowed that he needs to study the relevant documents before ruling. If the offending securities are cancelled as they should be, a future transfer of well over $1BN in ETE interests to management will not take place.

Faced with the prospect of investing in someone who so easily abandons his fiduciary obligation to his investors, we were tempted to give up on ETE. However, they’re a smart management team and fortunately we allowed our commercial instincts to trump our principles. It’s what Kelcy would have done.


Political Change Supports Energy Infrastructure

We believe energy infrastructure (Master Limited Partnerships, or MLPs) should be one of the clear winners from last week’s election. There are two aspects to this:

Regulation.

Earnings calls with MLP management have increasingly included discussions of what many perceive as a hostile regulatory environment. New York State’s ban on fracking is one example, but more meaningful was the set of decisions in New England that led Kinder Morgan (KMI) to cancel its North East Direct (NED) pipeline project. The northeast U.S. is short of natural gas transmission and storage capacity, with the result that in the winter New Englanders pay very high prices for natural gas. NED was planned with the intention of alleviating this situation, but a Massachusetts Supreme Court ruling prevented utilities from making long term commitments for pipeline capacity. Without such long term commitments KMI determined that the returns from the project were inadequate and uncertain, so it was cancelled.

Another more recent example is the Dakota Access Pipeline (DAPL), currently under construction by Energy Transfer Partners (ETP). Whatever your view on whether the pipeline should be built or not, it seems clear that ETP complied with regulations in how they sought approvals for the pipeline’s route. In spite of the Courts rejecting challenges to the project, the Administration took an interest late in the day and over-ruled the Army Corps of Engineers (the Federal agency responsible for approving the route). The result has been a delay in pipeline completion, with a corresponding delay in its cashflow generation and a rapidly deteriorating return on investment for ETP. The Administration’s unexpected involvement cast uncertainty over any new project relying on Federal approval. It appeared capricious and motivated by the election rather than ETP’s failure to follow the correct process. An extensive examination of the background is here. As a result of the election the project now looks likely to be approved, possibly within days but certainly once Trump is in office.

Perhaps most famously, the application to build the Keystone XL Pipeline was held up for years by the State Department (it fell under their jurisdiction since it crossed the border with Canada) before finally being denied. The extended period of uncertainty added to its costs, which eventually resulted in TransCanada Corp (TRP) writing off C$2.9BN, as well as causing friction with our northern neighbor in their efforts to move crude oil more efficiently and safely. This was also poor policy, justified as an effort to impede Canada’s development of its oil sands resource because of the negative environmental effects. TRP subsequently sued the U.S. for $15BN in foregone value creation. It’s possible the project may be resurrected next year.

Investors often ask us if the Obama Administration’s hostile stance towards fossil fuels is negative for MLPs. Over the past eight years, volumes of crude oil, natural gas liquids and natural gas produced have climbed substantially so the raw numbers don’t reflect an anti-fossil fuel bias. However, the episodes described above do, and regulatory uncertainty has had a growing impact on which projects get done. Developing our energy infrastructure is key to America attaining Energy Independence, a state that is not far away in natural gas and perhaps attainable in crude oil within a decade.

The incoming Republican administration can be expected to adopt a regulatory philosophy that is more supportive and predictable. This can only be good for MLPs.

Trade

We don’t know much detail yet about how U.S. trade policy will shift. However, it’s not a stretch to suppose that a pronounced bias towards domestic production of many things could include crude oil. Although we currently produce around half the crude oil we ultimately consume in the form of refined products, tariffs on crude oil imports would favor additional growth in domestic production and would not obviously be at odds with the type of trade policy articulated by Candidate Trump. Relying more on our own resources has the added benefit of reducing our economic exposure or even interest in regions such as the Middle East. There could be perceived national security benefits from being more self-reliant.

There’s also the possibility that a Trump Administration could withdraw from the nuclear deal  with Iran which might in turn lead to the reimposition of sanctions, curtailing Iranian crude oil exports.

We offer no view on whether such policies are good or bad; we’re only focused on making the most sensible investment choices under existing circumstances. Public policy is clearly moving in a direction that places America’s near term interests first. The election was unequivocally positive for MLPs.

We are invested in ETE, KMI and TRP

.avia-image-container.av-2toj7w-f1a374ed7a579e6c464a0fb3f4d4ea60 img.avia_image{ box-shadow:none; } .avia-image-container.av-2toj7w-f1a374ed7a579e6c464a0fb3f4d4ea60 .av-image-caption-overlay-center{ color:#ffffff; }


Initial Reaction to the Election

As we all digest the election results, and amid much near term market uncertainty, a few thoughts:

Good businesses in America will for the most part still be good businesses. The shift in political direction will likely include less regulation and in some cases deregulation. Domestic energy infrastructure with its ability to exploit America’s shale resources and limit our dependence on crude oil exports is unlikely to be one of the economy’s losers. While the turmoil in equity markets raises concern of an economic slowdown, the operating performance of midstream Master Limited Partnerships (MLPs) was only modestly affected by last year’s collapse in crude oil prices. Energy consumption in the U.S. is remarkably stable from year to year, and fee-based contracts that limit commodity price risk are widely employed. We think in times of uncertainty, investments in domestic energy infrastructure are one of the more robust choices you can make.

With promises of tax cuts, infrastructure spending and a vow to replace Janet Yellen because of the Fed’s low rate policy, there’s little reason to be constructive on bonds.

.avia-image-container.av-2a6dfr-9dc9d8797b52573ed821a6cad85f80e5 img.avia_image{ box-shadow:none; } .avia-image-container.av-2a6dfr-9dc9d8797b52573ed821a6cad85f80e5 .av-image-caption-overlay-center{ color:#ffffff; }


Stability with Falling Costs in MLP Earnings

Last week saw the bulk of our MLPs reporting on quarterly earnings. The drop in crude oil and tightening election probably counted for more as the market was weak. But we felt earnings were generally in line with expectations with few negative surprises. There were plenty of questions on the regulatory environment for new projects. In response to a less certain and more drawn out approvals process, MLPs are revising their assumptions about how long projects take as well as steering away from less friendly areas such as New England. Several noted that pipes already in the ground have greater value as it becomes harder to build new ones.

Plains All American (PAA), reported results that were a little weaker than expected in spite of positive developments in the Permian. The existence of Minimum Volume Commitments (MVCs) makes it harder for them to forecast take-away demand even if they can forecast supply. This is because excess pipeline capacity in a region can cause E&P companies to take decisions that would otherwise seem uncommercial because of an MVC. If you’ve committed to buy pipeline capacity and have to pay for it regardless of whether or not you use it, this can cause you to ship oil or gas as long as the net revenue offsets some of the MVC. This squeezes margins and skews basis differentials.  Since contracts are private, it’s hard to know who’s acting based on an MVC versus more normal economics. PAA CEO Greg Armstrong commented on this issue during their call and noted how even with PAA’s detailed knowledge it makes forecasting demand harder.

We are invested in Plains GP Holdings (PAGP) which will soon merge with PAA. We expect U.S. crude oil production to increase slightly over the next several quarters and significantly over the next several years and PAA/PAGP should see increased cashflows from higher utilization of their pipeline network.

A couple of things stood out to us and are displayed below. Enlink Midstream Partners (ENLK) and its General Partner Enlink Midstream LLC (ENLC) reported solid earnings. In 2015 MLP prices fell far in excess of what was justified by the fundamentals. The slide from ENLK’s recent earnings call shows stability in metrics such as their Leverage Ratio, which ranged from a low of 3.7X to a high of 4.0X over the past seven quarters and is now back to 3.75X. Distribution coverage has stayed virtually unchanged. And yet in February ENLK had lost two thirds of its value from a year earlier. The emergency liquidation by many investors, seemingly without regard for the fundamentals, was responsible.

.avia-image-container.av-4gsg4v-4f9403e70df31ef8707447c00f3702b1 img.avia_image{ box-shadow:none; } .avia-image-container.av-4gsg4v-4f9403e70df31ef8707447c00f3702b1 .av-image-caption-overlay-center{ color:#ffffff; }

Another interesting chart was from Anadarko Petroleum (APC), who control Western Gas Equity Partners (WGP) by virtue of their 78% ownership. WGP in turn is the GP of Western Gas Partners (WES). APC’s onshore drilling activity is in the Delaware Basin in West Texas and DJ Basin in Colorado and Wyoming. They’re  WES’s biggest customer, and so APC’s ability to reduce costs over the past couple of years impacts volumes passing through WES’s midstream infrastructure.

.avia-image-container.av-2o2ue7-a873693e41559f50f97cdf952be4bc32 img.avia_image{ box-shadow:none; } .avia-image-container.av-2o2ue7-a873693e41559f50f97cdf952be4bc32 .av-image-caption-overlay-center{ color:#ffffff; }

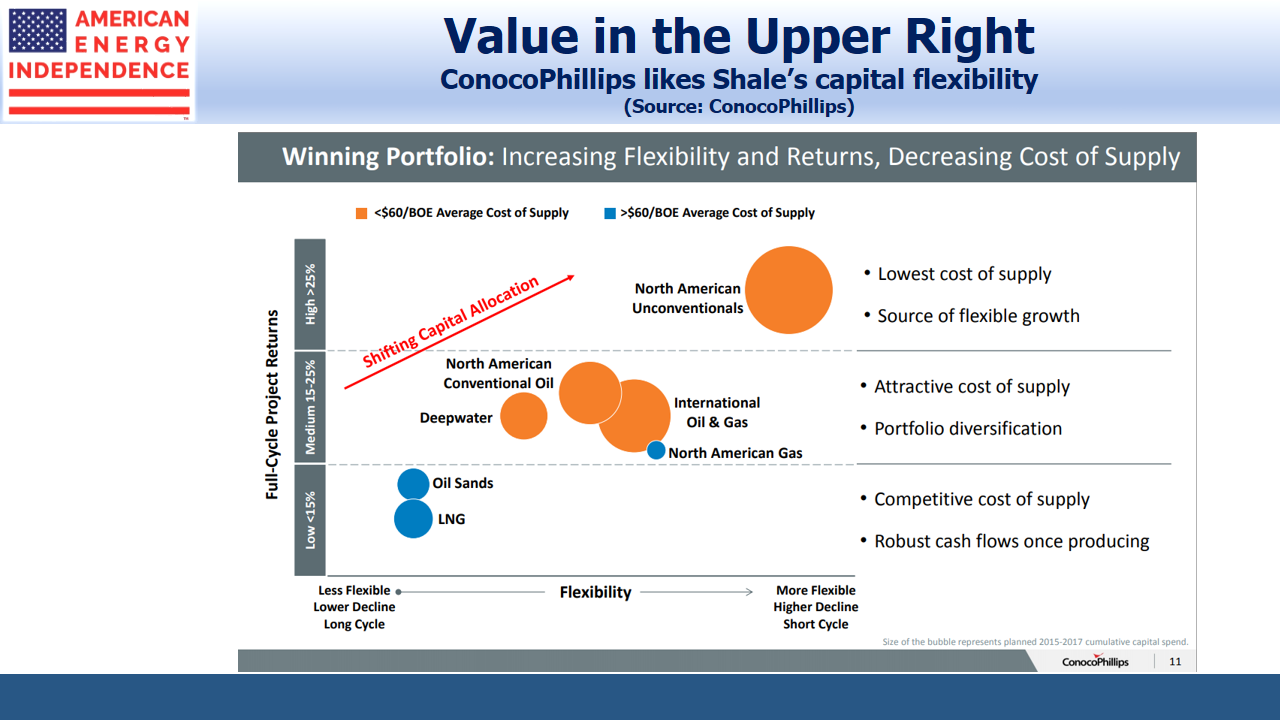
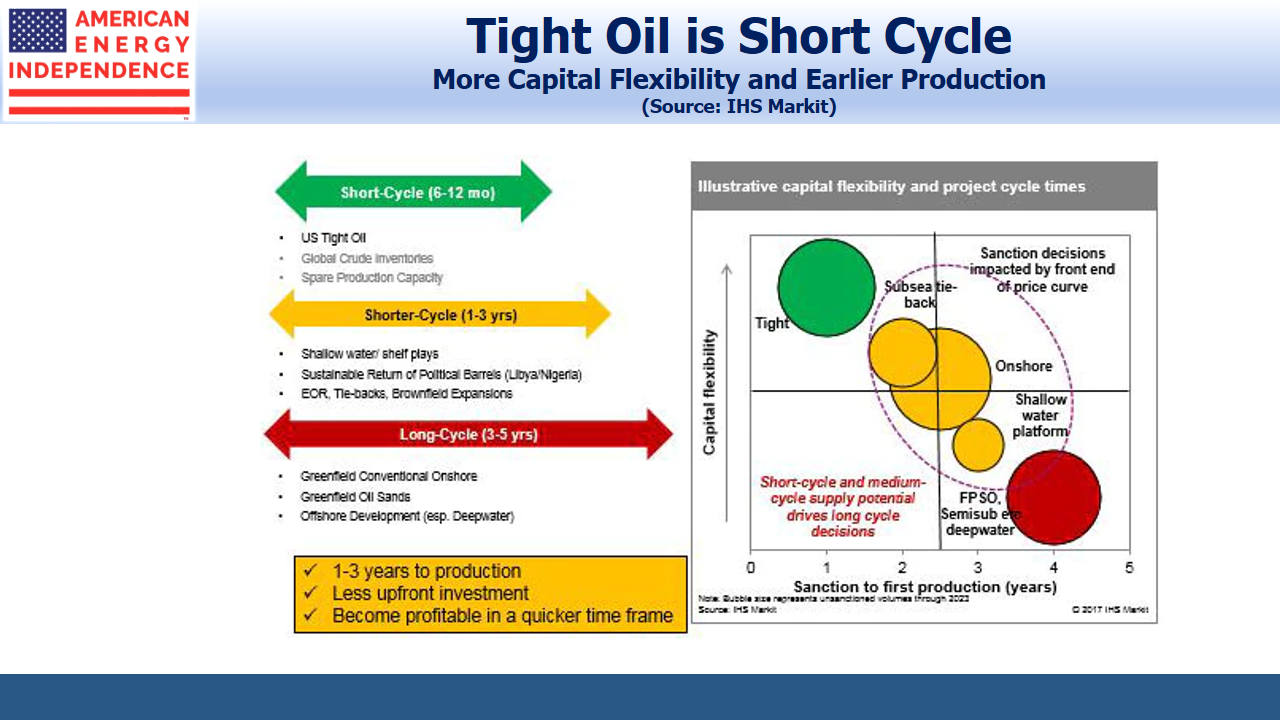
APC now reports that their cost to drill a well is below $5MM, and their breakeven to produce an acceptable return on capital is $35 a barrel. Shale drilling is characterized by numerous wells cheaply drilled with fast payback times, by contrast with conventional projects that require high up front investment and long payback times. This is why we believe U.S. producers with access to “tight” oil are becoming the swing producers; more nimble than conventional suppliers, they can respond more easily to price signals. For more on this, see Prospects Continue to Brighten for U.S. Energy Infrastructure and OPEC Blinks.

Regarding OPEC, the strategy embarked on two years ago of seeking market share at the expense of price has been a colossal failure. A recent article by the Petroleum Economist (only available to subscribers) noted that OPEC’s oil revenues had plunged from $0.75TN during  the twelve months ending October  2014 to 338BN over the past year, a drop of 55%. OPEC may fail once again to restrain output among its members, but regardless they have helped usher in a far more efficient era in U.S. shale production (see Why the Shale Revolution Could Only Happen in America). The Petroleum Economist article closes with, “OPEC lost this battle – and it knows it. It is tired of cheap oil.”

We are invested in ENLC, PAGP and WGP


Can MLPs Go Global?

We’re into earnings season for public companies including Master Limited Partnerships (MLPs). Quarterly report cards on performance should provide useful information on the nascent recovery in the U.S. energy sector.

When they reported 3Q16 earnings Buckeye Partners (BPL) caught our attention with their investment in VTTI BV, a global owner of storage and terminalling assets headquartered in the Netherlands. VTTI BV is owned by Vitol, a privately held energy company. Beneath VTTI BV is a publicly traded MLP, VTTI Energy Partners, LP (VTTI). BPL and VTTI/Vitol  are in similar businesses, albeit BPL is in the U.S. while VTTI/Vitol are worldwide.

BPL has bought 50% of the General Partner of VTTI for $1.1BN, an investment whose returns are virtually all going to come outside the U.S.. It’s quite a thought provoking move. The MLP structure is a consequence of the U.S. tax code. MLPs generally don’t pay tax on their income because their investors do. There are substantial tax disincentives for non-U.S. investors and U.S. tax-exempt investors to invest directly in MLPs. It’s not impossible but in most cases prohibitively costly. Because MLPs aren’t taxed, they have a cost of equity capital advantage over an otherwise identical business structured as a C-corp.

.avia-image-container.av-1um3nk-3a94cafc7c68acd684f796f9617a0b96 img.avia_image{ box-shadow:none; } .avia-image-container.av-1um3nk-3a94cafc7c68acd684f796f9617a0b96 .av-image-caption-overlay-center{ color:#ffffff; }

(Diagram from Buckeye’s presentation on the deal)

But this advantage ought not to extend beyond the U.S. The profits  earned by a refined product terminal located in, say, New York aren’t taxed at source because the investors are U.S. taxable and report their proportional share of the income on their tax return via a K-1. But why would the Dutch, or South Africans similarly extend this advantage to physical assets in their country owned by VTTI, a U.S. listed MLP? And in fact they don’t, which ought to eliminate the MLP cost of equity advantage and restrict the MLP structure to holding U.S. assets.

VTTI is a partnership but chooses to be taxed as a corporation. And it does pay tax, at an average rate of 24% over the past four years according to their 2015 10K. The Netherlands, Malaysia, U.S. and Belgium all receive tax from VTTI, reflecting their far-flung footprint. So we have a tax-paying entity with a GP entitled to Incentive Distribution Rights (IDRs), a low growth investment that trades at a 7.3% yield based on their most recently declared quarterly distribution of $0.3281.

Most MLP GPs are earning 50% of the marginal dollar of Distributable Cash Flow (DCF) earned by the MLPs they control. VTTI isn’t yet there. IDRs come with DCF thresholds, similar in concept to the marginal tax rates that kick in as your income rises. VTTI’s GP is at the top of the 15% IDR share. Beyond $0.328125 per unit they get 25% and above $0.39375 they get 50%. Vitol, and now BPL, will increasingly participate in per unit DCF growth. Vitol  retains storage assets at the parent level which they can sell (“drop down”) to VTTI as well as $600MM of new projects under consideration. So there’s some visibility around how they might grow DCF.

The question is, why is this structure working with non-U.S. assets whose income is already being taxed before it reaches the equity owners? For the answer, look to Williams Companies (WMB). In August, we noted that WMB had recognized they had two types of investor: income-seeking MLP investors who hold Williams Partners (WPZ), and growth seeking investors who hold WMB. So when WMB cut its dividend in order to invest in WPZ, both sets of investors found something to like. WPZ investors liked the support this gave to their distribution, while WMB investors cheered the redirection of their dividends into a high yielding security. Both securities rose. WPZ is “YieldCo”, generating steady income. WMB is “GrowthCo”, with better growth prospects. In Williams Satisfies Two Masters we explained our thinking.

The VTTI structure works because VTTI investors are most focused on income, and won’t drive the yield on VTTI down much for the promise of faster growth. So that growth is partly redirected via the GP IDRs to VTTI BV, and now to BPL as well.

It’ll be interesting to watch, because on the earnings call BPL didn’t identify operating synergies as being that important to them. They are financial investors in a sector they know pretty well. They now own a GP. The MLP model  is showing its applicability globally, not through a tax advantage but via its ability to separate cashflows and meet the specific needs of different investor segments, lowering its cost of equity.

We are invested in BPL and WMB.


Prospects Continue to Brighten for U.S. Energy Infrastructure

A few seemingly unrelated pieces of news caught our attention last week. Together, they provide a useful perspective on why U.S. energy infrastructure offers such an attractive return potential.

Khalid al-Falih, Saudi Arabia’s Energy Minister, warned of a looming shortage of crude oil with the risk of a consequent price spike. This may seem like an odd concern given last year’s collapse in prices, but the Saudis are looking farther ahead than the drawdown of existing stockpiles. He recognizes that the $300-400BN slashed from drilling budgets this year, and the estimated $1TN cut through 2020, will lead to much less new supply coming online than might have been the case had oil stayed at $100 a barrel where it was in 2014. There’s a substantial time lag between committing to a new project and producing oil. Volatile prices hurt demand, and are therefore not in the interests of suppliers either. We wrote about precisely this issue in Why Oil Could Be Higher for Longer.

However, Rex Tillerson, Exxon Mobil (XOM) CEO, offered a contrasting view based on the resurgence in shale output in the U.S. being capable of responding to higher prices with increased output.  Unlike conventional oil projects with their large upfront investment and long payback times, shale drilling involves numerous fairly cheap wells and high initial production. This means payback times are shorter and production can be quickly curtailed when prices are adverse (see Why the Shale Revolution Could Only Happen in America). On their recent earnings call, Haliburton CEO Dave Lesar said, “…North America has assumed the role of swing producer in global oil production.”

Either of these views on oil could be right. In each case, it will be good for U.S. producers and their infrastructure providers.

Related to this, there’s a growing disconnect between falling capital expenditure (capex) by companies drilling for hydrocarbons and their rising production. Antero Resources (AR) has cut capex by 20% since last year while production is up 14%. EQT Corporation cut capex 41% and raised production by 31%. Consol Energy (CNX), -74% and +16%. Exploration and production companies (E&P) are managing substantial improvements in efficiency, which speaks to Rex Tillerson’s comments above.

.avia-image-container.av-4c6jvw-a909c1aeb6b59e0cd6a102e9e417aaa4 img.avia_image{ box-shadow:none; } .avia-image-container.av-4c6jvw-a909c1aeb6b59e0cd6a102e9e417aaa4 .av-image-caption-overlay-center{ color:#ffffff; }

The chart above shows what’s happened in the Permian Basin in Texas, currently one of the most productive regions in the U.S. Using data from the U.S. Energy Information Administration (EIA), the rig count fell 75% from September 2014 to May 2016 while production increased 19% over the same period, representing a dramatic improvement in efficiency and lower break-evens for E&P companies. This is pointedly not what the Saudis expected when they increased output in 2014 so as to expose the weak business models of shale drillers.

.avia-image-container.av-27fcks-324ace9559ab3d33f843d0bb5c4cb29f img.avia_image{ box-shadow:none; } .avia-image-container.av-27fcks-324ace9559ab3d33f843d0bb5c4cb29f .av-image-caption-overlay-center{ color:#ffffff; }

Finally, a few weeks ago (see There’s More to Pipelines Than Oil) we noted a documentary made in the 1950s about the Transcontinental Gas Pipe Line, later called Transco and today owned by Williams Companies (WMB). It’s worth watching. In 1931 the Natural Gas Pipeline Company of America built a transmission pipeline from Texas and Louisiana to Chicago. It is still in use today, owned by Kinder Morgan (KMI). Properly maintained, infrastructure lasts a long time – far longer than the depreciation schedules used under GAAP accounting, which is why net income is generally less useful than cashflow less the cost of maintenance (Distributable Cashflow, or DCF) in measuring performance. GAAP Depreciation, a non-cash expense, depresses net income and understates the cash flow generating capability of an asset that doesn’t depreciate according to a GAAP schedule. Pipelines more typically increase in value over time, because they’re hard to replicate. On KMI’s earnings call on Wednesday, chairman Rich Kinder noted the challenges in building certain new projects such as in New England because of the regulatory environment, but added, “…to the extent it becomes difficult to build new infrastructure, that tends to make existing pipeline networks more valuable.”

U.S. energy infrastructure remains one of the most interesting places to invest.

We are invested in KMI and WMB.