Magellan Midstream: Keeping Promises But Still Dragged Down by Peers

Many MLP management teams have pursued growth at the expense of honoring their promise of stable distributions. We think the sector’s persistently high yields need explaining. Last week’s blog post (Kinder Morgan: Still Paying for Broken Promises) drew thousands of pageviews and over a hundred comments on Seeking Alpha.

Although Kinder Morgan (KMI) got there through a series of steps, ultimately they redirected cashflows from distributions to new projects. From an NPV standpoint, financial theory holds that investors should be indifferent to how a company deploys its cash as they can always manufacture their own dividends by selling some shares.

Markets don’t work that way. Capital investments are not an expense, they’re a use of cash. But the dividend cuts required to fund them were treated as a drop in operating profit by investors. KMI should have understood this, because for many years prior to 2014 they sought investors who valued stable dividends. KMI then decided they no longer wished to appeal to those investors, and their valuation still reflects the betrayal. The bitterness of many investors is on full display via the comments on last Sunday’s blog.

KMI’s problem of an undervalued stock is self-inflicted – but what about other MLPs who have been faithful to their income-seeking investor base? Magellan Midstream (MMP) does all the right things:

  • Grows Distributable Cash Flow (DCF) annually
  • Raises its dividend (distribution), annually
  • Finances its growth projects with internally generated cash, thereby avoiding dilutive secondary offerings of equity
  • Maintains a strong balance sheet with Debt:EBITDA consistently below 4X

.avia-image-container.av-1jyt8lb-272876ee61c2ef80f8abd589ad0013d1 img.avia_image{ box-shadow:none; } .avia-image-container.av-1jyt8lb-272876ee61c2ef80f8abd589ad0013d1 .av-image-caption-overlay-center{ color:#ffffff; }

Magellan Midstream Partners Financials

Such judicious capital management has probably caused MMP to pass on growth opportunities that others have chosen. Energy infrastructure analysts widely hold that the sector remain undervalued. Dozens of MLP distribution cuts are at least part of the reason – so a company that has remained steadfast should stand out.

But while MMP’s unwavering embrace of its principles has helped, it hasn’t been enough to truly separate them from their less reliable peers.

.avia-image-container.av-ufdj33-b565219255cdce45cf129cb130d19213 img.avia_image{ box-shadow:none; } .avia-image-container.av-ufdj33-b565219255cdce45cf129cb130d19213 .av-image-caption-overlay-center{ color:#ffffff; }

MLPs peaked in 2014. Since then, MMP has raised per unit EBITDA by 31%, per unit DCF by 25% and distributions are up 54%. Distribution coverage remains healthy at 1.25X.

MMP’s leverage has risen, from 2.8X to 3.5X, but will drop back next year as new projects come into production. Even at 3.5X it is comfortably below the 4X that most of their peers target.

Magellan’s management team hasn’t issued equity or made dilutive acquisitions.  They’ve done just what they promised by increasing cash flows & distributions while maintaining a strong balance sheet.  And yet, MMP’s stock price is 26% below where it ended 2014.

.avia-image-container.av-17fa3en-b931cd48f9221e8d86bdfae1499b7177 img.avia_image{ box-shadow:none; } .avia-image-container.av-17fa3en-b931cd48f9221e8d86bdfae1499b7177 .av-image-caption-overlay-center{ color:#ffffff; }

Magellan Midstream Partners Stock Price

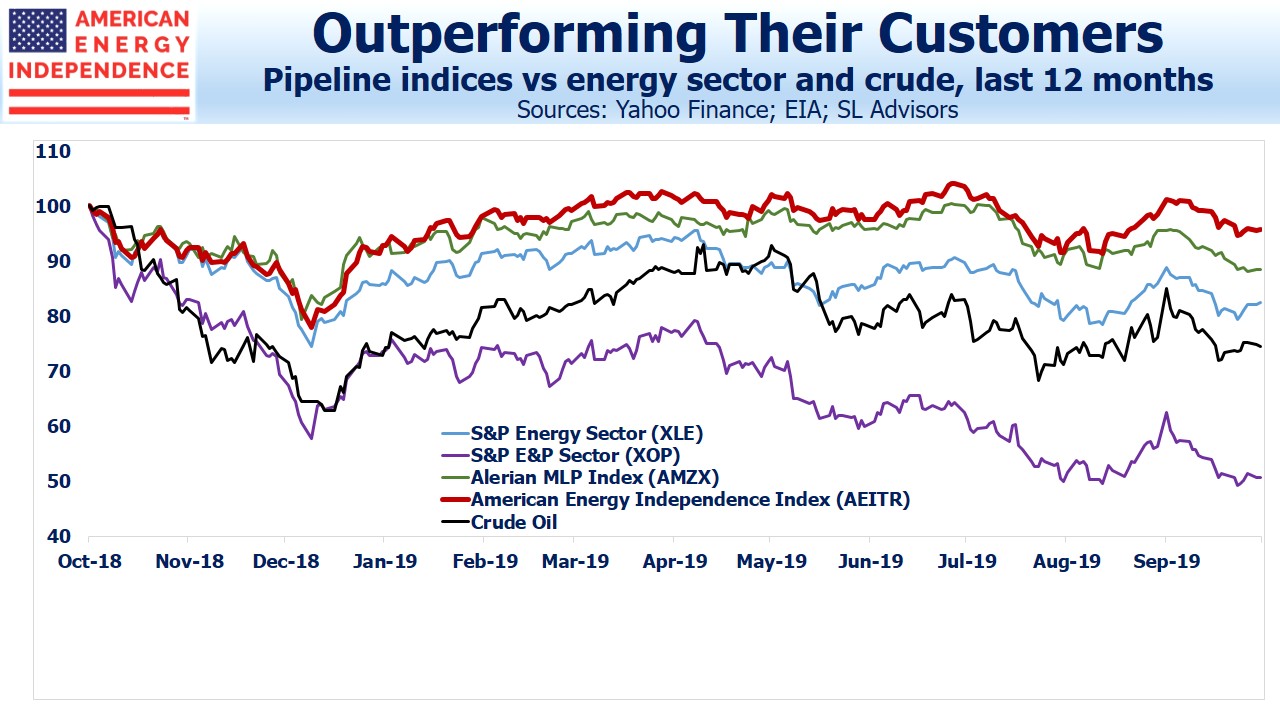
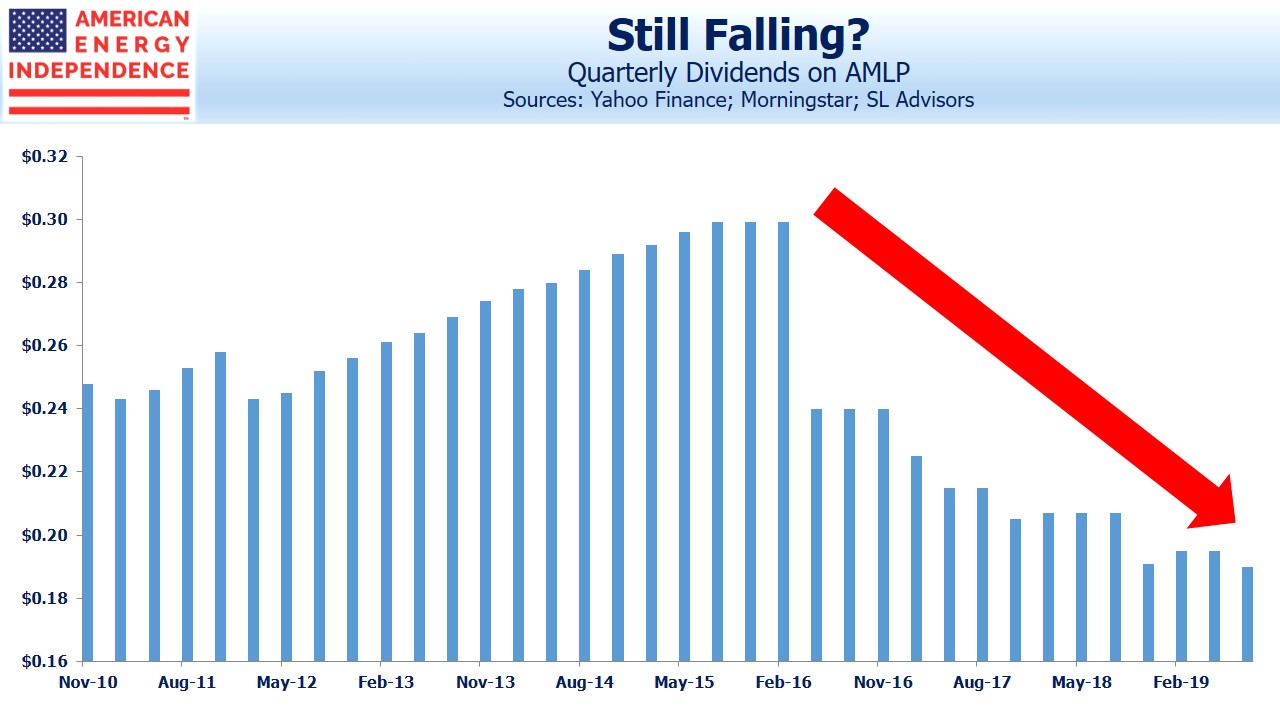
MMP’s yield is more than 2% below the AMZ, reflecting a valuation premium relative to the MLP index. But the entire sector is laboring under the history of dozens of distribution cuts, which have lowered the payout on the Alerian MLP ETF by 30%. MMP’s valuation has moved in the opposite direction from its steadily improving operating performance in recent years, reflecting that traditional MLP investors remain far less enthusiastic than in the past.

The most common question asked of investors is, given persistent undervaluation, what is the catalyst that will drive prices higher? We showed last week that an MLP’s DCF yield is analogous to the Funds From Operations measure used in real estate, since it represents cashflow generated after the cost of maintaining the assets but before investment in new projects.  On that basis, MMP’s 9.1% DCF yield (based on $5.54 per unit for 2019) is pretty attractive for a long term holder.

However, many investors prefer immediately rising prices following a purchase to confirm their buy decision. Continued strong earnings should support increases in payouts. 3Q18 results for pipeline companies have been strong. Current forecasts are for 5-6% annual distribution growth for MLPs – slower than their growth in DCF as they build coverage for their distributions. Since many MLP managements continue to believe their stock undervalued, they prefer internally generated cash to issuing expensive equity. We agree.  We expect dividend growth for the broad American Energy Independence Index (80% corporations and 20% MLPs) of 10% next year.

Rising dividends should improve sentiment.

We are long MMP and KMI.


Kinder Morgan: Still Paying for Broken Promises

Broken promises aren’t quickly forgotten. That’s the hard lesson being learned by pipeline company managements, as the sector remains cheap yet out of favor.

Kinder Morgan (KMI) reported good earnings on October 17th. Volumes were up, and they sold their Trans Mountain Pipeline (TMX), including its expansion project, to the Canadian Federal government. TMX is Canada’s only domestic pipeline that can supply seaborne tankers. All other pipelines lead to the U.S.

Canada’s landlocked energy resources are becoming a political football. Alberta wants to get its oil and gas to export markets, but neighboring British Columbia opposes the new pipelines necessary for Albertan crude to reach the Pacific coast. Caught between the two provinces, KMI sensibly sought an exit. The transaction was well timed, closing before cost estimates for completing the expansion  were ratcheted up and a court ruled that a new environmental study was required (see Canada’s Failing Energy Strategy). Canada’s taxpayers were on the wrong end of the deal.

Nonetheless, Rich Kinder opened the earnings call lamenting KMI’s valuation. He said, “I’m puzzled and frustrated that our stock price does not reflect our progress and future outlook.” We do think KMI is cheap, but the explanation lies in recent history. Before the Shale Revolution created the need for substantial new pipeline investments, KMI’s investor presentation reminded “Promises Made, Promises Kept.”

.avia-image-container.av-70kb3l-cb44f06f3bcc4e69a57d7df763584a5c img.avia_image{ box-shadow:none; } .avia-image-container.av-70kb3l-cb44f06f3bcc4e69a57d7df763584a5c .av-image-caption-overlay-center{ color:#ffffff; }

KMI Promises Made Promises Kept

This turned out to be true only until financing new projects conflicted with paying out almost all available operating cash flow in distributions. Investors in Kinder Morgan Partners (KMP), the original vehicle, were heavily abused. They suffered two distribution cuts and a realization of prior tax deferrals timed to suit KMI, not them (see What Kinder Morgan Tells Us About MLPs). Former KMP investors, who are numerous, retain deeply bitter memories of the events and have lost all trust in Rich Kinder.

.avia-image-container.av-1l3u04x-3710292e69a3b8632808509773179632 img.avia_image{ box-shadow:none; } .avia-image-container.av-1l3u04x-3710292e69a3b8632808509773179632 .av-image-caption-overlay-center{ color:#ffffff; }

KMI was only the first of many. Distributions on Alerian’s MLP index have been falling for three years. Their eponymous ETF has cut its payout by 30%. Alerian CEO Kenny Feng, normally a reliable cheerleader for the MLP model, recently turned more critical, citing,”…significant abuses of [distribution growth] in the past…” The irony is that until late last year Alerian’s own website showed reliable distribution growth, completely at odds with what investors in their products were experiencing. They only corrected it when mounting criticism from this blog (see MLP Distributions Through the Looking Glass), @MLPGuy and others forced a humbling revision.

.avia-image-container.av-15wdxe9-fbbb7f4567a47fc75db7bef6509afe19 img.avia_image{ box-shadow:none; } .avia-image-container.av-15wdxe9-fbbb7f4567a47fc75db7bef6509afe19 .av-image-caption-overlay-center{ color:#ffffff; }

AMLP Makes Distribution Correction

Too few commentators acknowledge the poor treatment of MLP investors (see MLP Investors: The Great Betrayal). Pipeline stocks are attractively valued but have been that way for some time. The legacy of broken distribution promises continues to cast a pall. KMI’s objective in abandoning the MLP model was to be accessible to a far broader set of investors as a corporation. So far, it hasn’t helped their stock price.

One explanation might lie in how they present their financial results. Distributable Cash Flow (DCF) is a term widely used by MLPs and retained by KMI even after it became a corporation. MLPs calculate their distribution coverage ratio, which is the amount by which DCF exceeds distributions. It’s somewhat analogous to a dividend payout ratio, albeit based on DCF not earnings. Kenny Feng notes that generalist investors aren’t familiar with DCF or its coverage ratio. It may be why KMI’s stock is languishing.

DCF is Free Cash Flow (FCF) before growth capex. MLPs have long separated capex into (1) maintenance, required to maintain their existing infrastructure, and (2) growth, for new projects. FCF, a GAAP term, is indifferent to the two types of capex and deducts them both. DCF (not a GAAP term) treats them differently by excluding growth capex, and is always higher.

.avia-image-container.av-kjeggh-d478b2fcdb4dbfba2f2b88e1f0a5e4f2 img.avia_image{ box-shadow:none; } .avia-image-container.av-kjeggh-d478b2fcdb4dbfba2f2b88e1f0a5e4f2 .av-image-caption-overlay-center{ color:#ffffff; }

Unsurprisingly, KMI regularly promotes its 11% DCF yield, which is higher than its energy infrastructure peer group. However, FCF is the more familiar metric, and is lowered by the subtraction of growth capex. Because KMI spent over 70% of its $4.5BN DCF on new projects, the remaining $1.4BN in FCF results in just a 3.3% FCF yield. This is still higher than the energy sector and certainly better than utilities (which are often negative because of their ongoing capex requirements). But it doesn’t stand out versus other sectors, and probably causes analysts to overlook the high DCF yield.

As a corporation, KMI continues to promote a DCF valuation metric used by MLPs, Using the more common FCF yield, it isn’t compelling. However, DCF seems reasonable to us given their business model.

To see why, consider yourself owning an office building. After all cash expenses, including maintenance and setting aside money annually to replace HVAC and other equipment, it generates $1 million in cash, annually. In real estate this is called Funds From Operations (FFO). Because you’re already deducting the expenses required to keep the building operating, and it’s most likely appreciating in value, it’s reasonable to value it based on the $1million recurring cashflow. A cap rate of 5% means you’d require at least $20 million before agreeing to sell it.

Now suppose you decided to redirect $700K of your $1 million annual cashflow towards buying a second building that you also plan to rent out. You still own a $20 million asset, and reinvesting some of that annual cashflow in a new building doesn’t affect the value of what you already own.

In this example the $1million in FFO is analogous to KMI’s DCF. It’s why they believe their stock is undervalued, because 11% is a high DCF yield. Their FCF is so much lower because they’re investing most of their DCF in new assets that will generate a return.

GAAP FCF doesn’t differentiate between capex to maintain an asset and capex to acquire a new one, which is why pipeline companies don’t dwell much on FCF. Moreover, properly maintained pipeline assets generally appreciate. As climate activists slow new pipeline construction in some states, it simply raises the value of nearby infrastructure that can serve the same need.

Critics may believe that DCF doesn’t reflect all the necessary maintenance capex that’s really required, or that the underlying assets are depreciating in value even while properly maintained, although there’s little if any evidence to support either claim. So KMI remains misunderstood.

The dividend might offer a more compelling story. Yielding 4.7%, it’s below the 5.8% of the broad American Energy Independence Index. Because of history, investors are understandably cautious in buying for the yield. But today’s $0.80 annual payout is expected to jump to $1 next year and $1.25 in 2020. This 25% annual growth will push the yield to 7.4% in two years, assuming no upward adjustment in the stock price. A rising dividend might finally vanquish the unpleasant memories of prior cuts, and draw in new buyers.

In spite of its attractive valuation, MLP ETFs and mutual funds don’t own KMI, because it’s not an MLP, providing another good reason to seek broad energy infrastructure exposure that includes corporations.

We are long KMI and short AMLP.


British Shale Revolution Crushed: America’s Unique Ownership of Oil and Gas

A Cuadrilla is the matador’s supporting cast. Before the bullfighter takes on his next victim, the bull is tormented and weakened by a gang (a “Cuadrilla”) of toreadors and picadors. Of course, the bull always loses, because it’s a spectacle not a sport. Cuadrilla is therefore an oddly antagonistic name for a UK company using horizontal fracturing (“fracking”) to extract natural gas from beneath communities in Lancashire, northwest England. Its opponents, who seem to include a sizeable portion of the local population, are determined to fare better than the bull against their adversary. Cuadrilla has just begun fracking tests. The company was founded in 2007 and has been trying to get started ever since. In 2011 the government halted work because it was linked to local earth tremors.

.avia-image-container.av-vgtoya-6387715641325138c64c9984739b63f7 img.avia_image{ box-shadow:none; } .avia-image-container.av-vgtoya-6387715641325138c64c9984739b63f7 .av-image-caption-overlay-center{ color:#ffffff; }

Cuadrilla UK Fracking

Based on news reports and op-ed columns, it’s Cuadrilla supported by the UK government and Matt Ridley (a well-known British writer and peer) against pretty much everyone else. Britain’s energy increasingly relies on natural gas from Norway and electricity from France. Supplies of North Sea oil peaked long ago, and the domestic coal industry has mined what’s commercially accessible. Last winter, Britain had to import liquified natural gas from Russia – possibly the least attractive energy supplier on the planet. Among the many possible consequences of a “hard” Brexit (i.e. one that happens without a successful negotiation by March 29th), is that Northern Ireland (part of the UK) will suffer widespread electricity outages. This is because its power comes from the Republic of Ireland (not part of Brexit) to its south, and a breakdown between the EU and UK would disrupt the grid.

By contrast with the U.S., Britain is increasingly energy dependent. The porous shale rock holding oil and gas that America is efficiently exploiting is found in many other parts of the world. A substantial resource is thought to be beneath the towns and farms of Lancashire and Yorkshire across northern England. The British Geological Survey estimates this Browland Shale region contains over 1,329 Trillion Cubic Feet of natural gas, more than 920 years of consumption at current levels. Such estimates of what’s recoverable are usually multiples of what actually comes out of the ground, but even with a 90% haircut, it’s a substantial amount.

Notwithstanding Britain’s commitment to reduce harmful emissions from fossil fuels, it would seem pretty clearly in the national interest to develop domestic sources of energy. Currently, the main proponents are (1) Cuadrilla, who obviously has a commercial interest, and (2) the UK government, seated in London a long way from the noise and disruption of drilling. Local communities including the Lancashire County Council are all opposed to fracking in their neighborhood, but have been over-ruled by national courts and, finally, the national government.

Fracking has its opponents in the U.S. too, and some states (such as New York) ban it. However, Texas, Louisiana, Pennsylvania and North Dakota among others have enjoyed the economic boom that the Shale Revolution has ushered in. A critical and unappreciated difference between the U.S. and Britain in this regard concerns mineral rights. American landowners typically also own anything found beneath their land, including oil and gas. They can lease the exploration rights to a drilling company in exchange for royalties from the sale of the output. This is a uniquely American concept; in Britain, mineral rights belong to the government. The result is that residents of, say, Little Plumpton have no prospect of economic gain but are expected to submit to the substantial disruption of noise, truck traffic and other inconveniences because it’s in the national interest.

Fracking is highly disruptive to American communities too, but even if you’re not the direct recipient of royalties, you know your local economy is benefitting from the jobs and higher spending that come with it. Sharing some of the profits locally creates local support, or at least tolerance, for what comes with it.

Cuadrilla has partially recognized the problem. Their website attempts to highlight the local benefits to the community, which include £10 million pounds in local spending ($13 million), £15,000 in local community donations and 24 full-time employees. You have to verify that it’s legitimately a corporate website and not run by Monty Python, given the humorously low figures which would scarcely resonate even in a third world country.

Households within one kilometer of the site are entitled to £2,000 each, while those beyond but within 1.5 kilometers get £150 each. That’s probably enough to get your family drunk at the pub for a couple of evenings. It’ll distract them from the drilling. Cuadrilla is not yet trying to bribe its adversaries into submission.

The point here is that the American system, while not perfect, is by design, far more effective than those in most other countries. The Shale Revolution has come about not just because of the geology, but also because of America’s vibrant capitalist economy, the labor force, technological excellence and, perhaps most importantly, privately owned mineral rights. If a developed country like Britain has this much trouble accessing its own resource, the era of American energy dominance will be long.


Another MLP Jumps Ship

Last week Antero Midstream (AM) became the latest MLP to simplify their structure. This is further evidence of the declining opportunity set for MLP-dedicated funds, and cause for investors to seek exposure to energy infrastructure that goes beyond MLPs to include corporations (see The Uncertain Future of MLP-Dedicated Funds).

Like many MLPs before them, Antero is becoming a corporation. Broader institutional ownership and enhanced trading liquidity were cited as the reasons.

The benefits of being an MLP persist – our friend and regular commenter Elliot Miller would note that the tax benefits remain significant: MLPs don’t pay Federal corporate income tax, leaving more money available for distributions. And those distributions are largely tax deferred, with the possibility of being tax-free to one’s heirs given thoughtful estate planning.

Nonetheless, Antero concluded that the MLP structure no longer suited them. They joined a long list of companies who’ve reached the same conclusion, including Kinder Morgan (KMI), Targa Resources (TRGP), Semgroup (SEMG), Oneok (OKE), Archrock (AROC), Williams (WMB), Dominion (D) and Enbridge (ENB). Tallgrass (TGE) has retained the partnership structure for governance but chosen to be taxed as a corporation, and Plains All American offers a option for both 1099 (PAGP) and K-1 tolerant (PAA) investors.

They’ve all found that MLP investors are too few and fickle to be a reliable source of equity capital. Tax impediments add cost and complexity to tax-exempt and non-U.S. institutions, a substantial portion of the investor base for U.S. public equities. The K-1s are how investors achieve the tax benefits noted above, but their complexity dissuades most retail investors. Once you eliminate these different classes of investor, almost the only buyers left are taxable, high net worth individuals. In other words, older, wealthy Americans.

These investors like their income, and the several dozen distribution cuts imposed in recent years have done irreparable harm. The high payout ratios of MLPs left little cash for funding growth projects (see It’s the Distributions, Stupid!). This wasn’t a problem until the Shale Revolution created the need for investments in new infrastructure, to support the huge increases in U.S. oil and gas output. Cash was duly diverted from payouts to growth projects, leading to a 30% drop in distributions (see Will MLP Distribution Cuts Pay Off?).

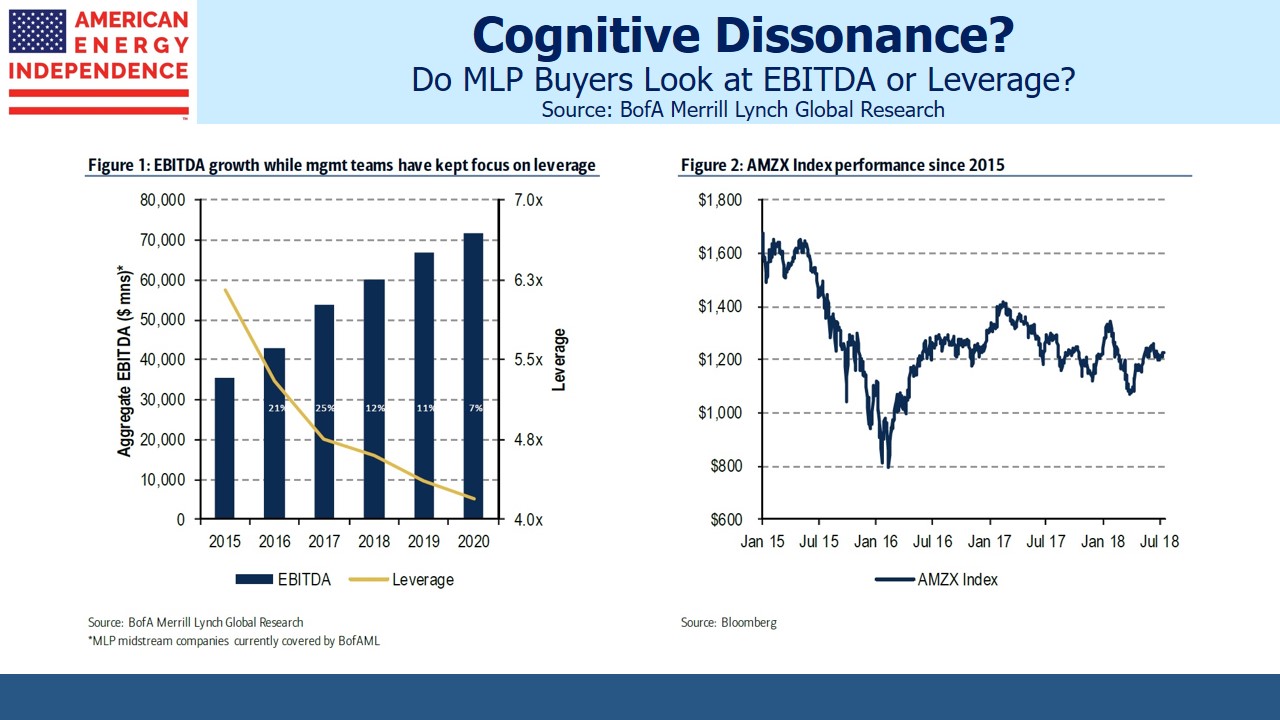
EBITDA improved and leverage came down, but MLP investors only care about distributions, which were cut by 30%. Consequently, the sector fell hard and is still 30% below its 2014 peak.

.avia-image-container.av-tn1ajr-227a1b8488c57994041e22f8ffacce11 img.avia_image{ box-shadow:none; } .avia-image-container.av-tn1ajr-227a1b8488c57994041e22f8ffacce11 .av-image-caption-overlay-center{ color:#ffffff; }

MLP Investors EBITDA v Leverage

MLP-dedicated funds are left with fewer, smaller fish to catch. Their promoters still defend them, in spite of their flawed structure rendering them taxable with correspondingly eye-watering expenses (see MLP Funds Made for Uncle Sam). As pipeline companies continue to abandon the MLP structure, it’s showing up in the sinking market cap of the MLP indices. The market cap of both the Alerian MLP Index (AMZ) and the Alerian MLP Infrastructure Index (AMZI) are decreasing even while the sector is up this year.

It’s stark evidence of the declining role MLPs play in U.S.energy infrastructure. Affected ETFs include those from Alerian (AMLP) and InfraCap (AMZA). Mutual funds from Oppenheimer Steelpath, Centercoast, Mainstay Cushing and Goldman Sachs are similarly stuck with a declining opportunity set.

.avia-image-container.av-1cjwlyf-463599b942cecc50c43e2cf42691f36f img.avia_image{ box-shadow:none; } .avia-image-container.av-1cjwlyf-463599b942cecc50c43e2cf42691f36f .av-image-caption-overlay-center{ color:#ffffff; }

MLPs convert to Corporations

.avia-image-container.av-nvo0jr-ec7fee123908019d5af42af7c03d6c51 img.avia_image{ box-shadow:none; } .avia-image-container.av-nvo0jr-ec7fee123908019d5af42af7c03d6c51 .av-image-caption-overlay-center{ color:#ffffff; }

These MLP-dedicated funds can’t easily change their structure to avoid taxes by becoming RIC-compliant – they’d have to sell 75% of their MLPs, which is prohibitively disruptive. Some smaller funds whose MLP sales weren’t market moving have done so, which shows that others would if they could. Instead, MLP fund proponents are left to argue that their fund structure is optimal, even though no new MLP-dedicated funds are being launched any more.

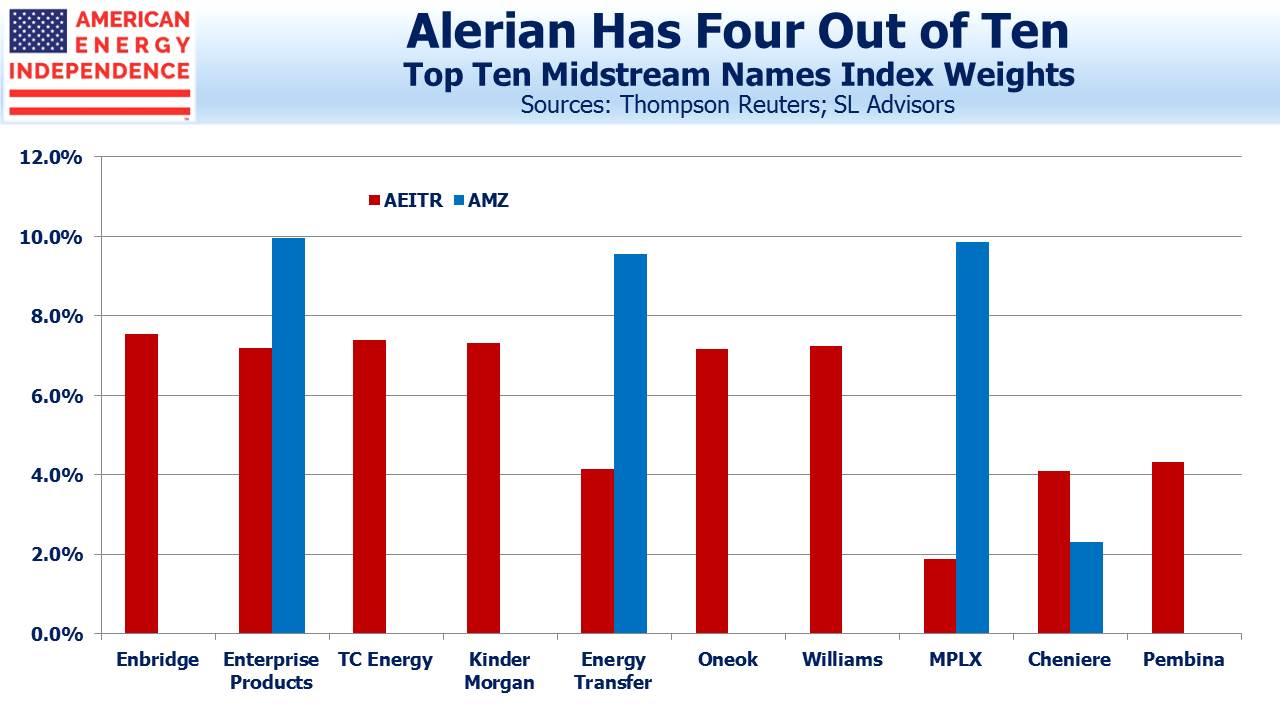
Some big MLPs are happy enough. Enterprise Products (EPD), Magellan Midstream (MMP) and Energy Transfer (ETE) are all sticking with the structure. It works best if you don’t need external financing. We are invested in all three companies through our funds and separately managed account strategies.

MLPs can still be good. An MLP-only approach is not. MLP-dedicated funds are the worst place to be, given the shrinking MLP market cap and tax burden. But broad energy infrastructure, growing as we pursue American Energy Independence, is cheap.

We are long AMGP, AROC, ENB, EPD, ETE, KMI, OKE, MMP, PAGP, SEMG, TGE, TRGP, WMB. We are short AMLP.


Rising Rates Reflect Strong Pipeline Fundamentals

Will rising interest rates hurt pipeline company stocks? Ten year treasury yields are at 3.25%, a seven year high. The bond market is commanding the attention of equity investors once more.

The high yields on MLPs have long attracted income-seeking investors. A common valuation metric is to compare the sector’s yield with the ten year treasury by measuring the yield spread. This is currently around 4.8%, compared with the twenty year average of 3.5%. In comparison, REITs and Utilities both have yield spreads under 1%.

While the MLP yield spread is historically wide, it’s been wider than average for almost five years, which probably means that the relationship has changed. Over the past decade it’s averaged 4.5%. MLP investors require a richer premium to other asset classes than in the past, which is why the bigger MLPs have been converting to corporations, so as to access a wider investor base (see Growth & Income? Try Pipelines).

.avia-image-container.av-1zocvys-972f294c3eaae8785ef23c6b74936f80 img.avia_image{ box-shadow:none; } .avia-image-container.av-1zocvys-972f294c3eaae8785ef23c6b74936f80 .av-image-caption-overlay-center{ color:#ffffff; }

MLP Yield Spread vs 10 Year Treasuries

While MLP yields have remained stubbornly high, they continue to move independently of the bond market. Visually, energy infrastructure and ten year treasuries have no relationship at all. The correlation of monthly returns is -0.35 over the past decade and 0.16 over the past five years – practically speaking, there is no correlation between the two.

.avia-image-container.av-1lfz8r8-5216cbd0de74552b97ed9eb5250f7719 img.avia_image{ box-shadow:none; } .avia-image-container.av-1lfz8r8-5216cbd0de74552b97ed9eb5250f7719 .av-image-caption-overlay-center{ color:#ffffff; }

Pipeline Stocks Uncorrelated to Treasuries

Over short periods of time, fund outflows from income alternatives can depress MLP prices, but the effect is rarely enduring. Tariffs on regulated pipelines often include an inflation escalator, allowing increases pegged to the Producer Price Index (PPI), which creates some inflation protection for pipeline owners if inflation was to spike higher. This is why we often tell investors that the impact of higher rates depends on whether inflation is rising or not. If rising inflation drives up yields, the higher PPI will feed directly into higher revenues where contracts are correctly structured.

However, if rates move up independently of inflation (i.e. higher real rates), then all assets are affected. Any investment is worth the sum of its future cashflows discounted at an appropriate interest rate. Pipeline stocks would likely be affected like many other sectors.

But economic growth is very strong, which mitigates the effect of rates. Unemployment is the lowest in living memory at 3.7%. Everyone who wants a job has one, and demand is up for many things including pipeline capacity. The U.S. recently became the world’s biggest crude oil producer (see America Seizes Oil Throne).

Permian volumes in west Texas are overwhelming available pipeline capacity, which led to a price discount on Midland crude versus the WTI benchmark of as much as $17 in summer. It’s recently narrowed to $7 – still more than the typical contracted pipeline tariff, but less than the $10-20 cost of truck transportation.

Natural gas currently trades at around $3 per Thousand Cubic Feet (MCF). The natural gas basis between Waha in West Texas and the Henry Hub benchmark location is $2, meaning Waha natgas is worth only $1 per MCF. Permian gas output is 10 Billion Cubic Feet per Day (BCF/D), whereas pipeline capacity is only 8 BCF/D. Some of this excess production is flared, meaning it’s worth zero.

Unlike crude oil, natural gas can’t easily be moved by rail or truck because of the pressure required to compress it. Pipelines are the only option, and the price discount persists because the takeaway infrastructure isn’t available.

.avia-image-container.av-11esvp0-680adb9cb52a82b8df6fbb49239ba2a3 img.avia_image{ box-shadow:none; } .avia-image-container.av-11esvp0-680adb9cb52a82b8df6fbb49239ba2a3 .av-image-caption-overlay-center{ color:#ffffff; }

Anticipated Mexican demand is awaiting completed infrastructure south of the border. Futures traders expect the discount to persist for a while longer, which should benefit Kinder Morgan (KMI), Energy Transfer (ETE) and Oneok Inc (OKE). Beginning in 2020, additional capacity will be made available via KMI’s Gulf Coast Express and Permian Highway pipelines, adding around 4 BCF/Day.

Natural gas production is going to keep growing. Shell recently told investors they expect 2% annual growth through 2035, twice the growth in global energy demand overall. Although natural gas is often touted as being a bridge to a world of renewables, another energy executive said, “Gas not a transition fuel, but a destination fuel.”

.avia-image-container.av-q8bur8-8e8dccabeb6a4f2af7111e512acdaee7 img.avia_image{ box-shadow:none; } .avia-image-container.av-q8bur8-8e8dccabeb6a4f2af7111e512acdaee7 .av-image-caption-overlay-center{ color:#ffffff; }

Waha Natural Gas Basis Futures

The point is that these price differentials, which reflect unmet demand for additional pipeline capacity, are unlikely to be harmed by a modest rise in interest rates. The bond market is under pressure because the economy is booming.

Moreover, today’s battle-hardened MLP investors have endured several dozen MLP distribution cuts. The secular growth in U.S. hydrocarbon production is what attracts them (see Can Anyone Catch America in Plastics?). The companies themselves have also changed, with many of the biggest abandoning the MLP structure to become corporations (see The Uncertain Future of MLP-Dedicated Funds). As a result, broad energy infrastructure is less reliant on MLP investors (often older, wealthy Americans). The adoption of a corporate form, widely followed by the biggest MLPs and most recently by Antero Midstream GP (AMGP) has resulted in a broader, more institutional investor base.

The bottom line is that there’s little reason to fear the current rise in interest rates. Historically, there’s no statistical relationship between bonds and pipeline stocks. Output of oil, gas and natural gas liquids is rising, fueling demand for infrastructure. And the investor base is probably the broadest it’s ever been, as companies move away from the fickle MLP investor towards more conventional holders of U.S. equities. The broad-based American Energy Independence Index, which includes the biggest U.S. and Canadian energy infrastructure stocks, is up almost 2% in October even with treasury yields up 0.20%. So far, the sector has not been impacted by the headlines around rising rates.

We are long AMGP, ETE, KMI and OKE


Can Anyone Catch America in Plastics?

Ethane prices recently hit a four year high. Although this garnered far less attention than the crude oil rally, increasing supplies of ethane is an unappreciated element of the Shale Revolution.

“Dry” natural gas consists of methane, most commonly supplied to residential gas stoves but also increasingly used by power plants to produce electricity. “Wet” gas includes other natural gas liquids (NGLs), such as ethane (more below), propane (used in your outdoor BBQ), butane (cigarette lighters) and other more obscure NGLs such as isobutene. Typically, the NGLs and other impurities are separated out from the wet gas, leaving methane as the natural gas that flows to customers. Because NGLs have marketable value, wet gas is more desirable.

Ethane, once converted to ethylene through “cracking” is the principal input into production of polyethylene. Simply put, ethane is turned into plastic. Polyethylene is manufactured in greater quantities than any other compound.

.avia-image-container.av-1oeq9ic-0fc4075e2087d88bdb748a217d5a200b img.avia_image{ box-shadow:none; } .avia-image-container.av-1oeq9ic-0fc4075e2087d88bdb748a217d5a200b .av-image-caption-overlay-center{ color:#ffffff; }

Plastics are the by-product of ethane

The process is fascinating, and naturally the internet provides ample information. Ethane molecules are broken through heating (“cracked” in industry parlance), and the ethylene produced undergoes further processing into polyethylene pellets. These plastic pellets come with different properties such as strength, flexibility and melting point, which determine their ultimate use. They are heated and molded into many thousands of consumer and specialty products. For an absorbing description that follows ethane molecules from extraction to ultimate use, the Houston Chronicle’s three-part series Texas petrochemical plants turn ethane into building blocks of plastic is highly readable.

Among many fascinating steps, we learn that molten polyethylene pellets are blown into a very thin cylindrical balloon, several hundred feet long. This is then turned into sheets by passing through rollers, and multiple sheets are combined depending on the desired thickness. In the article, these ethane molecules ultimately traveled as plastic pellets to Vietnam where they were processed into packaging for frozen shrimp that was shipped back to the U.S. The petrochemical industry makes this happen.

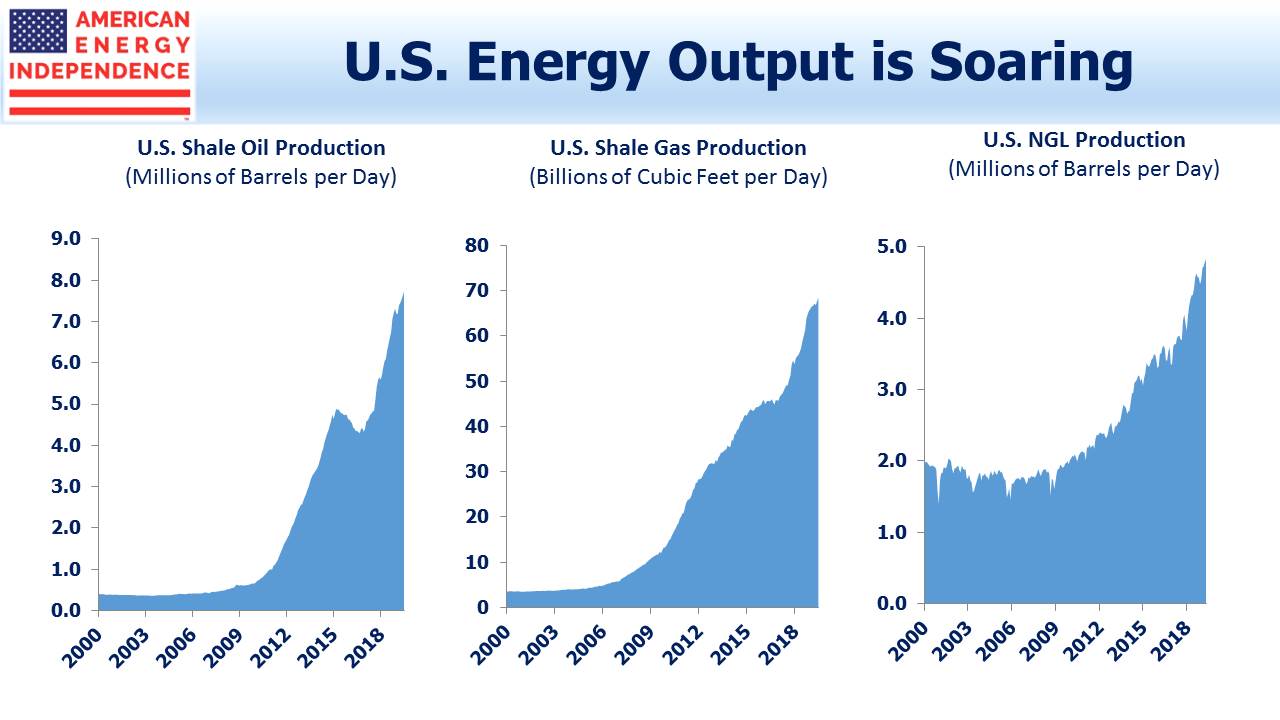
U.S. ethane production has more than doubled in the past decade, to 1.5 Million Barrels per Day (MMB/D). Ethane is a gas and isn’t shipped in barrels. The MMB/D unit of measure converts the energy content of the ethane to that in a barrel of crude oil. Barrels of Oil Equivalent (BOE), allows volumes of most hydrocarbons to be measured using a common metric. What further sets the U.S. apart is that shale’s light crude comes with relatively high concentrations of NGLs, including ethane. It simply needs to be separated out.  The alternative source of ethane is as a by-product from refining crude oil, a more costly approach.

.avia-image-container.av-zdxf8k-7954ef64b9700b8d8973b73d65ac8e11 img.avia_image{ box-shadow:none; } .avia-image-container.av-zdxf8k-7954ef64b9700b8d8973b73d65ac8e11 .av-image-caption-overlay-center{ color:#ffffff; }

Plastics are the by-product of Ethane

The U.S. is producing so much ethane that some of it is being mixed in with the methane natural gas stream as it can’t be profitably used elsewhere (known as “ethane rejection”). Low ethane prices with the promise of ongoing ample supply have led to a flurry of new petrochemical investments.  Cheap natural gas lowers processing costs, since the conversion of ethane to plastic pellets requires heat. For example, Exxon Mobil (XOM) operates one of the world’s largest polyethylene plants in Mont Belvieu, TX, with ethylene provided by a new facility at their nearby Baytown complex.

But the big increase in natural gas output is in Appalachia, where the Marcellus and Utica shale formations are providing most of this new supply. Royal Dutch Shell is building a new ethane cracker in western Pennsylvania, close to its supply. In total, $202BN of investments in 333 projects have been announced since 2010. U.S. ethane exports have been rising, but as these new facilities become operational they will increase domestic demand. Two thirds of the investments involve foreign companies. The recent jump in the ethane price is partly attributable to new domestic buyers.

The result is that ethane trade flows are shifting, and the U.S. is becoming a more important supplier of plastics.

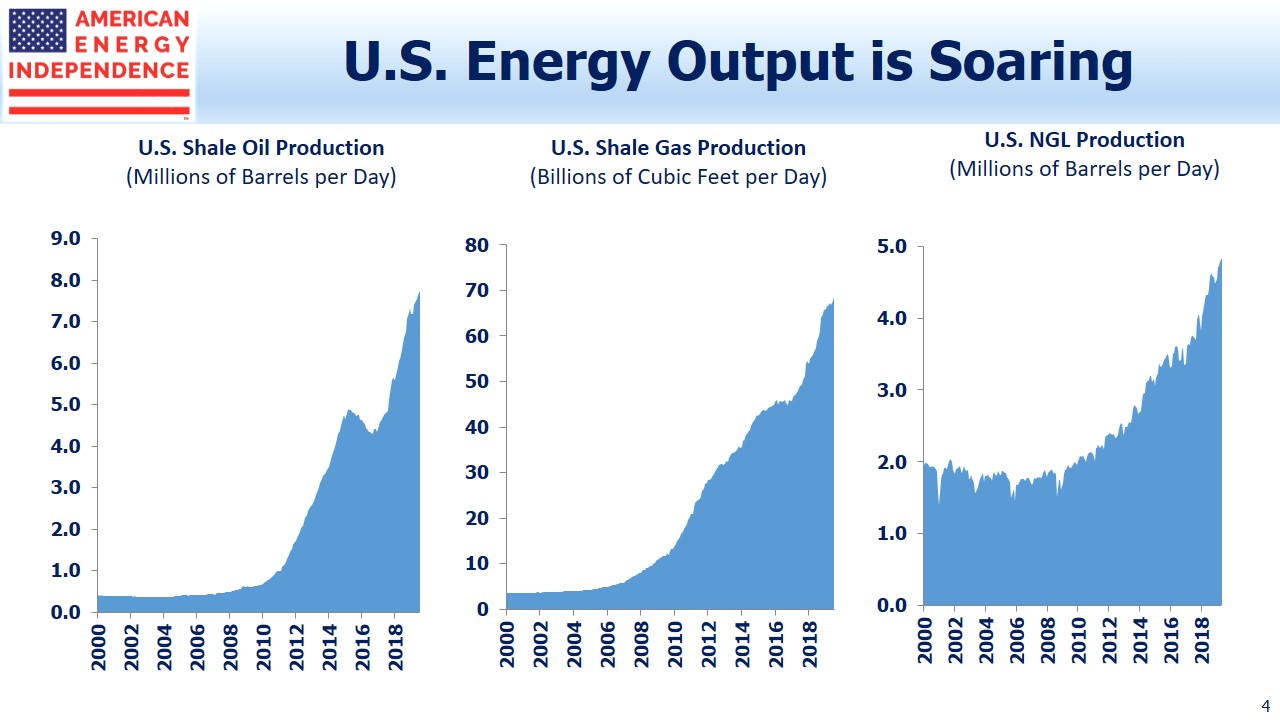
The Shale Revolution draws attention for the growth in fossil fuels — crude oil and natural gas, where the U.S. leads the world.  But we’re even more dominant in NGLs, contributing one-third of global production. The impact of NGLs and consequent growth in America’s petrochemical industry receives far less attention, although it’s another huge success story.

.avia-image-container.av-rtubs4-f66c68e05ecf71bfe1c72f9439446086 img.avia_image{ box-shadow:none; } .avia-image-container.av-rtubs4-f66c68e05ecf71bfe1c72f9439446086 .av-image-caption-overlay-center{ color:#ffffff; }

Plastics are the by-product of Ethane

Enterprise Products Partners (EPD), Energy Transfer Equity (ETE), Oneok Inc. (OKE) and Targa Resources Corp (TRGP) are well positioned to benefit from America’s growing NGL production. Our funds are invested in all of them.


Saudi America: Why the Shale Revolution is Real

Bethany McLean didn’t intend her latest book, Saudi America: The Truth About Fracking and How It’s Changing the World, to be a booster of the Shale Revolution. The New York Times got it all wrong when they titled her promotional op-ed, The Next Financial Crisis Lurks Underground. Before reading her book, I therefore assumed that in forecasting a collapse in the U.S. energy sector, the very recent one in 2014-16 had simply passed her by (see New York Times Forecasts the 2014-16 Energy Sector Collapse). But McLean accurately chronicles how OPEC nations failed to bankrupt the nascent U.S. shale industry with low oil prices, thereby demonstrating its resilience. She notes the importance of privately-owned mineral rights, an almost-uniquely American concept that facilitated onshore oil and gas exploration long before shale. Those who don’t fear a crash are well represented. The IEA’s chief economist, Fatih Birol, says, “There is a silent revolution taking place in the United States, so silent that nobody’s aware of it.”

.avia-image-container.av-ksv8tz-a2b23a4607070a40a7b05cd86b29910c img.avia_image{ box-shadow:none; } .avia-image-container.av-ksv8tz-a2b23a4607070a40a7b05cd86b29910c .av-image-caption-overlay-center{ color:#ffffff; }

Saudi America - Book Review

In fact, McLean’s warnings of collapse are based on such weak arguments and are so half-hearted that she’s grudgingly conceding the secular change in world energy markets that’s occurring. A private equity investor (“titan”) suggests “…the Federal Reserve is entirely responsible for the fracking boom.” Really? Did the Fed buy energy sector bonds? Are low interest rates failing to benefit any other sector? In 2016, non-investment grade bond yields for some energy names reached 25%. Although there were bankruptcies, the industry survived as assets moved from weak hands to strong. She also finds some bearish hedge fund managers who have lost money shorting shale drillers. If these are the best arguments for another crash in the U.S. energy sector, investors have little to fear. In fact, the weakness of McLean’s arguments against Shale offered a more convincing defense of its longevity than many authors who set out to do just that.

As is often the case, the characters are most interesting. Although McLean relies heavily on past writings on Chesapeake founder Aubrey McLendon, it’s still absorbing to reread about his enormous risk appetite. McLendon’s fiery death while driving alone two years ago looked like suicide, given his mounting financial and legal problems, but it was ruled an accident. The industry lost a colorful believer whose single-minded approach was financially unsuccessful. By contrast, the methodical, analytical approach of companies like EOG demonstrates that the resurgence of hydrocarbon production in the U.S. is not driven by leveraged operators that are permanently bullish.

Shale firms have long been criticized for outspending their cashflow. The industry’s continued access to capital demonstrates that many expect this to reverse. The world’s biggest oil companies, like Exxon Mobil, are now investing in shale, bringing financial discipline and less reliance on capital markets financing, exactly what McLean believes is needed.

You have to work pretty hard to find a downside to American Energy Independence. It’s a bit like complaining about an outsized capital gains tax bill. Shale is pretty obviously an enormous U.S. benefit; less clearly good for others. Nonetheless, McLean tries to get us worried: if we buy less oil from unstable parts of the world, we’re less likely to care about their security. That’s not obviously bad for our young men and women in the military.

McLean fears that the Trump Administration’s desire to drill for oil in the Arctic National Wildlife Refuge (ANWR), “…will crater prices, thereby making the economics of drilling even less attractive than they already are.” Little thought went into that sentence – there are reasons to leave ANWR alone, but crashing the oil market is not one of them. This is where the real McLean emerges – as an environmentalist opposed to fossil fuels, trying to marshal non-environmental arguments against.

Having made a convincing if unintended case that financial challenges will not derail America’s energy renaissance, McLean then warns that renewables will soon bring its demise. But even here, she makes a strong argument for natural gas as a complement to intermittent solar and wind. She quotes Michael Cembalest, JPMorgan’s thoughtful chief strategist, who wrote that, “An electricity grid with less coal, less nuclear, and more renewable energy would be highly dependent on abundant, low-cost natural gas.” We completely agree.

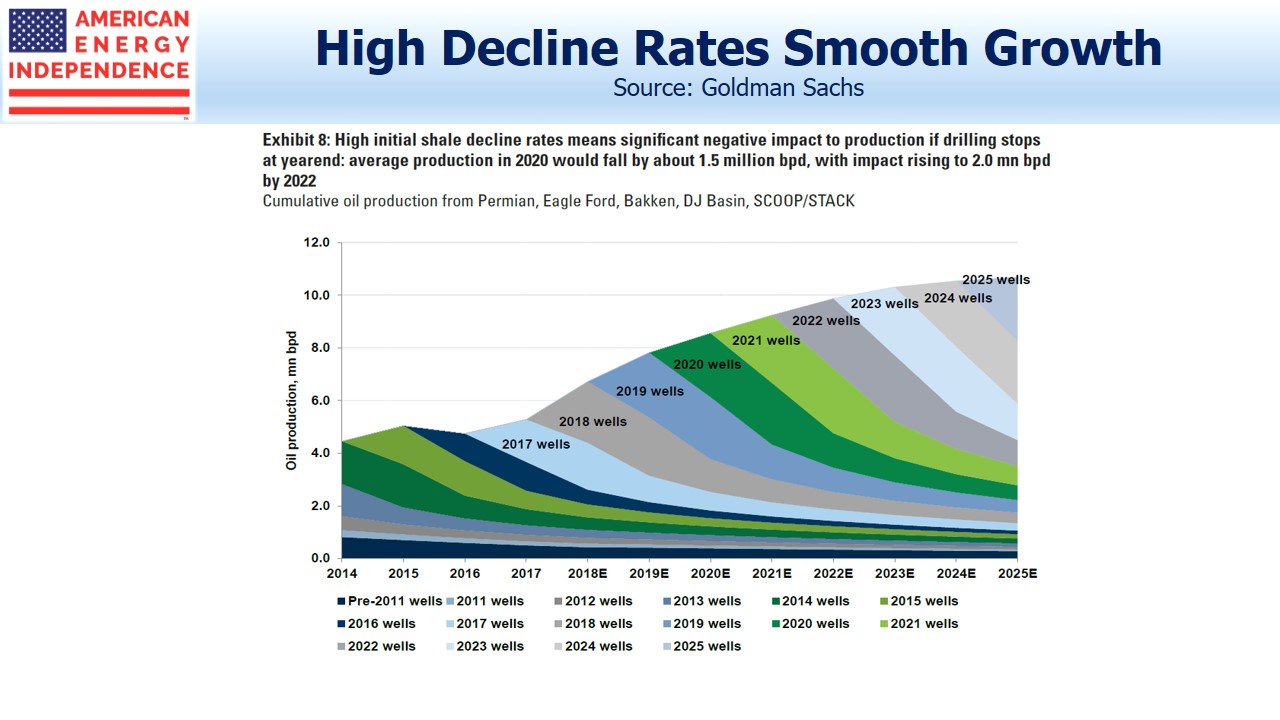
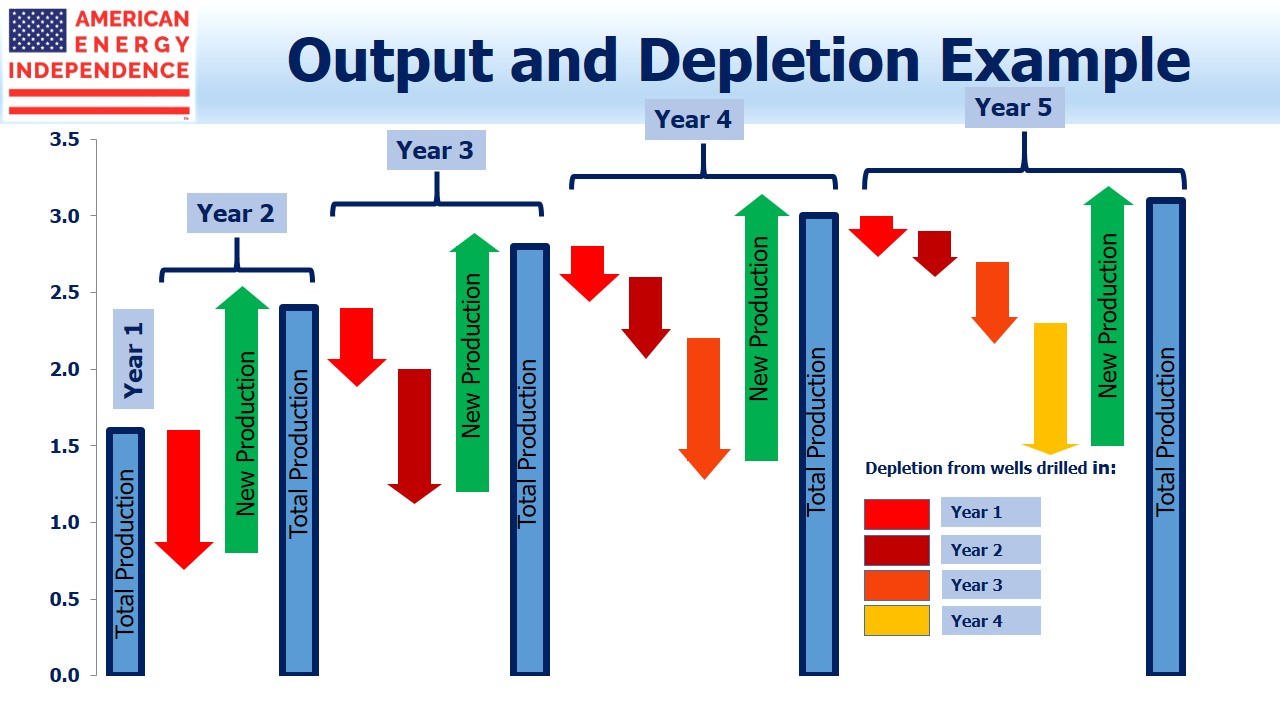
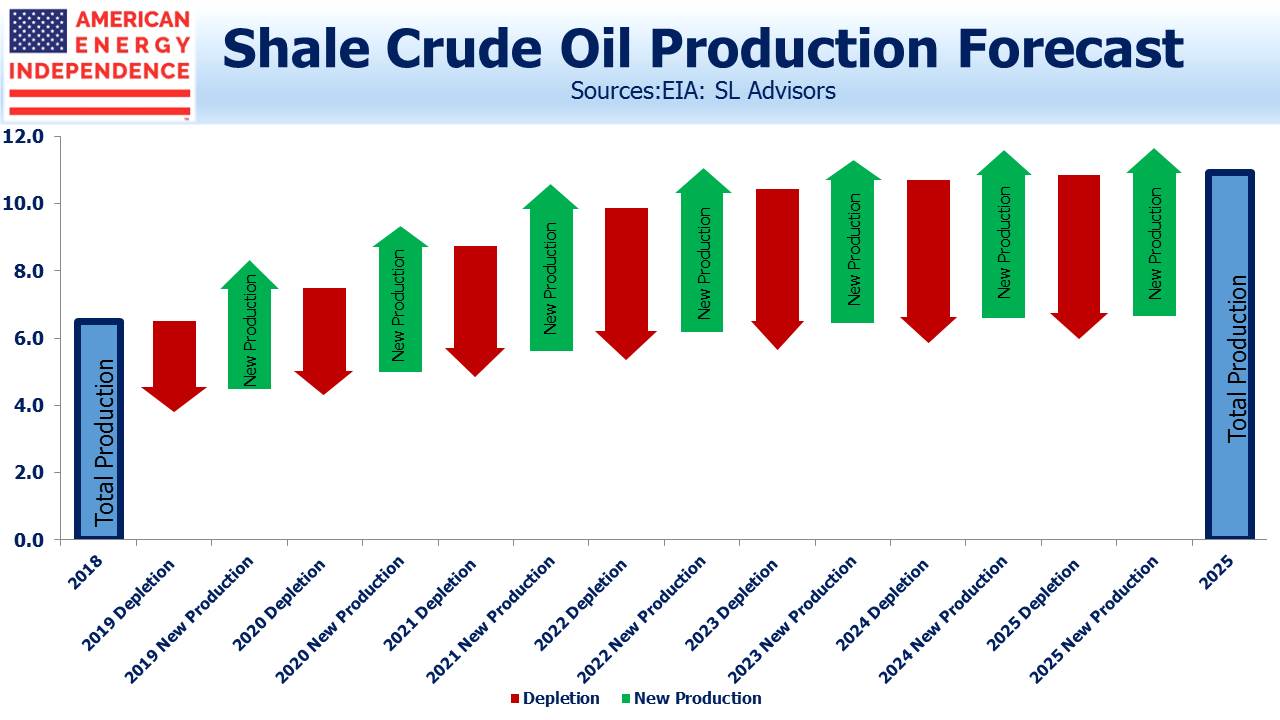
The short-cycle nature of shale production is its enormous strength, something McLean overlooks. Predicting long term demand for crude oil is never easy, but the development of electric cars makes it exceptionally risky to invest in projects with a 20 year payback, which is what conventional oil projects look like. Shale production relies on drilling hundreds of wells that cost under $10MM each. Output declines sharply from a high rate, but capital invested is repaid quickly, often within two years. Output can be hedged in the futures market. If prices drop, drillers stop completing new wells. This quick payback offers a substantially better risk profile, something the industry recognizes. It’s why capital continues to flow in that direction (see Why Electric Cars Help the Shale Revolution).

Saudi America is a quick read – at only 138 pages, I finished it in around four hours. You won’t gain many insights, but as a chronicle of why the Shale Revolution will continue to transform energy markets, it’s worth a quiet afternoon.


Pipeline Stocks Chart a Higher Path

Technical analysis shows that the outlook for pipeline stocks is bullish.

We rarely write on technicals, since we’re relentlessly focused on the fundamentals. But fundamental news has been light, with prices drifting irregularly lower. Investors are overwhelmingly frustrated with the failure of pipeline company stocks to reflect growing throughput volumes. The U.S. just claimed World’s Biggest Oil Producer (see America Seizes Oil Throne). Liquified Natural Gas exports are set to more than double next year (see U.S. Oil and Gas Exports: A New Weapon). In willful defiance, pipeline stocks sagged. One sell-side analyst described recent investor meetings as, “at times blurred between market discussions and therapy sessions.”

For a chartist relying on technical analysis, we think the sector is setting up for a sustained rally. We don’t make investment decisions based on charts. As a visual price history they are helpful, but our portfolio adjustments are driven by shifts in long term fundamentals. However, many investors use technical analysis as a timing aid. Some pore over charts carefully before making decisions. Absent much market-moving news, such analysis is more relevant.

Energy infrastructure charts show three bullish patterns. The first is that the sequence of lower lows from late last year into Spring was not confirmed by the Relative Strength Index (RSI) readings. This type of divergence typically indicates weaker conviction among sellers on each successive dip, warning of a change in trend. Sure enough, the recent August high exceeded the prior one in February, revealing that a new uptrend has begun.

.avia-image-container.av-1z8zwhb-e8bf9da160ba2d68482d151aa1085eae img.avia_image{ box-shadow:none; } .avia-image-container.av-1z8zwhb-e8bf9da160ba2d68482d151aa1085eae .av-image-caption-overlay-center{ color:#ffffff; }

Pipeline Stocks Chart Higher

Supporting this, in June the 50 day moving average convincingly crossed the 200 day moving average, following which the sector moved smartly higher.

.avia-image-container.av-1ksn1rj-4575e5846931d5447f294547103edfc5 img.avia_image{ box-shadow:none; } .avia-image-container.av-1ksn1rj-4575e5846931d5447f294547103edfc5 .av-image-caption-overlay-center{ color:#ffffff; }

Further confirmation is provided by the clear upturn in the 200 day moving average.

.avia-image-container.av-11y3bm7-c73aeca88e6da15528397b6e913d5fe3 img.avia_image{ box-shadow:none; } .avia-image-container.av-11y3bm7-c73aeca88e6da15528397b6e913d5fe3 .av-image-caption-overlay-center{ color:#ffffff; }

This all points to a sector in which medium term (i.e. 3-12 months) momentum is turning up, with the recent softness not that material over a longer perspective. Crude oil technical analysis shows a bull market many months old, adding to the frustration of  investors in pipeline stocks who feel the two are only correlated on the downside.

.avia-image-container.av-nyabin-e13a753134b132e4b4aeab7995811a26 img.avia_image{ box-shadow:none; } .avia-image-container.av-nyabin-e13a753134b132e4b4aeab7995811a26 .av-image-caption-overlay-center{ color:#ffffff; }

Nonetheless, the sector has been weak. It might be in part because the Alerian MLP ETF (AMLP) has experienced steady outflows since June. Its shares outstanding have dropped by 8% in spite of the fact that 2Q18 earnings were generally good. Some of this is probably due to growing awareness of its flawed tax structure (see Uncle Sam Helps You Short AMLP) and shrinking pool of MLPs (see The Uncertain Future of MLP-Dedicated Funds). One reader on Seeking Alpha described it as “obsolete and tax inefficient”.

Oil and gas volumes continue to grow, which augurs well for the next earnings reports in October. Examples of infrastructure shortages abound. Natural gas at the Waha hub in west Texas trades at $0.82 per thousand cubic feet, a steep discount to the $3 Henry Hub benchmark because gas production exceeds pipeline capacity. Gas is being flared in the Permian basin.

Crude oil in Midland, TX trades at a $12 per barrel discount to Cushing, OK (the delivery point for CME futures). This similarly reflects a shortage of pipeline capacity, since tariffs on long term contracts are around $3-$5. The 2015 collapse was due to fears of pipeline overcapacity, so today’s bottlenecks ought to be positive.

Proposition 112 is the Colorado referendum question that would greatly impede future oil and gas development.  Fear of it passing in November has weighed on affected stocks, such as Noble Midstream (NBLX) and Western Gas (WES). But there’s no indication that other states are considering similar moves, so its impact is limited to those with significant Colorado exposure.

We expect solid 3Q18 earnings, which will support 10% dividend growth across the sector.  This might well provide the fundamental impetus needed for pipeline stocks to rally. When that happens, technical analysts can point to chart patterns that predicted it.

We are invested in Western Gas Equity Partners (General Partner of WES), and are short AMLP.


U.S. Oil and Gas Exports: A New Weapon

Start with Iran. In May, Trump withdrew from the Nuclear Accord over strong opposition from foreign allies and domestic policy experts. America announced it would unilaterally impose sanctions on Iran from November 1. Critics said this would be ineffective. Since then, Iranian oil exports are down 25% and likely to fall further. Any company trading with Iran risks losing access to the U.S. banking system, a penalty sufficiently onerous that buyers of Iranian oil are wasting no time sourcing alternatives. Companies from South Korea, France, Japan, Greece, Spain and Italy have all reduced or halted purchases in recent months. U.S. oil and gas exports are a new weapon.

Coincidentally, this has also created an opportunity for exports of ultra-light condensate oil from Texas to meet Asian demand, with buyers increasingly shunning Iranian condensate. U.S. oil and gas exports are playing a bigger role.

The loss of Iranian crude oil on world markets has pushed prices higher. But the Shale Revolution has moderated the U.S. economy’s sensitivity to energy prices. The negative of consumers spending more on gasoline will be mostly offset by a resurgent domestic energy sector. The New York Times published a rare Trump-positive story, noting that the Iran strategy was working.

.avia-image-container.av-s2tyvr-01b65b72863ef073041d384fd283fc24 img.avia_image{ box-shadow:none; } .avia-image-container.av-s2tyvr-01b65b72863ef073041d384fd283fc24 .av-image-caption-overlay-center{ color:#ffffff; }

U.S. Oil and Gas Exports - Crude OIl

Germany’s heavy reliance on renewables to provide electricity has been hampered by its use of coal. Since it’s not always sunny and windy, solar and wind can’t provide a complete solution. In Germany, dirty coal-burning power plants provide the reliable baseload supply every electricity grid needs. Their emissions have negated much of the benefit of renewables, so Germany wants to burn more natural gas, which is cleaner. Its lower CO2 output makes it a natural complement to renewables (see Pipeline Investors Fight Climate Change).

Consequently, Germany is planning Nord Stream 2, a controversial pipeline that will bring natural gas from Russia to Germany. Trump is correct to ask, “What good is NATO if Germany is paying Russia billions of dollars for gas and energy?” But America can do more than just criticize; Liquified Natural Gas (LNG) from the U.S. provides an alternative not susceptible to mid-winter maintenance. Russia has used this tactic before, when negotiations with Ukraine weren’t going in the desired direction. Shivering Ukrainians found they had little leverage with Gazprom, Russia natural gas company, who is not an attractive supplier. Last week Trump promoted U.S LNG to Poland, another NATO ally.

In North America, the U.S. is providing more natural gas to Mexico, which needs it to meet growing demand for electricity. There is 11 Billion Cubic feet per Day (BCF/D) of pipeline capacity, of which Mexico is only using 4.5BCF/D. Meanwhile, the Permian in west Texas is producing more natural gas than the existing takeaway infrastructure can handle. This is limiting oil production (since gas and oil often both come out of the same well) and resulting in flaring of unused gas which nobody likes. As additional pipelines connect natural gas burning power plants south of the border, they will consume more Permian output.

.avia-image-container.av-mclexj-f248179603d978ea6fc99bc9f3310f2d img.avia_image{ box-shadow:none; } .avia-image-container.av-mclexj-f248179603d978ea6fc99bc9f3310f2d .av-image-caption-overlay-center{ color:#ffffff; }

U.S. Oil and Gas Exports - Mexico

Canada struggles with access for its oil exports, in part due to domestic politics (see Canada’s Failing Energy Strategy). This is why Transcanada’s (TRP) planned Keystone XL Pipeline is so important to them, since it will add up to 830,000 barrels a day of transport capacity for a country chronically short of it.

Trump overturned Obama Administration impediments to Keystone XL shortly after taking office. Although they’ve since had to contend with legal challenges at the state level, TRP expects to begin preliminary work on the pipeline in Montana later this year.

Marcellus natural gas is displacing Canadian imports in the eastern U.S., which is helping our trade balance at a moment when the Administration is focused on imbalances. Construction of Keystone XL is a big help to our northern ally. Energy is a vital component of our bilateral Canadian relationship.

.avia-image-container.av-qh77iv-c4dfd5c9d2c11b9e3663eefc3f18f9ed img.avia_image{ box-shadow:none; } .avia-image-container.av-qh77iv-c4dfd5c9d2c11b9e3663eefc3f18f9ed .av-image-caption-overlay-center{ color:#ffffff; }

U.S. Oil and Gas Exports - LNG

Three quarters of global LNG trade occurs in Asia. Following Japan’s 2011 Fukushima earthquake and tsunami, they virtually shut down their nuclear power industry, which has made them big buyers of LNG. China and India are both looking for cleaner alternatives than coal to meet growing electricity demand. Although China recently imposed a 10% tariff on U.S. LNG imports, they previously exempted U.S. crude oil. China’s reduced purchases of U.S. LNG are being offset by other Asian buyers.

In June, U.S. crude oil exports reached 2.2 Million Barrels per Day (MMB/D). China bought almost a quarter, but other destinations included India and South Korea. We even exported 0.2 MMB/D to Canada, although they remain our biggest provider of crude with 4.5 MMB/D of different grades coming back the other way.

Exports of crude oil, natural gas liquids and LNG are all set to rise sharply in the years ahead, as new infrastructure is completed.

U.S. oil and gas exports are providing additional negotiating leverage over allies and adversaries. The Shale Revolution and energy infrastructure investments are providing vital support.


America Seizes Oil Throne

.avia-image-container.av-jbvntp-196b46f32cd5b11fab81c82ca0903508 img.avia_image{ box-shadow:none; } .avia-image-container.av-jbvntp-196b46f32cd5b11fab81c82ca0903508 .av-image-caption-overlay-center{ color:#ffffff; }

Last week the U.S. became the world’s biggest crude oil producer. Not everyone agrees – Russian production figures still show them ahead. But the Energy Information Administration (EIA) is confident that we are, and that we’re going to stay there at least through next year.

This represents a milestone in the path towards American Energy Independence. Only 10 years ago, U.S. output was 5 Million Barrels per Day (MMB/D) and was in decline. Today it’s reached 11MMB/D and is growing rapidly.  Horizontal drilling and hydraulic fracturing unlocked the huge reserves in shale formations, and the decline was arrested. Over the next several years U.S. output grew sufficiently to more than meet global demand growth.

.avia-image-container.av-lk4w65-1d3bd50c5fd649712f7fac4beba03c8a img.avia_image{ box-shadow:none; } .avia-image-container.av-lk4w65-1d3bd50c5fd649712f7fac4beba03c8a .av-image-caption-overlay-center{ color:#ffffff; }

In 2014 Plains All American (PAGP) produced a powerful chart showing how North American crude was gaining market share. OPEC finally tired of their commensurate lost share which they believed was hurting their revenues. The subsequent 2014-16 energy sector collapse was OPEC’s attempt to bankrupt America’s nascent shale industry, to blunt the growth of this new oil producer. Although the financial pain was widespread, the industry didn’t break. American capitalism responded – costs were slashed, productivity enhanced and a leaner, stronger shale industry emerged.

.avia-image-container.av-18o1vr1-162ec25ba4cd387aea4b5b47584066f7 img.avia_image{ box-shadow:none; } .avia-image-container.av-18o1vr1-162ec25ba4cd387aea4b5b47584066f7 .av-image-caption-overlay-center{ color:#ffffff; }

OPEC relented (see OPEC Blinks), concluding low prices were damaging their members more than the shale upstarts. U.S. production began rising again. It passed its 2014 high last year, and last week took the world’s top oil producer spot, well ahead of many forecasts.

It’s an epic story, with significant consequences across geopolitics, trade and the environment. America’s improved energy security is underwriting a more robust approach to Iran. In the 1970s, support for Israel in its wars against Arab states led to gas lines as OPEC’s flexed its muscle and imposed an oil embargo.

American exports of Liquified Natural Gas (LNG) are creating new trade opportunities with Asia, where South Korea, China and Japan are among our biggest buyers. In spite of the escalating tariffs with China, they recently exempted U.S. crude oil imports from a list of items subject to new tariffs. Germany’s plan to buy more natural gas from Russia via Nord Stream 2 is more easily criticized when U.S. LNG is available. Trump’s tweet, “What good is NATO if Germany is paying Russia billions of dollars for gas and energy?” is hard to fault.

American Shale gas has contributed to the world’s biggest reduction in CO2 emissions (see Guess Who’s Most Effective at Combating Global Warming). It’s made possible the shift from coal to natural gas in electricity generation. The Shale Revolution has been positive in so many ways.

Although few stop to think about it, the Shale Revolution reflects the success of American capitalism. Oil and gas originate in porous rock all over the world, but it’s taken a unique combination of advantages for the U.S. to emerge as virtually the only shale player on the planet. In America Is Great! we list the many attributes whose presence was necessary, such as a skilled energy sector labor force, existing infrastructure, access to capital, advanced technology and so on. Apart from the geology, they’re all the results of America’s capitalist system. The least appreciated is privately-owned mineral rights. All over the world, an individual’s property ownership is limited to the surface, with the government owning what’s beneath. By contrast, American landowners have been able to profit from their mineral rights. This has created private sector wealth in a way that a government claiming eminent domain of a lucrative property never could.

All this means that the Shale Revolution was not luck; if it was going to happen anywhere, it was going to be in America.

The energy infrastructure sector has been lethargic over the past few weeks. 2Q18 earnings were strong, but investor positivity was fleeting. Since early August, flows have been light and buyers cautious. The Alerian MLP ETF (AMLP) has seen outflows on most days, although that may be because people are becoming aware of its flawed tax structure (see Uncle Sam Helps You Short AMLP).

.avia-image-container.av-joz74t-883487ba70292a0dc94e55bad4cb1f14 img.avia_image{ box-shadow:none; } .avia-image-container.av-joz74t-883487ba70292a0dc94e55bad4cb1f14 .av-image-caption-overlay-center{ color:#ffffff; }

Record U.S. oil production should serve as a reminder that pipeline companies are the vital enablers of our energy success. Cash flow yields on the American Energy Independence Index are 8.75% and we expect 15-20% annual cash flow growth this year and next.  The dividend yield is 5.6% and growing 10%/year.  Hydrocarbons have to be processed, stored and moved; record volumes should support 3Q18 profits when they start being reported next month.

We are long PAGP.

We are short AMLP.