How Occidental Invests In Lower Taxes

Occidental Petroleum (OXY) has a checkered history. In 2019 CEO Vicki Hollub snatched Anadarko away from Chevron (CVX), who already had a signed deal in place. CVX CEO Mike Wirth showed financial discipline that’s rare in such cases and declined to get into a bidding war. Instead, they walked away with a $1BN break-up fee.

Hollub obtained $10BN in financing from Berkshire in the form of preferred shares in order to close the deal. Perhaps Buffett also had doubts about the price OXY was paying, since he chose to avoid the common in favor of a more secure return. Covid soon struck, and the energy sector plummeted. Within a year of OXY’s audacious purchase crude oil was trading at negative prices as demand collapsed under the regime of lockdowns.

.avia-image-container.av-py5ji1-a382213e1561f4ae8b879b2abd224a0a img.avia_image{ box-shadow:none; } .avia-image-container.av-py5ji1-a382213e1561f4ae8b879b2abd224a0a .av-image-caption-overlay-center{ color:#ffffff; }

By April 2020 OXY’s stock had lost 80% of its value prior to the Anadarko deal. Although the Covid collapse was to blame, CVX had dropped by just over half. It looked as if Vicki Hollub had been outplayed by a competitor with financial discipline and devastatingly unlucky timing.

The energy sector began its slow recovery, but OXY lagged and by October 2020 was making new lows, down 85% from its pre-deal level while CVX was steadily recovering.

Since then, the gap has narrowed. Buffett evidently liked what he’s learned about OXY since he recently obtained regulatory approval to buy up to half of their common stock. Berkshire’s market outperformance this year has drawn quant funds. One investment manager believes Berkshire will eventually buy the whole of OXY, becoming an oil major in its own right.

OXY’s value lies in its reserves of oil and gas. But energy companies have accepted the energy transition and have initiatives aimed at showing they’re going to be part of the solution to CO2 emissions. Recently OXY announced plans to develop the world’s biggest Direct Air Capture (DAC) facility to remove CO2 from the ambient air.

Carbon Capture and Sequestration (CCS) received a boost in the recent Inflation Reduction Act (IRA). The 45Q tax credit starts at $85 per Metric Tonne (MT) for CO2 that is permanently sequestered underground. Enhanced Oil Recovery (EOR) has long relied on pumping CO2 into mature wells where the pressure has dropped, to force up more oil. The technology is reasonably well understood, and while burying CO2 to produce more fossil fuels doesn’t reflect the spirit of emissions reduction, it can be buried in other secure geological formations. Kinder Morgan has the most extensive CO2 pipeline network in the US because of their EOR business. Several pipeline company executives expressed optimism that they could benefit from the 45Q tax credit.

CCS makes the most sense where CO2 emissions are high – such as the exhaust of coal-burning power plants. But it has its critics. Robert Bryce recently reprised his 2009 criticism of CCS in response to the IRA. He noted that coal burning power plants lose up to 28% of their output when their emissions are being captured. He also warned that pipelines required to move CO2 to its final burial would likely have to be funded by taxpayers. And he estimated that capturing half of the 5.4 billion MTs of CO2 generated in the US annually would mean handling a volume of gas, even compressed to 1,000 pounds per square inch, equivalent to daily global oil production. He warns, “We would need to find an underground location (or locations) able to swallow a volume equal to the contents of 41 oil supertankers each day, 365 days a year.”

In JPMorgan’s 2022 Annual Energy Paper, Michael Cembalest estimated that capturing 15-20% of US CO2 emissions would involve handling a volume of gas exceeding all US production – a more modest estimate than Bryce’s but still staggeringly high.

OXY’s planned DAC facility is seemingly going after an even harder problem. The concentration of CO2 in ambient air (ie not standing downwind of a power plant) is around 412 parts per million. You have to process enormous quantities of air to get much CO2. OXY expects its CCS plant in Ector County, TX to capture 0.5 MT annually with the capability to reach 1 MT. The CO2 will be buried in a formation beneath forest land owned by paper company Weyerhauser. Trees are nature’s carbon capture, but the CO2 is eventually released when the tree dies or burns down.

OXY’s subsidiary 1PointFive (named in reference to the goal of limiting global warming by 1.5° C versus 1850) hopes to have 70 DAC facilities operational globally by 2035. The IRA provides up to $180 per MT tax credit for DAC. Five of the plants planned by 1PointFive in the US operating at 1 million MTs per year would generate $900 million in tax credits, significantly reducing OXY’s tax bill.

Buffett probably expects crude oil demand to remain strong for many years, supported by rising living standards in emerging economies. With enough DAC facilities in place, OXY investors could profit from providing energy the world wants and from mitigating its effects. It’s the kind of two for one deal the Oracle likes.

We have three funds that seek to profit from this environment:
Energy Mutual Fund

Energy ETF

Inflation Fund

Please see important Legal Disclosures.


From Top Hats To Tightening

The beginning of my career in finance overlapped with the presence of morning suits on the floor of the London Stock Exchange. Mullens & Co, founded in 1786, held the privileged role of “government broker”, meaning they transacted directly with the UK Treasury and were an important intermediary in financing the UK government.  As recently as 1980 when I started work, their brokers still wore top hat and tails, supposedly to ensure their visibility across the exchange floor but also to emphasize status.

Mullens hired from the most exclusive public schools (confusingly for Americans these are actually private) and I recall their people were all snobs, rarely acknowledging my scruffy presence in a mere business suit. In 1986 Mullens was acquired by SG Warburg which was later absorbed by UBS. Sartorial standards in finance have been sliding ever since.

The London Interbank Offered Rate (LIBOR), another anachronistic vestige of old school Britain, is also on its way out after its weaknesses were slickly exploited by derivatives traders 15 or more years ago. It seems odd today, but this benchmark of money market rates was not derived from actual transactions.

Banks indicated where they “would” lend eurodollars (an offshore deposit) to a high quality credit for periods of one month to one year. But such highly rated banks rarely needed to borrow at LIBOR. So it was based on theoretical trades, and most eurodollar business was transacted at rates other than LIBOR.  It was that quintessentially English invention based on unwritten assumptions and reliant on fair play all round.

The enormous growth in the derivatives market and shrinking need for banks to borrow from one another eventually led to far more trading profits relying on the benchmark than were involved in actually setting it. Being unmoored from transactions left LIBOR vulnerable to exploitation by unscrupulous traders who conspired to obtain favorable settings. There were prosecutions and jail terms for the miscreants, and naturally hefty fines imposed on the banks that employed them.

LIBOR was broken and never recovered, but so integral was it to vast numbers of derivatives trades, US residential mortgages and other contracts that its phase out has been slow. However, it now has less than a year to go and is generally being replaced by the Secure Overnight Financing Rate (SOFR).

A good portion of my career was spent analyzing the eurodollar futures curve for imperfections. To show that your blogger can similarly move on from the 20th century, I have therefore switched to SOFR futures to measure the yield curve and market expectations for Fed policy.

.avia-image-container.av-1jz8fqm-570169d14951b7c0e48c383deef978c5 img.avia_image{ box-shadow:none; } .avia-image-container.av-1jz8fqm-570169d14951b7c0e48c383deef978c5 .av-image-caption-overlay-center{ color:#ffffff; }

Which brings us at last to Fed chair Powell’s speech at Jackson Hole last Friday. Only two years earlier, the Fed unveiled a newly interpreted mandate which sought full employment while tolerating inflation temporarily above target. It’s fair to say events since then have exceeded expectations. The FOMC’s mandate could more correctly be expressed as addressing whichever of their two metrics has strayed farthest from its optimal level.

Hence, we were warned to expect, “a sustained period of below-trend growth” that will “bring some pain to households.” Those unfortunate enough to find themselves unemployed as a result can claim their sacrifice is for the greater good. They took one for the team. In case it wasn’t already clear, Powell added that “estimates of longer-run neutral are not a place to stop or pause.”

.avia-image-container.av-1ckdyem-a5eb83db4419324a6115930bf26f9480 img.avia_image{ box-shadow:none; } .avia-image-container.av-1ckdyem-a5eb83db4419324a6115930bf26f9480 .av-image-caption-overlay-center{ color:#ffffff; }

The yield curve is close enough to the “dot plot” from the Summary of Economic Projections that the FOMC and the market are in reasonable alignment. They’ve warned us that the policy rate will be moving higher because, “Our responsibility to deliver price stability is unconditional.” We are reminded that, “The historical record cautions strongly against prematurely loosening policy.”

The expressway to higher rates already offers an exit ramp in the form of persistently modest long-term inflation expectations. The University of Michigan survey expects five year inflation of 3%. Ten year Treasury Inflation Protected Securities (TIPs) yields imply 2.6%.  The Fed retains the faith of investors even if their forecasting record is consistently poor.

.avia-image-container.av-itdaa6-edf7b1f98c086fb72582b8ea97d59e48 img.avia_image{ box-shadow:none; } .avia-image-container.av-itdaa6-edf7b1f98c086fb72582b8ea97d59e48 .av-image-caption-overlay-center{ color:#ffffff; }

Which means rates will go up until they don’t; FOMC officials will be pestered to define “vanquished inflation”; success in bonds will require identifying the inflexion point.

Rarely short of opinions, friends and clients may be pleasantly surprised to find no trade recommendation in this blog post. For once the Fed and the yield curve are in harmony.

Given the market’s serene inflation outlook, prudence surely dictates that investors plan for an upside miss. According to research from Wells Fargo, around half the EBITDA of the pipeline sector reprices its tariffs based on an inflation index, often PPI. With 6% yields amply covered by free cash flow, we believe it remains attractive.

We have three funds that seek to profit from this environment:
Energy Mutual Fund

Energy ETF

Inflation Fund

Please see important Legal Disclosures.


The High-Priced Energy Transition

“Thankfully, energy has been the bright spot in our client portfolios,” said investor Emily Jaffe. We had just sat down to enjoy a most convivial lunch with Emily and her business partner Jeff Waters of OFC Wealth Management. In the photo below we are toasting the performance of the pipeline sector this year.

Superstition has its place in finance. Mindful that we might be marking the energy sector’s top with such reckless good humor, we all pledged sincere fealty to the market gods. Several minutes were spent in a roundtable of penance lest we provoke the deities to impose groveling humility for daring to enjoy the moment. Energy investors have plenty of scar tissue, most notably from the March 2020 Covid collapse. We all well remember how dire the outlook appeared back then. .

.avia-image-container.av-2fhs237-0c6758ff1fe5f405f630ee64d6cf8552 img.avia_image{ box-shadow:none; } .avia-image-container.av-2fhs237-0c6758ff1fe5f405f630ee64d6cf8552 .av-image-caption-overlay-center{ color:#ffffff; }

A question we’ve pondered recently is what the possible political consequences of resurgent energy markets are. 20 million US homes are behind on their electricity bills, around one in six residential customers and the worst ever crisis in late utility payments. US natural gas recently touched $10 per Million BTUs, a level not seen since the shale revolution unlocked vast domestic quantities of the resource.

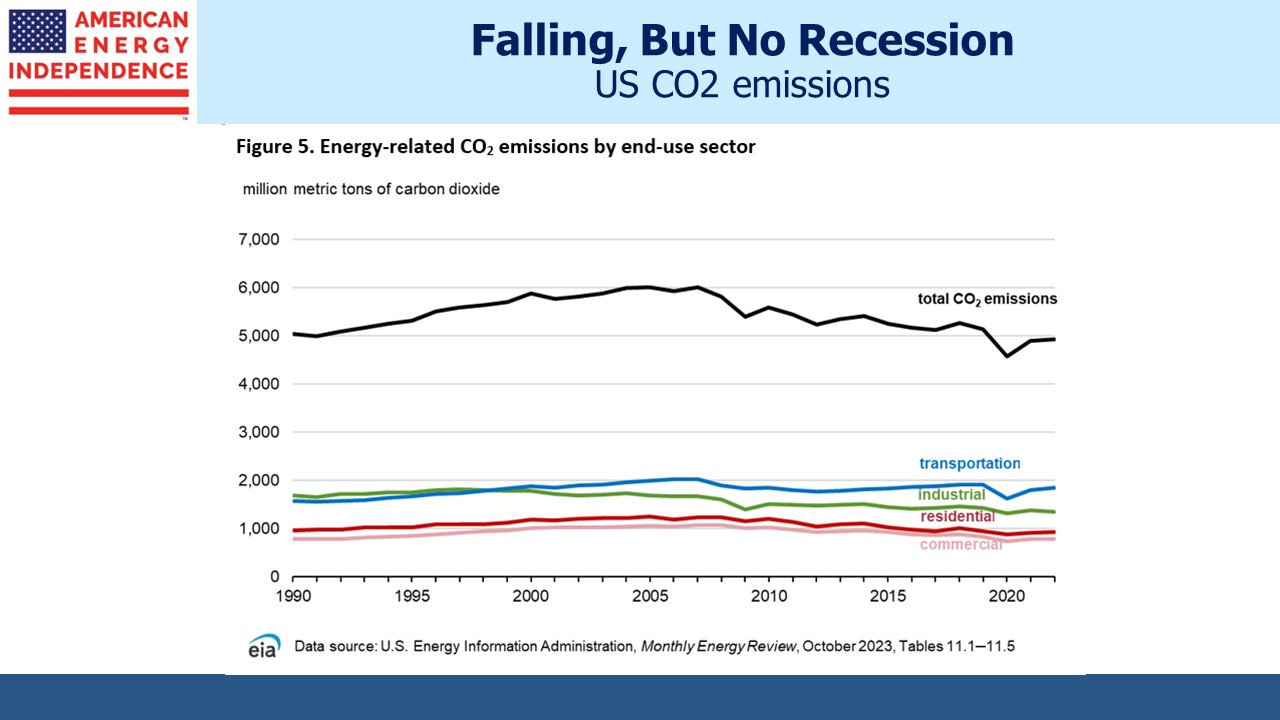
In spite of high prices, US power generation from natural gas hit a daily record in mid-July. Less than a year ago the US Energy Information Administration (EIA) was forecasting that utilities would switch back to coal, reversing a near two-decade trend that is the source of most of America’s drop in CO2 emissions. But measured by the Producer Price Index (PPI) US coal prices are up nearly 60% seasonally adjusted this year, a sharper move than for natural gas. As a result there’s been less switching back to coal than the EIA expected.

.avia-image-container.av-1xfqztf-f6f2de1e4829a4dbe041becbab3d15d4 img.avia_image{ box-shadow:none; } .avia-image-container.av-1xfqztf-f6f2de1e4829a4dbe041becbab3d15d4 .av-image-caption-overlay-center{ color:#ffffff; }

Residential energy bills are regulated in most countries. Eventually power providers are allowed to pass through cost increases but there’s a delay. Utility bills are headed higher.

As painful as this is for US households, it is much worse in Europe where natural gas and wholesale power prices are 7X or more than our own. The UK regulator Ofgem has been forced to concede regular large increases in the cap on the typical household energy bill. By next April it is expected to be 4X the level of two years earlier (see America Dodges The Energy Crisis) where it will consume 16% of the typical British household’s income.

.avia-image-container.av-1giz9rn-e1ce86ef3541ebf7c2e69c25d6ef5b0f img.avia_image{ box-shadow:none; } .avia-image-container.av-1giz9rn-e1ce86ef3541ebf7c2e69c25d6ef5b0f .av-image-caption-overlay-center{ color:#ffffff; }

A political backlash seems inevitable and justified. Italy is often perceived as the weak point in any EU crisis. Hedge funds currently have the largest short positions in Italian government debt since 2008, betting that the country’s fractious politics are ill-suited to confront popular dissatisfaction with energy bills. Most EU countries are providing subsidies to low income families and cutting energy taxes.

Policymakers will blame high energy prices on the rebound from Covid and Russia’s invasion of Ukraine. Germany catastrophically adopted the role of energy supplicant to Russia with the misplaced hope of drawing them closer. The unraveling of this strategy is the proximate cause of Europe’s energy crisis.

.avia-image-container.av-yt5leb-c31a2137f16c22726a75d1ebb70d4010 img.avia_image{ box-shadow:none; } .avia-image-container.av-yt5leb-c31a2137f16c22726a75d1ebb70d4010 .av-image-caption-overlay-center{ color:#ffffff; }

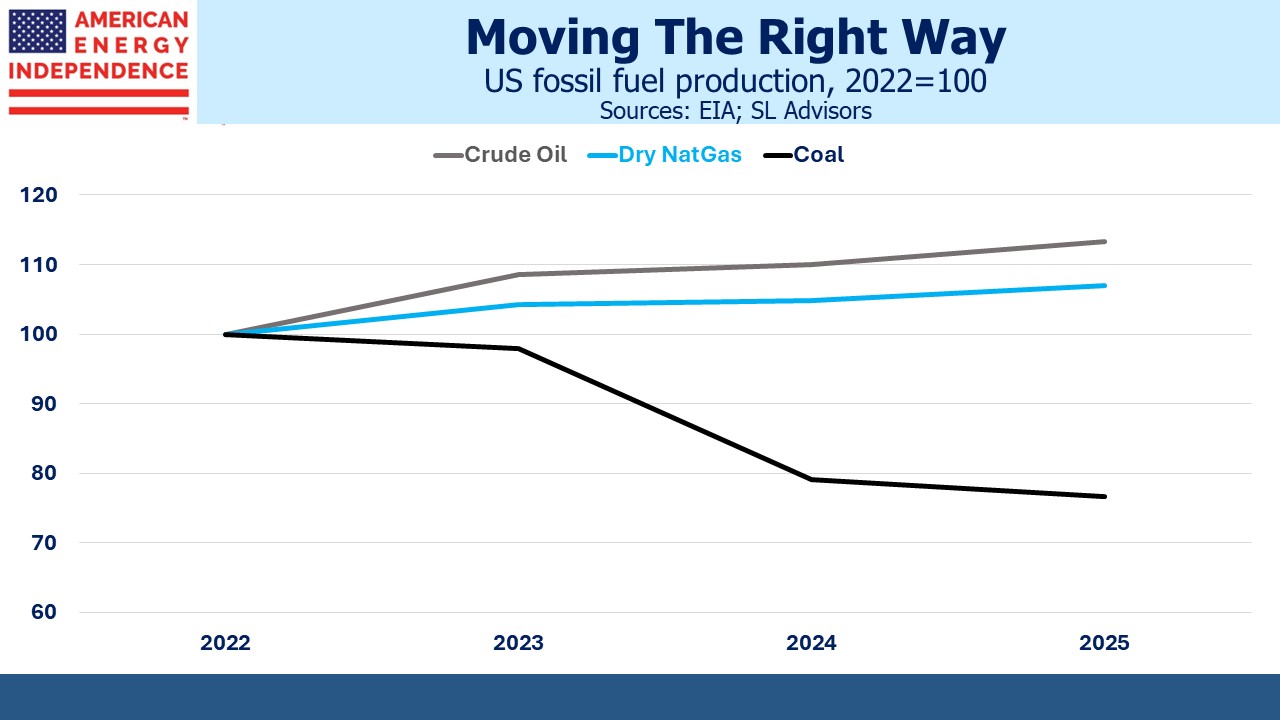
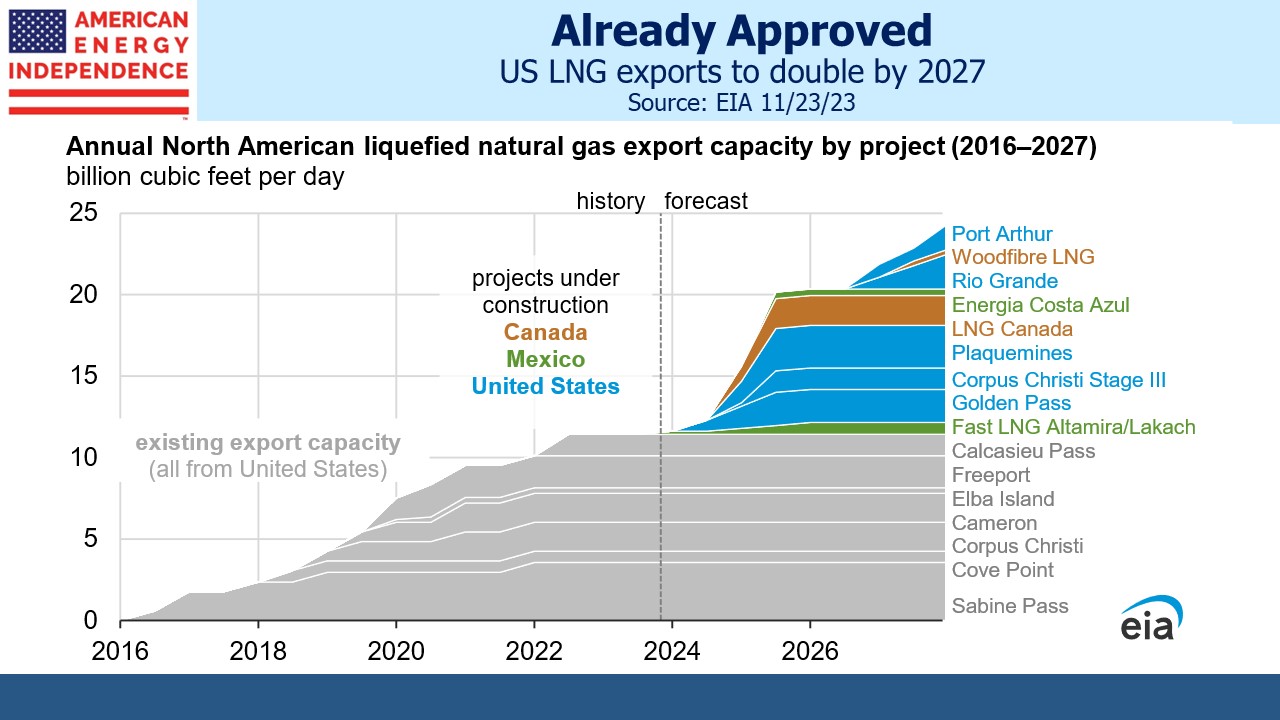
But investment in new oil and gas production has become more risky with the west’s pursuit of solar panels and windmills. US production of crude oil will not reach the pre-pandemic level of 2019 until next year. US natural gas production is growing roughly in line with LNG export capacity, leaving domestic supply unchanged. President Biden has pledged to provide natural gas to Europe, but he’s not doing anything to help US households. Exports are likely to absorb any increase in domestic production.

Energy companies also face the prospect of a windfall profits tax, which won’t provide much inducement to invest in additional supply.

.avia-image-container.av-tf2a6r-b0d3e8614e2b7b48b3080c961949c3e0 img.avia_image{ box-shadow:none; } .avia-image-container.av-tf2a6r-b0d3e8614e2b7b48b3080c961949c3e0 .av-image-caption-overlay-center{ color:#ffffff; }

So the big question is, will public opinion correctly assess that persistently high energy prices are caused by falling investment in new oil and gas production? The vilification of “big oil” by governments and ESG proponents has led to increased caution around growth capex. Will voters conclude that the Democrats have oversold the energy transition, over-promising the ability of intermittent power (solar and wind) while ignoring China pumping out additional CO2 that’s swamping whatever reductions western countries are achieving at already great expense?

Today’s pipeline sector is positioned to be an important part of the solution, both to high energy prices and reducing emissions. Utility bills will increasingly command attention as past policy errors hit family budgets. We’ll soon see if there are political consequences. The investment consequences have been good.

We have three funds that seek to profit from this environment:
Energy Mutual Fund

Energy ETF

Inflation Fund

Please see important Legal Disclosures.


Muni Bonds Suggest No Recession

Many readers enjoyed the recent blog posts on Bad Investment Ideas. Our criticism of ESG was especially popular, with many assessing it as a meaningless investment fad. ESG isn’t inherently bad – who doesn’t want better “G” (Governance) at their portfolio companies? But if every company can find someone to rate them highly on ESG, it’s clearly not a very demanding metric.

We did receive some pushback on bonds, especially the comment that the entire asset class was not fit for purpose and should be abandoned. One investor noted that he’s finding value in two year treasury notes yielding 3.3%. Bob Radli from Palm Beach Gardens, FL, a long-time investor, said we were overlooking the benefits in holding long term municipal bonds with yields over 4%. He pointed out that bonds offer important stability, especially as investors approach retirement.

It’s true that this year’s bear market in bonds has improved their value even if they haven’t provided much diversification to date. Holding 100% equities is only appropriate for a narrow set of long term investors, and while we think government bonds continue to provide poor value, cash yields have been edging up as the Fed normalizes monetary policy.

We’ve noted in the past that a barbell of stocks and cash can be used to create an income generating portfolio with low risk (see The Continued Sorry Math Of Bonds). Assuming S&P500 dividends grow at 4%, as little as a fifth of a portfolio in stocks with the rest held in cash match the after-tax return of a ten-year bond yielding 3%*. A 20% drop in stocks would reduce the barbell portfolio by 4%. The ten year bond would fall in value by that amount with around a 0.50% rise in yields.

.avia-image-container.av-149qxc0-72d717a64cd60a48be4b385ea9907b99 img.avia_image{ box-shadow:none; } .avia-image-container.av-149qxc0-72d717a64cd60a48be4b385ea9907b99 .av-image-caption-overlay-center{ color:#ffffff; }

I suggested to Bob that one year munis might be safer because they’re more “cash-like” and if the Fed has to tighten more than expected the investor benefits from rolling over into higher yields. Interestingly though, unlike the treasury yield curve, the municipal bond yield curve is positively sloped. There is a penalty in the form of lower yields for choosing shorter maturities.

Municipal bond investors will not be surprised at this, but for decades muni yields were lower than treasuries because of their tax-advantaged status. Index-type data on munis is hard to find, but digging into the archives of the Federal Reserve of St. Louis it’s clear that treasury yields dipped below municipal bonds during the 2008 Great Financial Crisis (GFC) and have stayed there ever since.

It’s a measure of the distorting effect Quantitative Easing (QE) has had on the bond market. Munis are overwhelmingly owned by individuals. The law requires the Fed to avoid credit risk in its bond holdings, hence QE hasn’t depressed muni bond yields the way it has treasuries and other sectors whose yields are linked, such as Mortgage Backed Securities (MBS) and investment grade corporate bonds.

Long term yields would be higher without QE. The positive muni yield curve suggests that absent QE, ten year notes would be above 4.5% based on the relationship that prevailed pre-GFC. The inverted treasury yield curve isn’t forecasting a recession, it’s reflecting the distortion the Fed’s bloated balance sheet has created.

If the Fed is to get ten year treasury yields high enough to slow the economy, meaning at least to 4%, it’s going to require short term rates well above that. Two years ago they reinterpreted their mandate to tolerate inflation above target for longer in the past. It was unfortunate timing, because the fiscal and monetary response to Covid provided huge stimulus to the economy. Today’s high inflation is well above what they had in mind.

This Friday chair Powell will give a much anticipated speech that may offer clues to the near term path of rates. A chastened FOMC shows little inclination to claim inflation vanquished, even though most observers and their own Summary of Economic Projections forecast a substantial decline over the next couple of years.

Short term rates may go much higher if that’s what’s needed to push bond yields up – but the exit ramp will always be available in the form of still modest inflation expectations which support the “transient” narrative even if Powell has abandoned the term. There’s always the chance they’ll consider selling some of their MBS holdings as the appropriate reversal of QE. It’s unlikely, so a sharp move in the market would result.

.avia-image-container.av-vj3c4g-c03850138bb94412909e7623245f3ade img.avia_image{ box-shadow:none; } .avia-image-container.av-vj3c4g-c03850138bb94412909e7623245f3ade .av-image-caption-overlay-center{ color:#ffffff; }

Recent data suggests a US recession is unlikely. By contrast, Europe is grappling with natural gas prices 7-8X the US and wholesale power prices even a year out that are 10X the US. Belgium’s prime minister has warned that the next, “…five to ten winters will be difficult.” Presumably he won’t be in power for most of them.

The positively sloped curve for municipal bond yields highlights the continued downward pressure exerted on treasury yields by the Fed’s decision to not sell any of their QE-acquired holdings. The direction of interest rates remains delicately balanced. We may learn more on Friday.

*The other assumptions are: 1.5% dividend yield on S&P500; 25% combined Federal and state tax on dividends; 35% tax rate on interest income; average 2% cash return over ten years; unchanged S&P500 yield in ten years

We have three funds that seek to profit from this environment:
Energy Mutual Fund

Energy ETF

Inflation Fund

Please see important Legal Disclosures.


Bad Investment Ideas Still Flourish (Part 2)

A few weeks we posted Bad Investment Ideas Still Flourish (Part 1). The current plethora of products injurious to one’s financial health assured enough material for Part 2.

ESG

Like many Wall Street fads, Environmental, Social and Governance (ESG) standards started out as a good idea before being used to exploit the naïve and those with rigid investment mandates. Individuals whose lives are guided by ESG possess personal qualities likely to make them worth knowing and may even be good for the planet too. But quantifying a friend’s good humor or generosity is no easier than measuring a company’s ESG-ness.  This made it a fertile environment for index providers and fund managers purporting to count the uncountable and charge for identifying it.

Not surprisingly, every company can find some independent third party to testify that they’re ESG. If Lockheed Martin can make it on to such a list, the standard must be infinitely malleable. The consequent growth in ESG has relied on equal measures of Wall Street cynicism and investor gullibility. In a world of only tall people, nobody is tall. If every company can find someone to give them a high ESG rating, there are no low ones and ESG is meaningless. It’s been a solution searching for a problem (see ESG is a scam). By way of penance and in search of the next profit opportunity, a swathe of anti-ESG funds must be coming soon. At least those investors will be appropriately cynical.

Hedge Funds

Lotteries offer ticket buyers a negative expected outcome but nonetheless succeed because from the moment of purchase until the drawing, buyers enjoy the hope of a life-changing win. The utility they derive from imagining how they’ll spend their winnings supports the profit margin of such enterprises. They are regressive too – the portion of income spent on lottery tickets falls as income rises.

The hedge fund industry shares with lotteries the sale of hope in defiance of the historical record to investors. Hedge fund indices present a relentless history of failure to meet expectations. Their promoters have cleverly shifted the goalposts from absolute returns (shown to be unattainable) to relative returns (relatively worse than almost anything else) to uncorrelated (ie nowhere close to the S&P500). Investors have gamely clung to the belief that superior qualitative human judgment will allow them to avoid disappointment, overlooking that a manager who is smarter, richer and probably better looking is likely to have more to show from the relationship at its conclusion.

My 2011 book The Hedge Fund Mirage; The Illusion of Big Money and Why It’s Too Good To Be True showed why, “If all the money that’s ever been invested in hedge funds had been in treasury bills, the results would have been twice as good.” It remains true today that there are too few good hedge funds to justify the assets available to them.

MLP-dedicated funds

When Master Limited Partnerships (MLPs) were the dominant corporate form for midstream energy infrastructure (oil and gas pipelines, storage assets etc), ‘40 Act funds were created to offer the retail investor exposure while shielding them from the hated K1s MLPs issue in lieu of 1099s. Uniquely, MLP funds accept the obligation of paying corporate taxes on their returns, a burden so uncommon that many investors remain unaware of it even today (see MLP Funds Made for Uncle Sam).

The need for MLP-dedicated funds passed years ago (see MLPs No Longer Represent Pipelines), as most big MLPs converted into regular corporations to be more attractive to investors, including institutions who largely shunned them. Today’s MLP-dedicated fund is limited to around a third of the pipeline sector, and relative to the broad-based American Energy Independence Index must accept less natural gas, more junk issuers and smaller median market cap. If they didn’t exist, nobody would create MLP-dedicated funds today. But inertia is a powerful force among existing investors. For the funds, restoring their original mandate to invest in the overall sector would signal the impending sale of current holdings so as to buy the biggest pipeline corporations, depressing NAVs and upsetting investors. Like fish in a drought-ravaged pond, they flop around their decreasing opportunities.

A special place in investment purgatory awaits the managers of MLP-dedicated closed end funds, who saw fit to add leverage to already undiversified portfolios. When an industry’s CFOs and rating agencies have agreed on a Debt:EBITDA ratio of 4X, it takes supremely misplaced self-confidence to reject such judgment by adding fund-level leverage to reach 5.5X (see MLP Closed End Funds – Masters Of Value Destruction). The March 2020 crash in pipeline stocks relied in part on the untimely deleveraging of these vehicles, a Darwinian result that left them appropriately diminutive with a much reduced ability to wreak such havoc in the future.

Conclusion

In ranking the bad investment ideas including those from Part 1 Bitcoin, Bonds, Climate Change politics and Emerging Markets, measured by damage inflicted there is no competitor to Bonds. An entire asset class has gone from years of providing merely paltry returns to now inflicting capital losses too. In 2013 my book Bonds Are Not Forever: The Crisis Facing Fixed Income Investors explained why low yields insufficient to compensate for inflation were likely to persist. If ever an entire asset class should be abandoned as not fit for purpose, this would be it.

We have three funds that seek to profit from this environment:
Energy Mutual Fund

Energy ETF

Inflation Fund

Please see important Legal Disclosures.


Pipeline Stocks Resume Their Rally

Managing investments in pipeline companies, even with a bias towards natural gas as we have, nonetheless means explaining the relationship with crude oil. It measures energy investor sentiment like a Texas-sized barometer. A discussion about the near-term direction of oil is often an important timing consideration for many investors.

A simple count of the frequency of the words “gas” and “oil” in 2Q22 earnings call transcripts reveals what management teams spend their time pondering. It should be no surprise that Cheniere, exporter of half of America’s Liquefied Natural Gas (LNG) never mentioned crude oil at all. Or that Williams Companies, owner of the Transco natural gas pipeline that runs up the US east coast, mentioned natural gas 38 times and crude oil three. But even Plains All American, a dedicated crude pipeline company, favored natural gas twice as much in their comments. And a detailed review of the transcript confirms that they were not referring to gasoline.

.avia-image-container.av-ihzwk8-dbf7ab24816b2c0fe1b4fbe72a73a72a img.avia_image{ box-shadow:none; } .avia-image-container.av-ihzwk8-dbf7ab24816b2c0fe1b4fbe72a73a72a .av-image-caption-overlay-center{ color:#ffffff; }

Oil grabs the headlines while natural gas flows do the heavy lifting of driving financial performance for many of these companies although not all of them.

By coincidence, the one-year performance of the American Energy Independence Index (AEITR) and WTI crude are close at 31% and 33% respectively. Over the past year their daily returns have a correlation of 0.54. By contrast Henry Hub natural gas (the US benchmark) is +90% compared with a year ago.

.avia-image-container.av-13vkt3s-ed3442c099abe259792de8a488c293ca img.avia_image{ box-shadow:none; } .avia-image-container.av-13vkt3s-ed3442c099abe259792de8a488c293ca .av-image-caption-overlay-center{ color:#ffffff; }

However, the link between pipelines and crude is tenuous. In early June both fell, but since then the AEITR recovered around two thirds of its losses while the price of oil has continued to weaken. Their rolling 30 day correlation has fluctuated between 0.81 and 0.22 this year. The two move together more often than not, but the relationship is far too weak to allow for a portfolio of pipeline stocks to be hedged by shorting oil futures.

.avia-image-container.av-mxfsd4-d9bf67a10dcf92c38d9b500349e54b6e img.avia_image{ box-shadow:none; } .avia-image-container.av-mxfsd4-d9bf67a10dcf92c38d9b500349e54b6e .av-image-caption-overlay-center{ color:#ffffff; }

This is why successful investors in the sector consider pipeline fundamentals rather than the future price of crude oil in determining their exposure. The forward dividend yield on the AEITR is around 5.6%. With dividends growing at 5-6% and stock buybacks worth another 1-2% of market cap, a 12-13% total return (5.6+5.5+1.5) is a not unreasonable expectation. We are increasingly seeing income-oriented investors make allocation to the sector. A half per cent drop in yields would add another 9% in capital appreciation.

The US Energy Information Administration’s current Short Term Energy Outlook is forecasting US crude production of 12.7 Million Barrels per Day (MMB/D) next year, up from 11.9 this year; 100 Billion Cubic Feet per Day (BCF/D) of natural gas production versus 96.6 this year; 12.7 BCF/D of LNG exports next year versus 11.2 this year; and global consumption of petroleum and liquid fuels of 101.5 MMB/D in 2023, up from 99.4 this year.

Midstream energy infrastructure is a volume business, the outlook for which is positive.

The inappropriately named Inflation Reduction Act (IRA) was warmly received by several companies on recent earnings calls. They especially liked the $85 per ton tax credit for CO2 captured where it’s generated and permanently sequestered underground. Pipeline companies are well-suited to benefit from this, and since only tax-paying businesses can claim the credit it’s unlikely to attract many start-ups.

There’s also a credit of up to $180 per ton for pulling CO2 out of the ambient air. Given the relentless focus on global warming you might think we’re choking on an unhealthy excess, but the reality is that at 412 parts per million, there’s not much CO2 around. This means extracting it is expensive because you have to process enormous quantities of air. Encouragingly, the tax credit looks to be near the low end of the range of likely costs (see The Hard Math Of The Energy Transition). This could stimulate new business opportunities in the sector.

Other features in the IRA were less appealing – the corporate alternative minimum tax could represent as much as a 3% loss in NAV for pipeline corporations according to research from Wells Fargo, although they cautioned that this could be an overly conservative estimate. Expect tax lawyers to work on minimizing the impact.

The 1% tax on buybacks is unlikely to be material but is nonetheless bad tax policy because it now adds a third tax bite out of corporate profits before they reach the investor.

Overall passage of the IRA doesn’t seem to have hurt the midstream sector and the carbon capture opportunities might even make it a net positive. Prospects remain very good.

Two other stories caught my eye. The Financial Times published ‘Extreme heat belt’ to place 100mn Americans at risk in 3 decades, research shows. Large swathes of the central US along with already hot places like Arizona and Florida are predicted to have more days of 125F within three decades. An economist lamented that, “Households and businesses alike continue to flock to markets throughout states like Texas, Florida, Arizona, Georgia and the Carolinas, despite the nation’s ever-increasing climate risks and challenges.”

Americans have been moving south for decades – sometimes for the politics but often for the climate. We like warm weather. 125F will be too hot for many, but winter in the northeast sucks and that’s why migration is south.

Bloomberg reported that the UK is importing LNG from Australia. The cargo was even transferred to a second vessel in Malaysia. That such a desperate and expensive purchase is worthwhile serves as another example of the failed policies engulfing Europe (see  America Dodges The Energy Crisis). We are fortunate that New England’s energy policies haven’t spread or we might be doing the same as Britain.

We have three funds that seek to profit from this environment:
Energy Mutual Fund

Energy ETF

Inflation Fund

Please see important Legal Disclosures.


America Dodges The Energy Crisis

US households are learning to cope with inflation in basic necessities, such a food and energy. Even though the recent CPI report was encouraging, the rising cost of living is a political issue. Fawlty Towers, the brilliant twelve episode British comedy series with John Cleese as the eponymous hotel owner Basil Fawlty, has a scene where a contractor who has mistakenly walled off the entrance to the dining room tries to console his irate customer by saying, “Mr. Fawlty, there’s always someone worse off than yourself.” To which Basil shoots back “Well I’d like to meet him…I could use a laugh.”

Schadenfreude may not be widely felt amongst middle class American households struggling with elevated energy prices, but the impact of the global energy crisis is highly uneven. The two charts below offer a vivid comparison.

.avia-image-container.av-6icmyp-63296a05c87abe868b9a020007ae3455 img.avia_image{ box-shadow:none; } .avia-image-container.av-6icmyp-63296a05c87abe868b9a020007ae3455 .av-image-caption-overlay-center{ color:#ffffff; }

US residential electricity prices are forecast to be up 6.1% this year and 2.5% next year, a notable increase compared with the trend of recent years. Natural gas provides 38% of US power, and Americans are fortunate we are more than self-sufficient because it’s left us relatively unscathed by the run up in prices globally.

The Dutch natural gas TTF futures contract currently trades at around €210 per Megawatt Hour (Mw/H), over 6X the equivalent US price. European electricity prices were already substantially higher than the US before Russia invaded Ukraine. The gap has widened since.

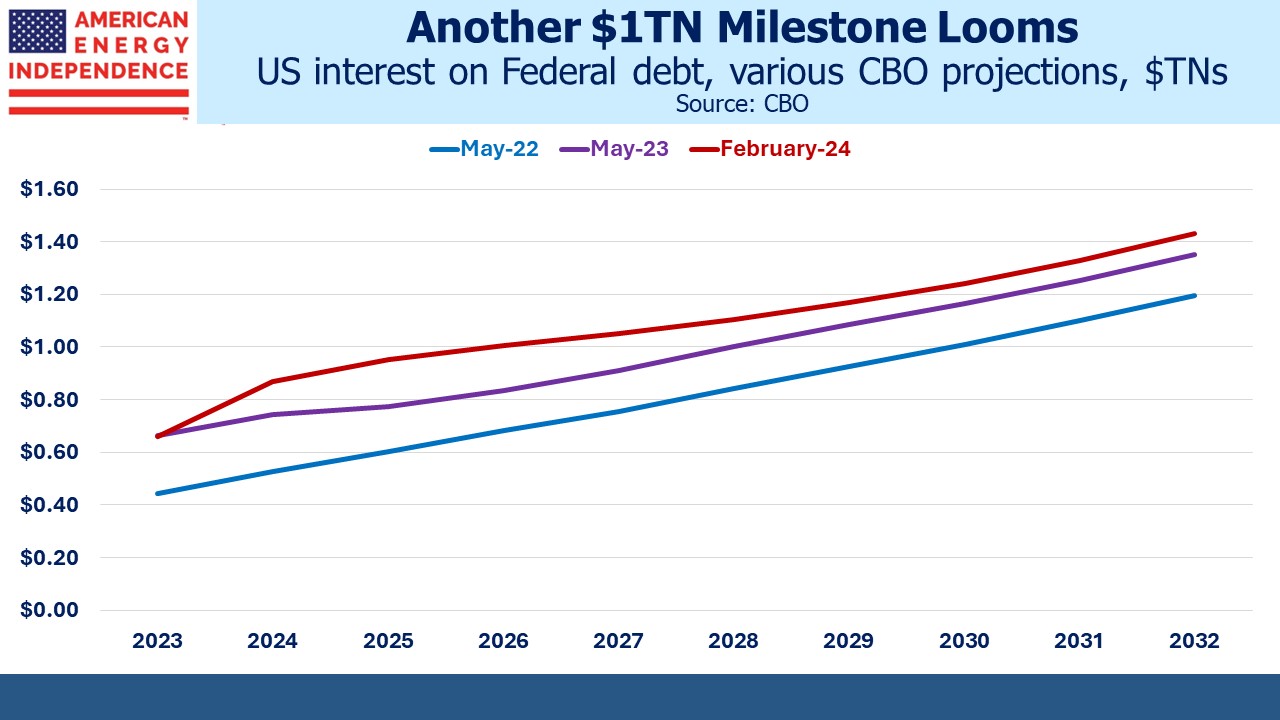
The UK regulator Ofgem sets a cap on energy prices for the typical UK household. Comparing US residential electricity with UK household energy isn’t a perfect match, but the looming price increase is nonetheless jaw-dropping.

.avia-image-container.av-zq0pxd-79e5dbd0261ccff2b5c8e8f786b376b2 img.avia_image{ box-shadow:none; } .avia-image-container.av-zq0pxd-79e5dbd0261ccff2b5c8e8f786b376b2 .av-image-caption-overlay-center{ color:#ffffff; }

Ofgem has had to keep raising the cap to avoid bankrupting UK energy providers. As a result, by next April the cap is likely to be set at 4X its level of two years earlier. The typical British household will go from spending £1,100 to £4,400 per year on energy.

Median per capita British income is $15K, versus $19K in the US. Assuming 2.2 resident per household and a $1.20 exchange rate, this means energy will consume 16% of the typical British household’s income, up from 4% two years ago.

This is a huge failure of public policy. Britain didn’t create a fatal reliance on Russian natural gas the way Germany did, but they’re not immune from the leap in prices and their pursuit of renewables clearly hasn’t offered any protection.

The EU and notably Germany has been the global leader in pursuing the energy transition. Reducing EU CO2 emissions is good, but only to the extent that it convinces China to follow suit. China’s CO2 emissions are now more than 3X the EU’s and 2X the US. We can set a good example, but the mathematical reality is that China’s choices matter more than ours.

OECD countries, which include the US and most of the EU, are richer than developing countries and therefore better equipped to deal with rising sea levels and other possible consequences of heightened CO2 levels. In other words, policymakers are embracing the energy transition in part to help poorer nations.

Therefore, it was illuminating to see China recently suspend climate talks with the US following Nancy Pelosi’s ill-advised visit to Taiwan. In doing so, China showed that they regard such negotiations as more beneficial to the US than to China. Our climate negotiators at the UN have performed so poorly that China somehow thinks it has less to lose from rising CO2 emissions than we do.

.avia-image-container.av-jvalfl-b53e491b45947d822a908369719db022 img.avia_image{ box-shadow:none; } .avia-image-container.av-jvalfl-b53e491b45947d822a908369719db022 .av-image-caption-overlay-center{ color:#ffffff; }

Such a view is perpetuated by western policymakers who pursue increased use of renewables at great expense to their populations without ensuring commensurate commitments from nations more vulnerable to the more extreme outcomes some climate scientists warn are coming.

The high costs of European energy policy show there’s nothing to emulate. We can’t want reduced emissions more than China does. Otherwise they’ll free-load on our efforts and continue to push back the date when their CO2 emissions will begin to fall. It’s currently set for 2030, but China’s most recent five year plan removed limits on coal consumption and its share of primary energy generation.

The US is still energy independent in spite of the best efforts of Democrat leaders to pursue the failing policies we see in Europe. Natural gas remains critical to a future of affordable energy and continues to offer the world’s best chance to meaningfully reduce CO2 emissions by replacing coal. Left wing energy policies risk introducing left wing, European prices.

We have three funds that seek to profit from this environment:
Energy Mutual Fund

Energy ETF

Inflation Fund

Please see important Legal Disclosures.


The Fed’s Hobson’s Choice

The Fed has a problem with long-term yields. They are remaining stubbornly low, in willful defiance of steadily increasing short term rates. Slowing the economy so as to raise unemployment will be hard unless bond yields move high enough to impede some capital investment and debt issuance. There were signs of this in the spring when rising mortgage yields caused housing to weaken. But ten year notes soon fell back below 3%.

Today’s real yield (defined as the ten year notes minus one year trailing CPI) is –6%. Since the inflation peak of the early 1980s, slowing the economy and increasing unemployment has almost always required positive real rates. We’re not close.

.avia-image-container.av-17un9pz-9237b549b30bf43a05c390edfc4c17ea img.avia_image{ box-shadow:none; } .avia-image-container.av-17un9pz-9237b549b30bf43a05c390edfc4c17ea .av-image-caption-overlay-center{ color:#ffffff; }

Friday’s payroll report was surprisingly strong. Everybody who wants a job has one. The FOMC’s Summary of Economic Projections warns that the Fed funds rate will reach 3.8% by the end of next year. Bond investors are unfazed by this – eurodollar futures are priced for a more sanguine 3.25%, and were even more relaxed prior to Friday’s strong data. But in either scenario, the yield curve will remain inverted.

The Fed’s goal is to drive up unemployment. Their public comments rely heavily on euphemisms because it’s a heartless goal. Inflation is the scourge that harms all, so some of you will be sacrificed (ie lose your jobs) for the greater good. It’s monetary orthodoxy traditionally supported by Republicans, but there is much that could go wrong.

Given employment’s apparent resilience in response to the FOMC’s early moves, it’s possible that short term rates will need to move higher than 3.8%. Ten year treasury yields may need to reach 4% in order to add a few million unemployed, which would presumably require the Fed funds rate to reach at least 5%.

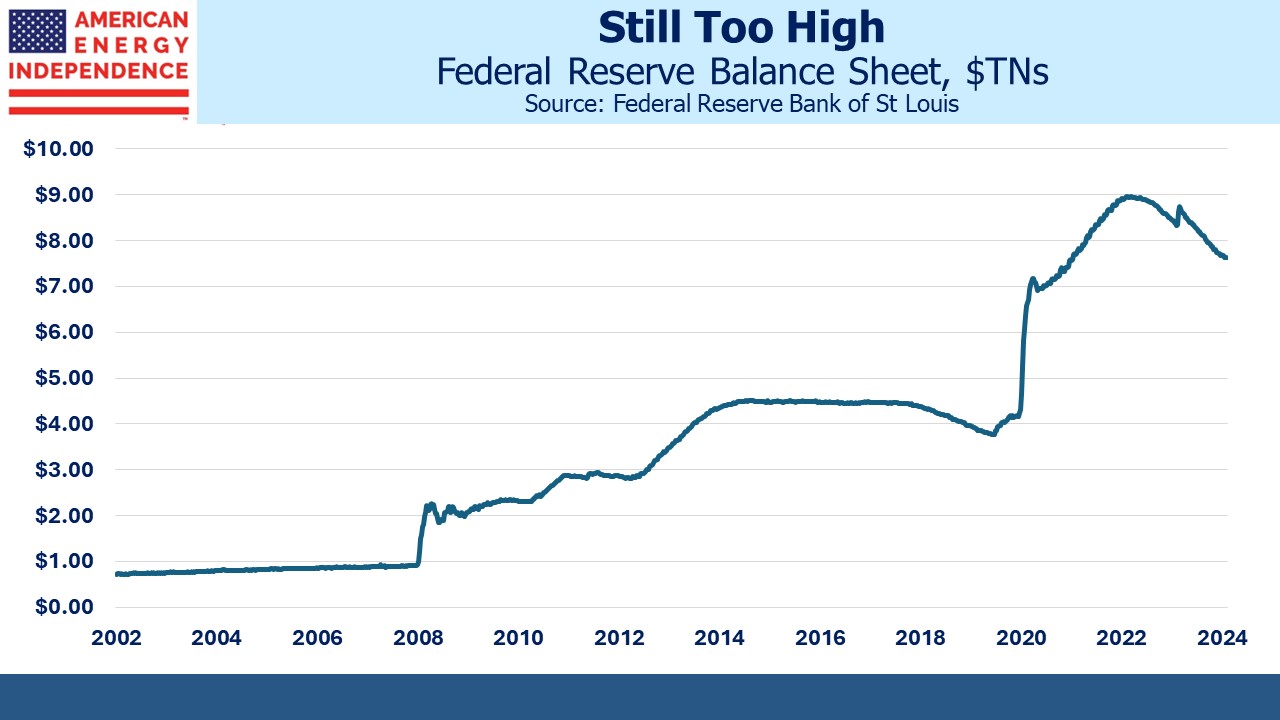
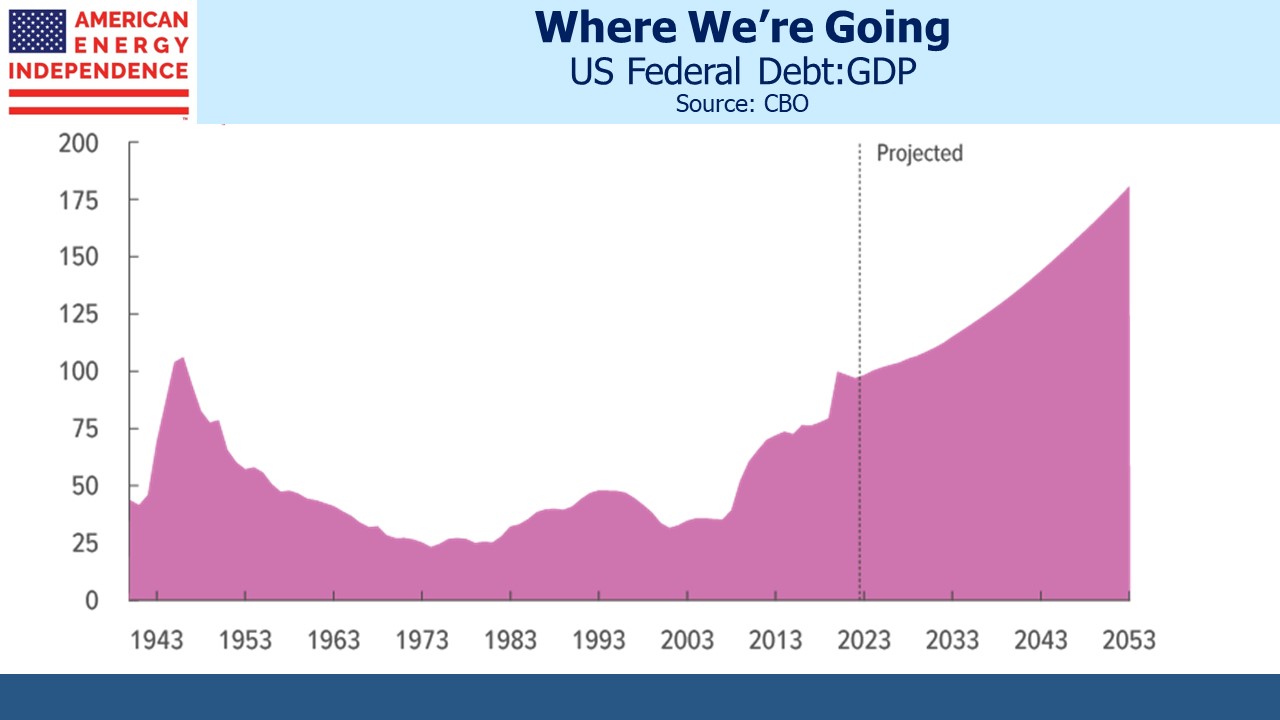
Fed chair Jay Powell will refer to the resulting budgetary problem as merely optical, but Congress may deem it more tangible. The Fed’s $8TN balance sheet has been the world’s biggest positive carry trade, allowing them to remit a $109BN operating surplus to the Treasury last year. By paying close to zero on bank reserves, most of the coupon income from the Fed’s holdings of treasuries and Mortgage Backed Securities (MBS) funded their surplus. The Federal government’s need to fund its budget deficit was lower by this amount.

.avia-image-container.av-if9b4n-1ad803bade21fe745e1309e15ade5207 img.avia_image{ box-shadow:none; } .avia-image-container.av-if9b4n-1ad803bade21fe745e1309e15ade5207 .av-image-caption-overlay-center{ color:#ffffff; }

Last year the Fed’s balance sheet averaged $8.06TN. They reported $126BN in interest income, so earned around 1.5% on their holdings. Maturing short term securities this year may have pushed up the average yield on the remaining portfolio slightly, but with Fed funds at 2.25-2.5% it’s likely they’re now enduring negative carry. The operating surplus will disappear, and on present trends become a deficit by next year.

The Fed shows no inclination to sell anything. Auctioning off treasuries would be tricky because they’d have to co-ordinate with the Treasury’s own auction schedule. But selling MBS would cause the rise in bond yields they need while also reducing their negative carry. However, sales would probably result in realized losses on bonds bought at higher prices. In any event, passive balance sheet reduction is their choice, which means the 2023 operating deficit will be the first one to draw Congressional attention.

Quantitative Easing (QE) followed by its proper inverse, Quantitative Tightening (QT) with selling, means buy high and sell low. Not selling simply swaps realized losses for protracted negative carry. The Fed has implemented it on a scale likely to discredit the strategy as the bill comes due. They only implement QE during a recession, when bond prices are high/yields low.

Restraining the economic rebound QE helped cause will create an operating deficit.

The difficulty in pushing up bond yields, which creates a need for even higher short-term rates, looks like a slowly developing PR disaster for the Fed. But there’s an alternative, plausible outcome. They could point to still modest long term inflation expectations in both the market for Treasury Inflation Protected Securities (TIPs) and the University of Michigan surveys. They could sidestep the struggle to push up bond yields and slow the economy. They could “declare victory and get out”, as Senator George Aiken suggested in 1966 when discussing Vietnam. The Fed could at any time look beyond the latest CPI release and declare inflation to be on a steady path lower – which based on market indicators and surveys, it is. Under such circumstances, the politics of requiring taxpayers to fund their operating deficit would be theoretical.

These two radically different paths imply substantially different rate outcomes. It’s why bonds are so volatile nowadays. Of the two, we lean towards the latter, which avoids a recession and will allow inflation to persist at 3% or higher rather than 2%. But the FOMC’s hawkish posture shows that’s not in their current thinking. Bonds still don’t offer an investment return, but at least there are some fascinating trading opportunities.

We have three funds that seek to profit from this environment:
Energy Mutual Fund

Energy ETF

Inflation Fund

Please see important Legal Disclosures.


Earnings and Pending Legislation Good For Pipelines

The theme to pipeline earnings for 2Q22 is one of positive surprises. It reminds me of Don Layton, former vice chair at JPMorgan and more recently CEO of Freddie Mac, when I told him I’d hired a new derivatives trader with a perfect Math SAT. Don, not easily impressed, responded by recounting a class he attended at MIT where the professor asked anyone who had not achieved an 800 Math SAT to stand up. Only a handful did.

Midstream CEOs could similarly remain seated while delivering earnings reports that mostly exceeded Wall Street expectations. Anticipating this, JPMorgan had recently been raising their forecasts, and “beats” were nonetheless common.

Start with Cheniere, who beat Wall Street analysts by a wide margin, as they did in the prior quarter too. EBITDA came in at $2.529BN versus consensus at $1.9BN. The company is now guiding to full year EBITDA of $9.8BN-$10.3BN, fully $4BN above their original ‘22 forecast made last year. They also spent $540MM on buybacks, retiring 4.1 million shares. These purchases fell late in the quarter. Their 10Q revealed that their share count dropped by a further 0.6 million shares during July, so the buybacks have continued. Cheniere’s prospects, already strong, received a further boost when Russia invaded Ukraine. Global trade in Liquefied Natural Gas (LNG) is on a strong growth path. They now expect to generate $20BN in excess free cash through 2024.

.avia-image-container.av-1mrm477-01d75be173ece4917c08557b6c219e5e img.avia_image{ box-shadow:none; } .avia-image-container.av-1mrm477-01d75be173ece4917c08557b6c219e5e .av-image-caption-overlay-center{ color:#ffffff; }

Asia has historically dominated global trade in LNG, with China recently displacing Japan as the biggest buyer. Along with South Korea, India and Taiwan five Asian buyers were over 60% of global LNG volume last year. In the future we shall see European buyers figure more prominently.

.avia-image-container.av-16to91f-0ac229c294e497bf3d5bd5a70a1d55dd img.avia_image{ box-shadow:none; } .avia-image-container.av-16to91f-0ac229c294e497bf3d5bd5a70a1d55dd .av-image-caption-overlay-center{ color:#ffffff; }

This is already creating competition between the two regions. Germany and other European countries regard their desperate need for natural gas imports as a temporary diversion on their energy transition to an economy dominated by renewables. Consequently, they sometimes balk at signing the twenty year contracts that LNG exporters require to justify the enormous capital investment required. Asian buyers are more pragmatic, which has led to them signing a series of agreements with US shippers.

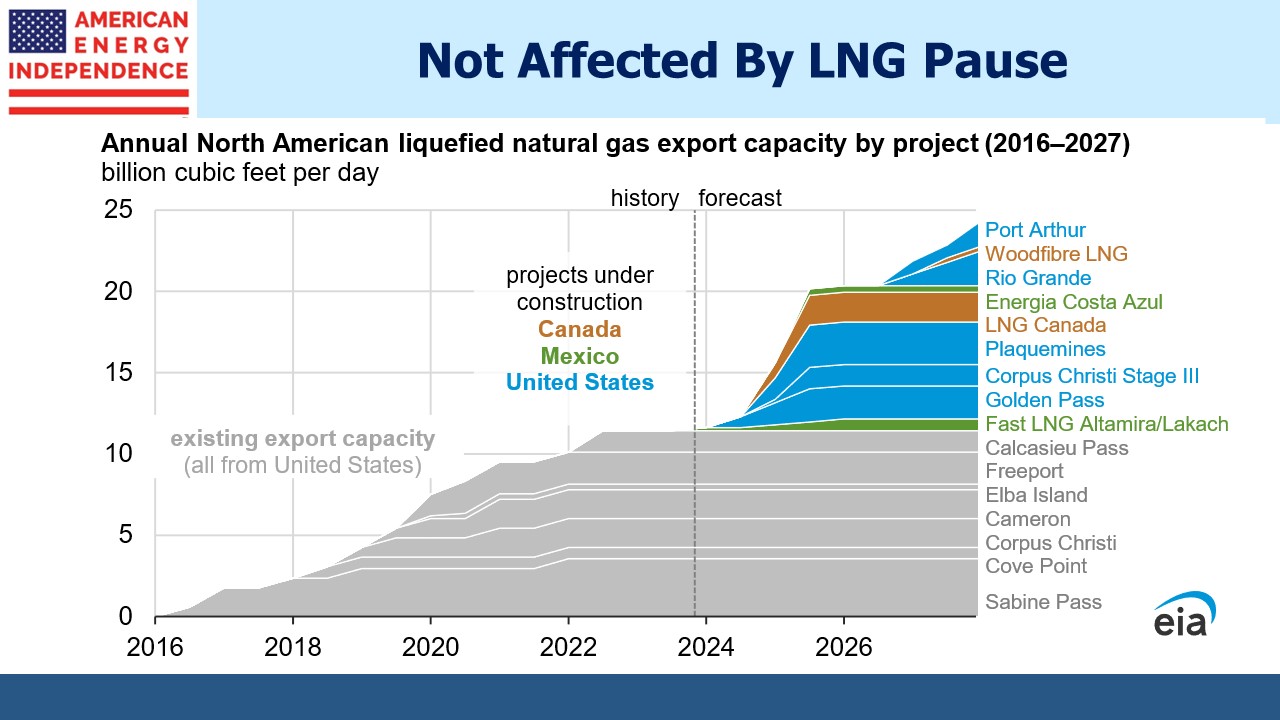
This tension is visible in the LNG market, where a spread is opening up between the European TTF benchmark and the Asian JKM. Ensuring adequate supplies before the northern hemisphere winter is driving global competition. We think this increased demand will endure, which will result in more commitments to buy US LNG and therefore more projects achieving a Final Investment Decision (FID) to go forward.

Energy Transfer, probably the individual stock most widely held by financial advisors who own our funds, raised 2022 EBITDA guidance from $12BN to $12.7BN (midpoint). They expect their Lake Charles LNG facility to reach FID later this year.

Williams Companies (WMB) increased their 2022 EBITDA guidance for the second time this year, now $6.25BN vs $5.8BN originally (midpoint). They expect to end the year with Debt:EBITDA of 3.6X. CEO Alan Armstrong noted that their $1.70 dividend (yield 5.3%) is covered 2.29X.

Enterprise Products Partners (EPD) beat sell-side expectations by almost 7%. The stock yields 7.3%, reflecting the MLP yield premium the market imposes to handle K1s.

.avia-image-container.av-r3al9f-a8de677c1d359343b6bdbfb45f451526 img.avia_image{ box-shadow:none; } .avia-image-container.av-r3al9f-a8de677c1d359343b6bdbfb45f451526 .av-image-caption-overlay-center{ color:#ffffff; }

The Inflation Reduction Act of 2022 now looks likely to pass. Private equity managers once again retained their indefensible carried interest tax treatment, the price Senator Kyrsten Sinema oddly insisted on to secure her vote. Independent analysis is confirming that it should reduce US CO2 emissions by 40% below 2005 levels by 2030, a significant accomplishment but so far China remains uninspired to follow our lead.

Part of the expected reduction in US emissions in the proposed legislation will rely on 45Q tax credits as high as $85 per tonne for Carbon Capture and Sequestration (CCS). Several companies commented that this was a positive development.

EPD’s Randy Fowler said, “…we believe the proposed changes to the 45Q credits could be a game changer for post combustion emitting customers.” ET’s co-CEO Mackie McCrea said, “…the new credits in this new bill would provide for a significantly higher rates of return with that tax credit going from up to the $85.”

WMB’s Chad Zamarin head of strategic corporate development said, “the 45Q credits would be very supportive of our CCUS project in the Haynesville.”

The pipeline sector was strong in July, coming close to recouping the losses of June. Recession concerns appear to be waning. Based on Friday’s unemployment report, the economy continues to expand at a rapid pace, with the unemployment rate falling to 3.5%. The Fed’s refusal to sell the mortgage backed securities they acquired during Quantitative Easing is making it difficult to slow the economy. Ten year treasury yields of 2.8% are stimulative. Bond yields are more important to capital investment and real estate than short term rates. A 3.5% neutral Fed Funds rate, the FOMC’s initial target, is unlikely to push treasury yields up much. Absent a shift to more rapid balance sheet contraction by the Fed, the economy looks robust.

With strength in pipeline sector earnings and improving growth prospects for natural gas, it’s hard to think of a more attractive sector for the long term investor.

We have three funds that seek to profit from this environment:
Energy Mutual Fund

Energy ETF

Inflation Fund

Please see important Legal Disclosures.


Liquefied Natural Gas Shows Up In More Places

To the twin certainties of death and taxes, the energy investor might add increased US exports of Liquefied Natural Gas (LNG). The outcome of Russia’s invasion of Ukraine is far from certain, but it’s hard to envisage Europe ever relying on Nord Stream 2 for natural gas. Moreover, once the flows from Nord Stream 1 stop – and at 20% of capacity they almost have – any future volumes of natural gas from Russia will not represent a critical part of Europe’s overall supply.

It’s rare for the flaws in a widely accepted public policy to be so cruelly exposed. Brexit always looked like a shot in the foot, an impulsive response to excessive immigration dressed up as a jingoistic rejection of an EU that constrained Britain’s true potential. Now UK GDP growth is 19th out of the G20, ahead of only Russia. Scotland will likely vote for independence next year, seeking their true potential unshackled from London. The reunion of the island of Ireland also looks increasingly likely within a decade or so.

Brexit will eventually undo the 1707 Act of Union that joined England with Scotland, and the Acts of 1800 that added the entire island of Ireland to Great Britain. Northern Ireland, born in 1921 out of persistent unrest and confirmed in the 1998 Good Friday agreement, rejected Brexit which means they picked Ireland inside the EU rather than England outside of it. Britain’s English rural majority imposed its Brexit will on diminutive nation-appendages as well as urban London. Once the others have left, fka Great Britain’s GDP will be closer to Canada than Germany. Like people, countries make mistakes too.

Similarly, Germany’s national security rested unsteadily on an unwavering belief that engagement with Russia through trade would ultimately lead to shared values if not a huge eastern liberal democracy. Angela Merkel, only the last in a succession of German leaders not burdened with self-doubt on the matter, faces a retirement of speeches in staunch defense – or few public speaking engagements at all.

.avia-image-container.av-s0xkxe-7742661cac48efe83a7b41b0a63e8ae0 img.avia_image{ box-shadow:none; } .avia-image-container.av-s0xkxe-7742661cac48efe83a7b41b0a63e8ae0 .av-image-caption-overlay-center{ color:#ffffff; }

US energy investors are the beneficiaries of Europe’s geopolitical mis-steps on energy security. Because EU policymakers also believed the world’s poorer countries would soon insist on growth via renewable energy or none at all, they pursued intermittent power to inspire others. The consequences of these twin policy failures include year-ahead power prices in France up 10X. Renewables penetration is correlated with European electricity prices. Leaders in developing countries, most obviously China, fear popular unrest at slow growth more than shame at failing to emulate hubristic Germany.

.avia-image-container.av-pim4gi-da108949cd950fbd00f89100b005cb3e img.avia_image{ box-shadow:none; } .avia-image-container.av-pim4gi-da108949cd950fbd00f89100b005cb3e .av-image-caption-overlay-center{ color:#ffffff; }

US natural gas is the opportunity to express this geopolitical analysis as an investment view.

Cheniere Energy is the obvious beneficiary. They export half of our LNG and have the lowest maintenance capex as a % of EBITDA of any midstream infrastructure company. They’re well positioned to fulfill Asian contracts that often run to two decades while growing free cash flow.

To this observer, LNG prevails over ESG nowadays in pipeline company presentations, reflecting a triumph of substance over style. To wit, in Williams Companies’ 2Q22 investor presentation, LNG appears 15 times and ESG two. One might call this a Seriousness:Frivolity ratio, or S/F, of 15:2. Kinder Morgan’s 2Q22 earnings press release S/F was 8:0. Enbridge had an S/F of 46:10 in their 2Q22 earnings presentation.

For Williams Companies, this preponderance of substance translates into nine projects to transport natural gas to LNG export facilities, with estimated in service dates all within five years. They see 1H22 LNG plus Mexican pipeline exports up over 10% year-on-year. They expect LNG exports along their Transco natural gas pipeline corridor to double by 2035.

Kinder Morgan claims to move half of US natural gas destined for export as LNG. Their growth projects include supplying Venture Global’s Plaquemines LNG facility, which just received its final investment decision in May.

Enbridge expects to almost triple its LNG exports by 2040. It’s not just in the US that it’s growing. Enbridge will supply natural gas to Woodfibre LNG, currently under development near Vancouver.

For those who find normal energy sector volatility tame, NextDecade is closing in on a final investment decision on their Rio Grande LNG export project in Brownsville, TX. They regularly issue press releases announcing new “sale and purchase agreements”, most recently with Exxon Mobil. This had an S:F ratio of 27:2, even though NextDecade’s ESG credentials are solid because they plan to capture the CO2 emitted as they convert methane into LNG.

If you possess unshakeable conviction that the abrogation of Germany’s policy of energy engagement with Russia is irreversible, NextDecade offers a pureplay bet on the consequences.

.avia-image-container.av-n18yk2-910237042e50e8e57ab70686b9080ccf img.avia_image{ box-shadow:none; } .avia-image-container.av-n18yk2-910237042e50e8e57ab70686b9080ccf .av-image-caption-overlay-center{ color:#ffffff; }

Energy as a share of the S&P500 has doubled from its 2020 low but remains well below the long-term average.

We have three funds that seek to profit from this environment:
Energy Mutual Fund

Energy ETF

Inflation Fund

Please see important Legal Disclosures.