A Reactive Federal Reserve

The other morning a CNBC guest was able to share an insight not normally found on TV. The need for ten-second ideas greatly limits the ability of otherwise intelligent people to share much wisdom. R.J.  Gallo, whose Christian names are apparently only initials, trades municipal bonds for Federated Investors. He suggested that rates can rise slowly because people expect no worse.

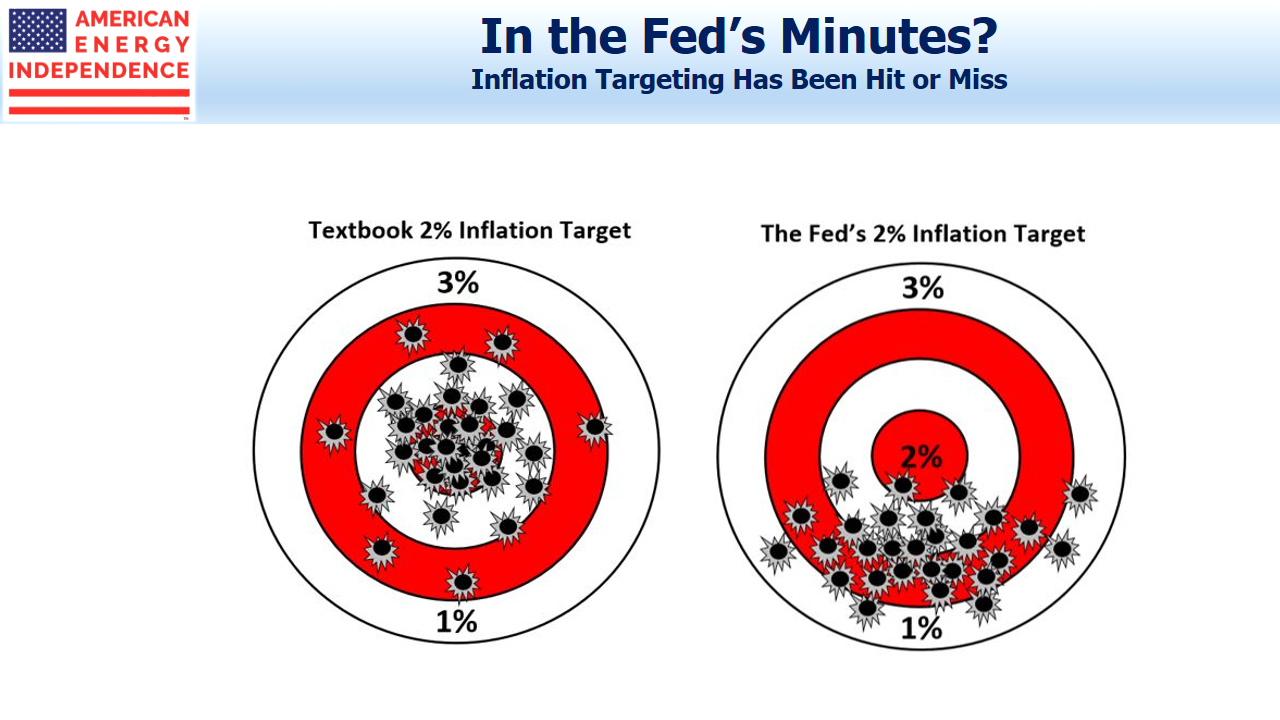
More precisely, Gallo said that because inflation expectations are so well anchored at around 2%, the Fed can wait until actual inflation rises. Gallo noted that, “The Fed has been unable to structurally hit their inflation target for many years.” He went on, “The Fed is not totally sure how the inflation process works”

.avia-image-container.av-qqlw3q-649ce3debedca7585bc12cce1cb4149d img.avia_image{ box-shadow:none; } .avia-image-container.av-qqlw3q-649ce3debedca7585bc12cce1cb4149d .av-image-caption-overlay-center{ color:#ffffff; }

Federal Reserve Missing Targets

This makes a lot of sense. The reason the Fed has maintained a Fed Funds forecast that’s too high is because they’ve incorrectly expected rising inflation. They’ve struggled at times to even get the Personal Consumption Expenditure price index (their preferred measure) to reach their 2% target.

The high inflation of the 1980s, which afflicted most developed economies, is more history than a memory for most market participants. “Almost a generation of people… have seen very low inflation for (a) very long (time).”

Gallo therefore argues that we’re, “moving to an era where the Fed is allowed to be reactive.”

That would represent a substantial shift in thinking. Fed chair from 1951-70 William McChesney Martin famously said, “The job of central bankers is to take away the punch bowl just as the party gets going.”

Successive Fed chairs have ever since operated with the expectation that they were party poopers, although it’s probably a couple of decades since one acted that way.

Ten year treasury yields at 2.5% show there is little fear of rising inflation. This, combined with the Fed’s inability to identify the circumstances that will cause inflation, lead to the insight that the Fed is moving from proactive to reactive. They understand less than they used to. Or, given their more transparent decision making process, we now know that they always understood less than we thought (see Bond Market Looks Past Fed).

The conclusion for bond investors is that Fed policy on short term rates will follow bond yields, which is probably as it should be. Fed policy has been more accurately forecast by expectations embedded in the yield curve. Collective expectations of inflation are as good as the Fed’s best analysis, and perhaps better.

It’s a natural progression for short term rate policy to be increasingly set by bond investors. An inverted curve (as was briefly the case earlier this year) caused some fears that the Fed would cause a recession. The correct conclusion was that the path of policy rates was wrong. Fed chair Powell duly put this right (see Bond Market Corrects Fed).

Rising bond yields will be a necessary requirement for the Fed to push short term rates higher. Until that happens, investors can remain comfortable that the Fed is still on hold, which continues to favor stocks.

SL Advisors is the sub-advisor to the Catalyst MLP & Infrastructure Fund.  To learn more about the Fund,  please click here.

SL Advisors is also the advisor to an ETF (USAIETF.com).


The Coming Pipeline Cash Gusher

Pipeline company earnings are being scrutinized for capital investment plans.  The energy sector’s pursuit of growth has been well covered. Investors would prefer less excitement and more return on capital through dividends and buybacks. Company management teams are for the most part grudgingly co-operating.  Targa (TRGP) CEO Joe Bob Perkins defiantly described growth projects as “capital blessings”. TRGP promptly dropped 5%. Owners want more cash returned.

Distributable Cash Flow (DCF) is the cash return from existing assets. REIT investors know it as Funds From Operations (FFO), an equivalent measure. Because DCF excludes spending on new projects, it reflects steady-state cash earned before growth initiatives. This is why DCF or FFO are commonly used in evaluating businesses whose returns come from large fixed assets, such as infrastructure and real estate.

Free Cash Flow (FCF) is the net cash generated (or spent) after considering DCF, growth projects and any financings and asset sales (i.e. after everything). It’s common for companies that are investing heavily to have little or negative FCF. Investors in such stocks ultimately expect FCF commensurate with sums invested.

Exploiting the Shale Revolution has boosted growth capex by billions of dollars, both for upstream companies as well as the midstream infrastructure sector. It’s why FCF has substantially lagged DCF in recent years. Although today’s income statements don’t show it, a combination of slowing growth capex and rising DCF will cause pipeline companies to produce vastly more FCF.

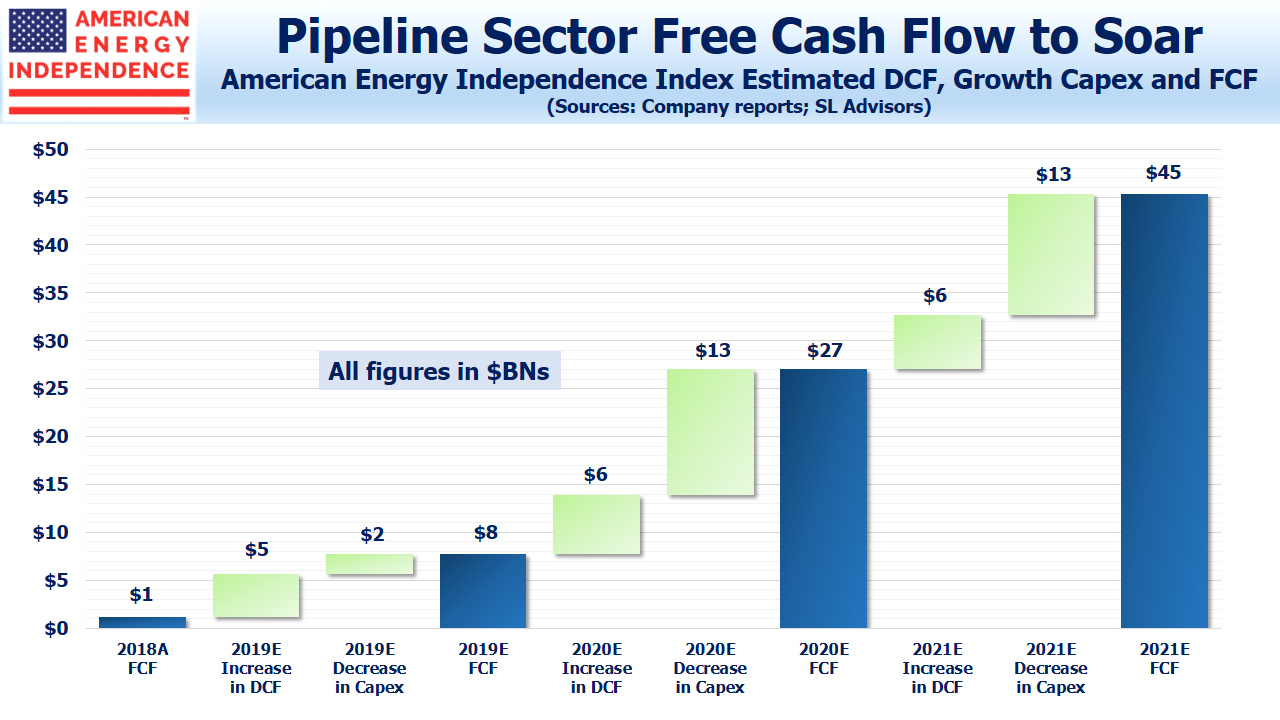
We examined all the names in the American Energy Independence Index (AEITR), which provides broad exposure to North American midstream corporations along with a few MLPs. On a bottom up basis, FCF was just over $1BN last year, a paltry figure given the industry’s $514BN market cap.

The need for growth capital broke the MLP model (see It’s the Distributions, Stupid!). Their narrow set of income-seeking investors wasn’t willing to support the growing secondary offerings of equity without higher yields. Companies needed to find the cash somewhere, so four years of distribution cuts followed – for example, the Alerian MLP ETF (AMLP) has cut its payout by 36% since 2014, reflecting reduced distributions by the names in its index.

The industry is over the hump of its spending on growth projects. Analysts look carefully for “capex creep” whereby annual guidance for new spending gets revised upward during the year. But based on current bottom-up guidance for the AEITR, we expect such spending to be down 4% this year, with >20% reductions in 2020 and 2021.

Recently completed projects are starting to show up in higher DCF, which we estimate will grow by 8% this year and 12% in 2020. A 90% completed pipeline isn’t much use, and multi-year construction projects only generate cash when they’re completed and paid for.

Making more money from existing assets, while spending less on new ones, is a potent combination. By 2021, FCF is set to be close to what DCF was in 2018. Moreover, much of today’s growth is internally funded, meaning little reliance on issuing equity. Based on current guidance, Transcanada (TRP) is the only company likely to tap the equity markets meaningfully, as construction of the perennially delayed Keystone XL gets under way.

As a result, last year’s sector-wide $1BN in FCF is set to jump eightfold this year, more than triple in 2020, and increase by two thirds again in 2021. It’s why dividend growth is back (see Pipeline Dividends Are Heading Up). Our analysis assumed no new debt issuance, which therefore assumes leverage will continue to decline. To the extent that the industry maintains current Debt:EBITDA ratios by issuing more debt, FCF will grow more than our forecast.

The “bridge” chart illustrates annual FCF 2018-21 with the changes in DCF and growth capex forming the bridge from each year’s FCF to the next.

.avia-image-container.av-l5ddml-1cc676b2037a33c8e3a02d4fd89df6ec img.avia_image{ box-shadow:none; } .avia-image-container.av-l5ddml-1cc676b2037a33c8e3a02d4fd89df6ec .av-image-caption-overlay-center{ color:#ffffff; }

Pipeline Sector Free Cash Flow

The Shale Revolution has long been described as a huge boost for America, including on this blog. Investors often complain that it’s been a far better story than an investment. The strong start to the year has been a welcome surprise to many long-suffering holders. And yet, a substantial jump in FCF is still not widely expected. The sector has plenty of upside.

We are invested in TRGP and TRP. We are short AMLP.

SL Advisors is the sub-advisor to the Catalyst MLP & Infrastructure Fund.  To learn more about the Fund,  please click here.

SL Advisors is also the advisor to an ETF (USAIETF.com).


Investors Look Warily at the Persian Gulf

The Shale Revolution has certainly provided America with more geopolitical freedom. The 1973 Arab oil embargo punished the U.S. for supporting Israel, as it fought Egypt and Syria. Shortages of gasoline visibly demonstrated the limits to U.S. actions. As a result, every president since Nixon has called for energy independence.

Swaggering energy dominance is the new goal, since independence has, by some measures, already been achieved. But reduced dependence on imports doesn’t bring immunity from price spikes, given that oil is a global commodity easily moved to the most eager buyer.

A benefit of investing in midstream energy infrastructure that we rarely hype is its domesticity. There are pipelines all over the world, but we stick to North America where property rights and rule of law are secure. Weakness in, say, the Turkish lira is of no concern.

Energy markets today are sanguine, in that there is little risk of disruption priced in. Meanwhile, global crude oil demand is growing at around 1.5 Million Barrels per Day (MMB/D). Saudi Aramco’s recent bond offering disclosed production capacity that’s more limited than many had thought.

Venezuela’s output continues to collapse, with U.S. sanctions kicking a chronically mis-managed economy already on its knees. Libya is on the verge of civil war, placing more output at risk. And now the waivers on Iranian exports are about to be cancelled, with the U.S. stated goal of reducing their oil exports to zero.

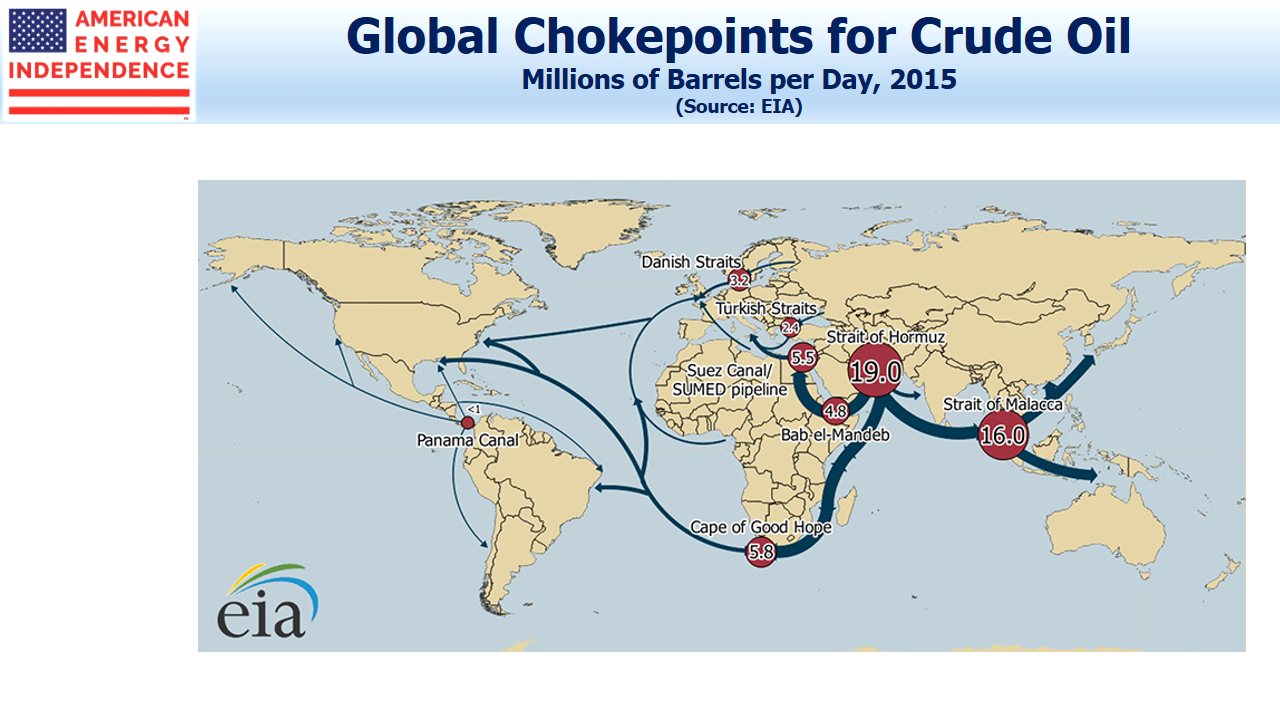
The 1941 U.S. embargo on Japanese imports of oil and gasoline products led within six months to Pearl Harbor. Today’s Iranian sanctions are similarly intended to heap more pressure on the regime. U.S. warships patrol the Strait of Hormuz, assuring the flow of oil from Iran’s neighbors. Conflict is not inevitable and is hardly a viable proposition for Iran’s leaders. Economic pressure may yet induce Iranian change in policy, or even regime. That’s clearly our goal. But a miscalculation, or the conclusion that no good options remain, are possible.

.avia-image-container.av-3ypux2-8b27c2abbee0ed1274141f106988dbae img.avia_image{ box-shadow:none; } .avia-image-container.av-3ypux2-8b27c2abbee0ed1274141f106988dbae .av-image-caption-overlay-center{ color:#ffffff; }

Global Chokepoints for Crude Oil

In The Absent Superpower, Peter Zeihan’s book on the shifting gepolitical balance caused by U.S. shale, he notes, “Iran has a phalanx of varied missile systems that could reach any point within the strait itself, with many of them capable of reaching the Saudi shoreline even across the wider points of the Persian Gulf.”

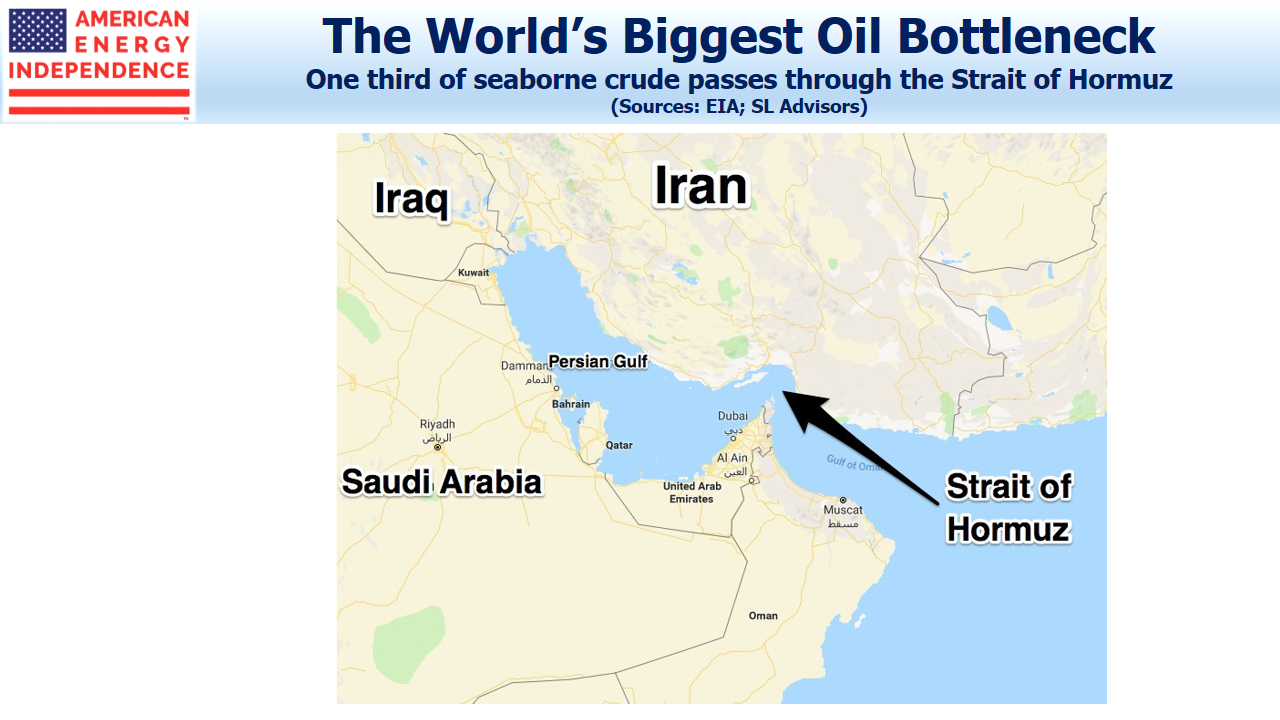
Militarily there’s no doubt about the winner, but oil supplies could still be disrupted. A third of global seaborne crude passes through the Strait of Hormuz. In addition, Qatari exports of Liquified Natural Gas (LNG) account for a third of global LNG trade, with Kuwait importing LNG that travels north through the Strait.

.avia-image-container.av-2jeakm-c499bb3674bbf3e142fd684d1e461707 img.avia_image{ box-shadow:none; } .avia-image-container.av-2jeakm-c499bb3674bbf3e142fd684d1e461707 .av-image-caption-overlay-center{ color:#ffffff; }

Strait of Hormuz

Brent crude exhibits modest backwardation, of around $4 per barrel between June ’19 and June ’20 futures. Conflict with Iran would surely provoke a much bigger jump.

Energy has sunk to around 5% of the S&P500. It’s one of the few sectors (along with Defense) likely to perform well if U.S. military action occurs. Energy stocks, like crude oil, reflect little price premium for geopolitical uncertainty. Through last year pipeline stocks were sufficiently out of favor that their correlation with the S&P500 was sometimes negative. That’s just the relationship a hedge needs with its target portfolio.

Investors who are concerned about increasing geopolitical risks should overweight midstream energy infrastructure. It’s cheap, immune to war damage and provides good protection against Middle East conflict.

SL Advisors is the sub-advisor to the Catalyst MLP & Infrastructure Fund.  To learn more about the Fund,  please click here.

SL Advisors is also the advisor to an ETF (USAIETF.com).


AMLP’s Shrinking Investor Base

The Alerian MLP ETF (AMLP) remains the largest ETF in the sector, in spite of its ruinous tax drag (see MLP Funds Made for Uncle Sam) and long term returns that are less than half of its index. It’s been a commercial success for its promoters but unfortunately, a disastrous investment for many holders.

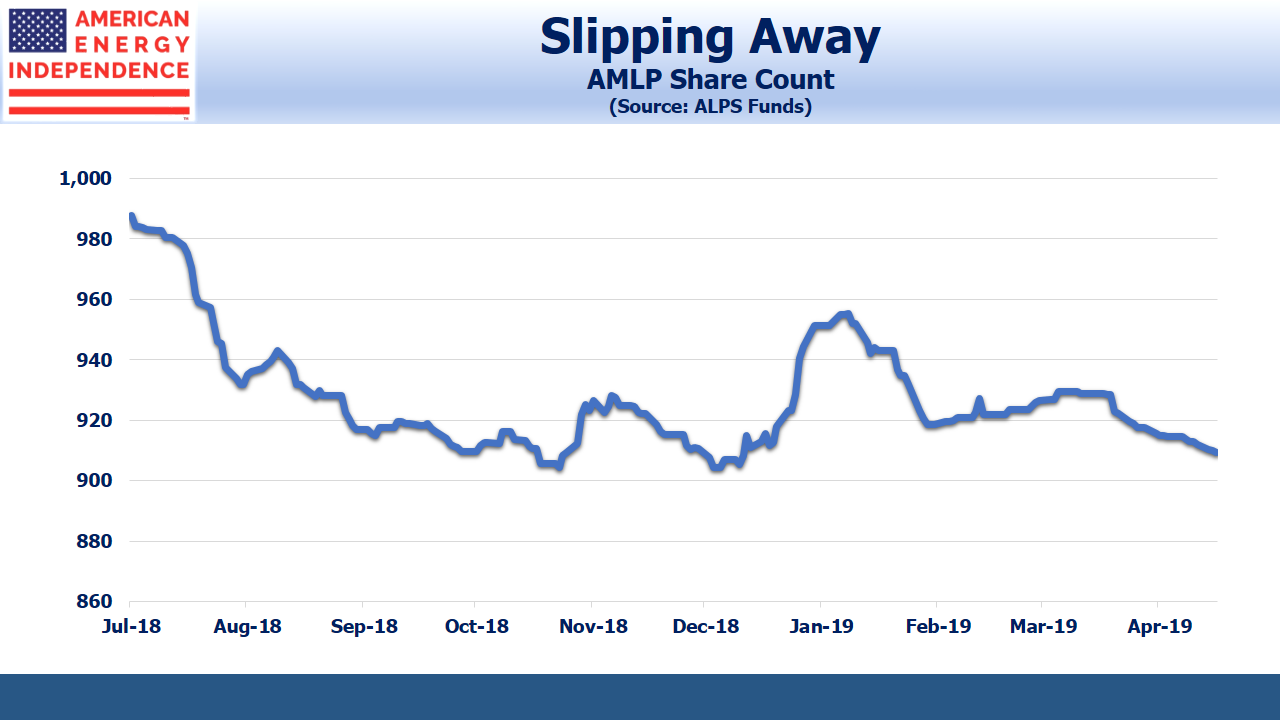
However, there are signs that AMLP’s fan base is slipping. Its share count’s steady growth abruptly stopped last summer. Since then, shares outstanding are down over 8%. Half of that drop has come this year.

.avia-image-container.av-1fggct1-b85730d41fc2945db3d084e9f5c3e8d2 img.avia_image{ box-shadow:none; } .avia-image-container.av-1fggct1-b85730d41fc2945db3d084e9f5c3e8d2 .av-image-caption-overlay-center{ color:#ffffff; }

AMLP Share Count

Midstream energy infrastructure has been a frustrating sector to be sure, and to some degree AMLP flows reflect broader investor sentiment. Through 2014 assets grew, and even during the 2014-16 energy collapse AMLP’s share count increased.

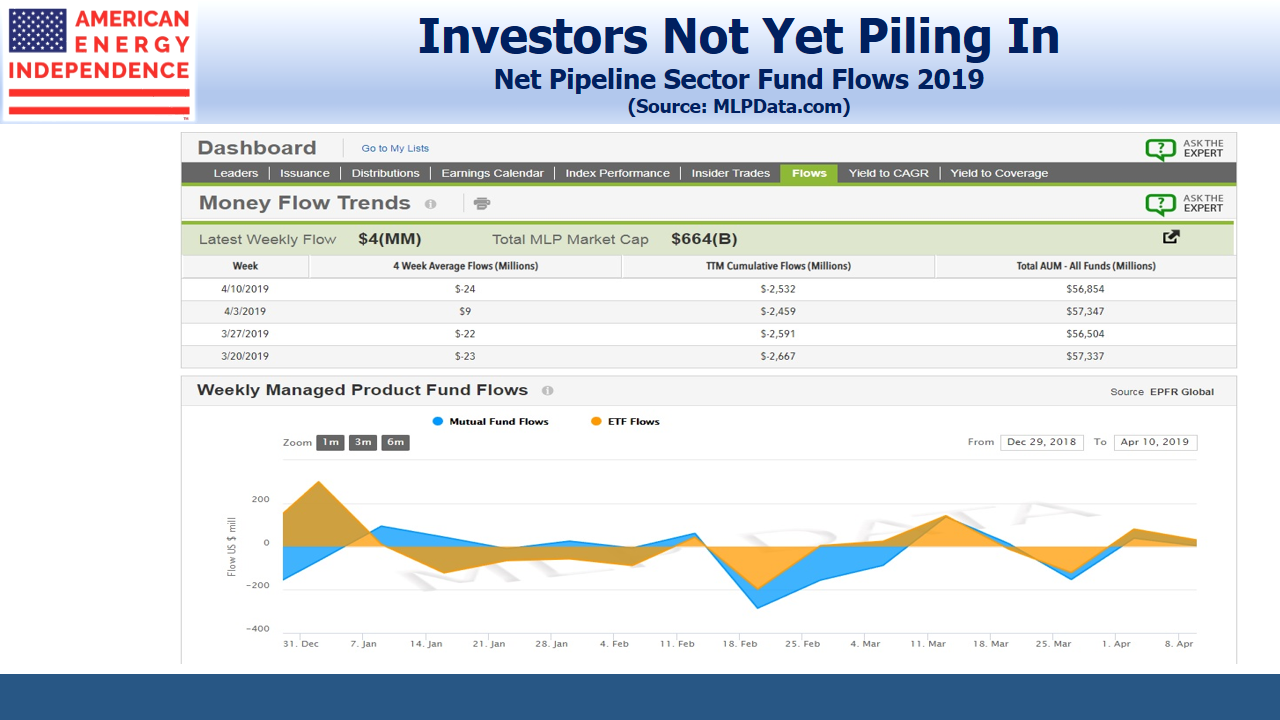
But since last summer, there’s increasing evidence of lost market share. Figures from JPMorgan show AMLP experienced 2H18 outflows of $942MM, a disproportionate share of the sector’s $2.9BN outflows during that period.

Market direction doesn’t seem to make much difference. Last year’s outflows coincided with sector weakness, but outflows have continued this year even though midstream energy infrastructure has been a leading market performer. AMLP’s 2019 outflows have roughly cancelled out inflows to other funds.

.avia-image-container.av-15go3xx-82a7a454b92c7eca3e39f2c81ba342a6 img.avia_image{ box-shadow:none; } .avia-image-container.av-15go3xx-82a7a454b92c7eca3e39f2c81ba342a6 .av-image-caption-overlay-center{ color:#ffffff; }

Back in 2010 when AMLP was launched, there was clearly investor demand for MLP exposure that avoided K-1s. The corporate tax drag meant AMLP, an index fund, could never come close to matching its index. Buyers overlooked or were unaware of this weakness.

Much has changed over the years. MLPs used to be synonymous with pipelines, but the limited investor base has led many large companies to convert to corporations. Today, North American midstream energy infrastructure is two thirds corporations by market cap (see Pipelines’ New Look).

The MLP structure remains tax-efficient, but its income-seeking investor base has proven to be a fickle source of equity capital. So those MLPs that remain, such as Enterprise Products Partners (EPD), do so because they don’t need to issue equity. There were no MLP IPOs in 2018. Blackstone recently announced plans to convert from a partnership to a corporation, concluding that the K-1s were not worth the trouble.

The shrinking pool of MLPs reflects this change (see Are MLPs Going Away?). AMLP’s 100% MLP exposure omits many of the biggest pipeline corporations.

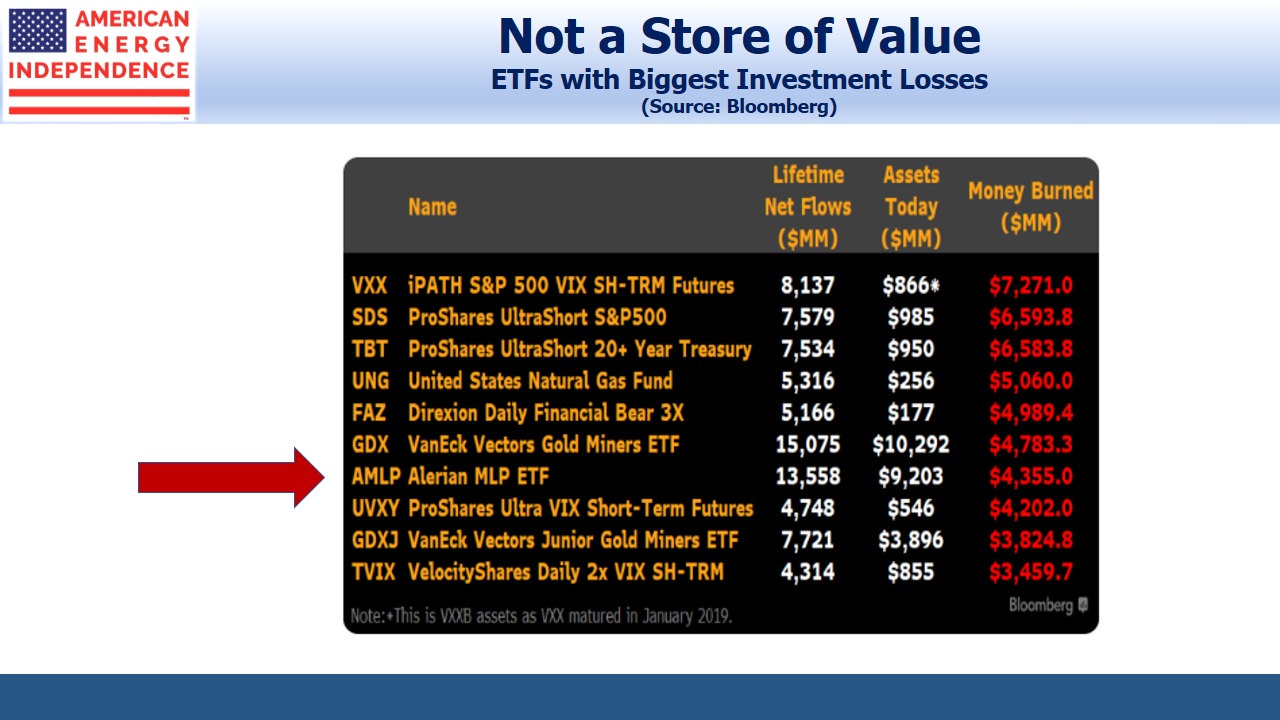
AMLP also holds an ignominious position on the Top Ten “Money Burned” ETFs posted on Twitter recently. The sector’s poor performance has a lot to do with this, but the corporate tax drag on top of poor results was enough to gain AMLP entry to the list.

.avia-image-container.av-tvujbp-ad8b6c7b56554e37cc50222751435185 img.avia_image{ box-shadow:none; } .avia-image-container.av-tvujbp-ad8b6c7b56554e37cc50222751435185 .av-image-caption-overlay-center{ color:#ffffff; }

The steady erosion of AMLP’s investor base suggests that investors are starting to acknowledge the ruinous tax drag and the switch away from MLPs to corporations.

Since AMLP holders are deciding to exit, it suggests that MLP prices will continue to experience downward pressure relative to corporations, a trend that has been well established this year. The sector is cheap, but broad energy infrastructure exposure that includes corporations will continue to deliver better results than a narrow, MLP-only approach. AMLP owners should sell, probably taking a tax loss, and move into a more diversified product.

Regular readers will be familiar with our blog posts on the topic, and so now are many investors.


We are invested in EPD and short AMLP.

SL Advisors is the sub-advisor to the Catalyst MLP & Infrastructure Fund.  To learn more about the Fund,  please click here.

SL Advisors is also the advisor to an ETF (USAIETF.com).


Chevron Writes Shale’s Next Chapter

In the 1990s U.S. bankers were consolidating. My own career spans several bank mergers. Manufacturers Hanover merged with Chemical Bank in 1992, followed by Chase Manhattan in 1996 and JPMorgan in 2000. Other smaller deals occurred along the way, such as Hambrecht & Quist in 1999, and  Robert Fleming in 2000.

I remember then-CEO of Chemical Bank, Bill Harrison, discussing the inevitable consolidation of the banking industry, and how he had a team that was constantly evaluating the synergies of potential combinations. Relative pricing was an important consideration. Weakness in one bank’s stock could attract others who had already assessed a potential fit. Harrison had a mixed record at mergers until the combination with JPMorgan led to Jamie Dimon eventually running the company. Bill’s final deal left investors in good hands.

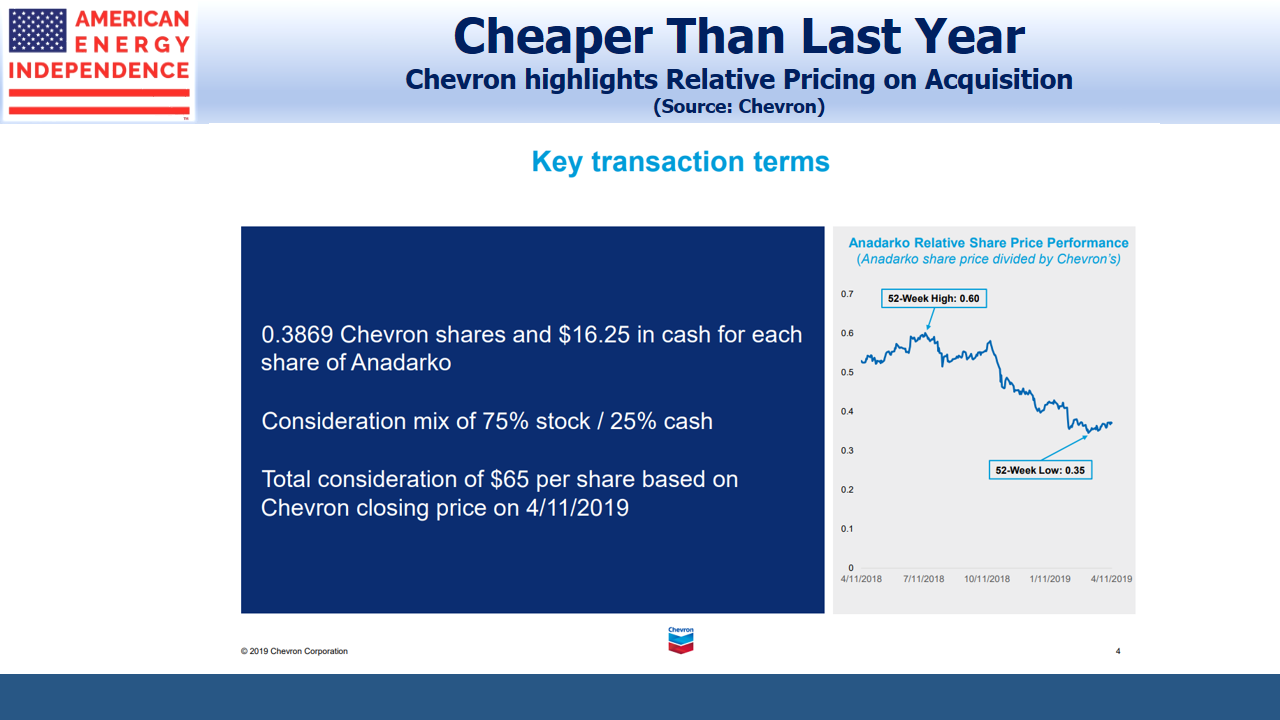
Chevron’s (CVX) acquisition of Anadarko (APC) last week reminded me of this. The relative pricing chart that CVX CEO Mike Wirth used in Friday’s call provided a useful insight into how they approached the deal.

.avia-image-container.av-n8mkfx-9942c071e26709942abc0e10a830c3e7 img.avia_image{ box-shadow:none; } .avia-image-container.av-n8mkfx-9942c071e26709942abc0e10a830c3e7 .av-image-caption-overlay-center{ color:#ffffff; }

Chevron Anadarko Acquisition Relative Pricing

Over the past year, stock prices for the integrated oil companies (IOCs) have outperformed the independent U.S. shale drillers. In terms of CVX’s currency (its stock), APC became cheaper. In effect, the market was pushing for this deal, by steadily improving its attractiveness to CVX. Investors want the world’s biggest companies managing shale oil and gas output.

It wasn’t always this way. In the early days of the Shale Revolution, independent companies like Pioneer Resources (PXD), EOG and others led the way. They had a willingness to experiment with different approaches while the industry sought the most effective techniques to unlock this new resource. Observers felt at the time that IOCs were poorly suited to the type of constant disruptive innovation at which smaller companies can excel.

Recognizing the unconventional thinking required to exploit this unconventional resource, huge companies like Royal Dutch Shell (RDS) created new divisions with considerable autonomy to innovate. It echoed the “skunkworks” popularized by Clayton Christensen in The Innovators Dilemma. His premise was that big companies were too often so invested in their existing products and processes that they were unable to see the threat posed by more nimble innovators. And in the early years of the Shale Revolution, IOCs were generally absent because unconventional plays didn’t fit their conventional thinking.

Frequent failures with their associated learning curve were protected from the centrally-imposed financial discipline that usually prevails. RDS enjoyed sufficient success with this approach that they applied some of the lessons across the company.

The CVX/APC deal highlights how things have changed. IOCs are no longer focused on trying to act like a small company practicing rapid innovation. Instead, they’re applying the scale and efficiencies of a big company to drilling techniques that are now well established. It’s the next stage in the Shale Revolution.

Equity markets accelerated this development, by assigning higher valuations to larger companies versus independents. CVX exploited this in their APC acquisition. It’s likely to spur consideration of other match-ups. Pipeline customers will be increasingly well-capitalized with properly funded, long term production plans. This should only be good news for investors in midstream energy infrastructure.

SL Advisors is the sub-advisor to the Catalyst MLP & Infrastructure Fund.  To learn more about the Fund,  please click here.

SL Advisors is also the advisor to an ETF (USAIETF.com).


Shale Cycles Faster, Boosting Returns

Chevron (CVX) CEO Mike Wirth must have used the term “short-cycle” at least half a dozen times on Friday’s conference call discussing their $33BN acquisition of Anadarko (APC). It’s a feature of the Shale Revolution that’s still unappreciated by investors, even while it’s highly valued by upstream companies. A faster capital cycle boosts returns.

The U.S. Shale Revolution has upended global energy markets, and not only because of cheap, new supply. which is already turning America in to the world’s biggest exporter of hydrocarbons. A decade ago Cheniere (LNG) was building facilities to import natural gas, and energy independence was a pipedream.

Conventional oil and gas projects used to require many $BNs in upfront capital, with a payback over a decade or more. Global GDP growth, production costs and future demand all have to be considered before a final investment decision is made. Climate change and public policy response have added to long term uncertainty for an already cyclical business.

The power of shale extraction is that capital spend is spread out and cash returns come sooner. It costs less than $10MM to drill a well, and in America we drill thousands every year. The high initial production and sharp decline rates return capital invested far more quickly. Output can be hedged because the 2-3 year liquidity of futures aligns with the cashflow cycle of shale far better than with conventional projects. If oil falls, drilling slows. It’s just less risky, which is why investment dollars continue to flow into North America.

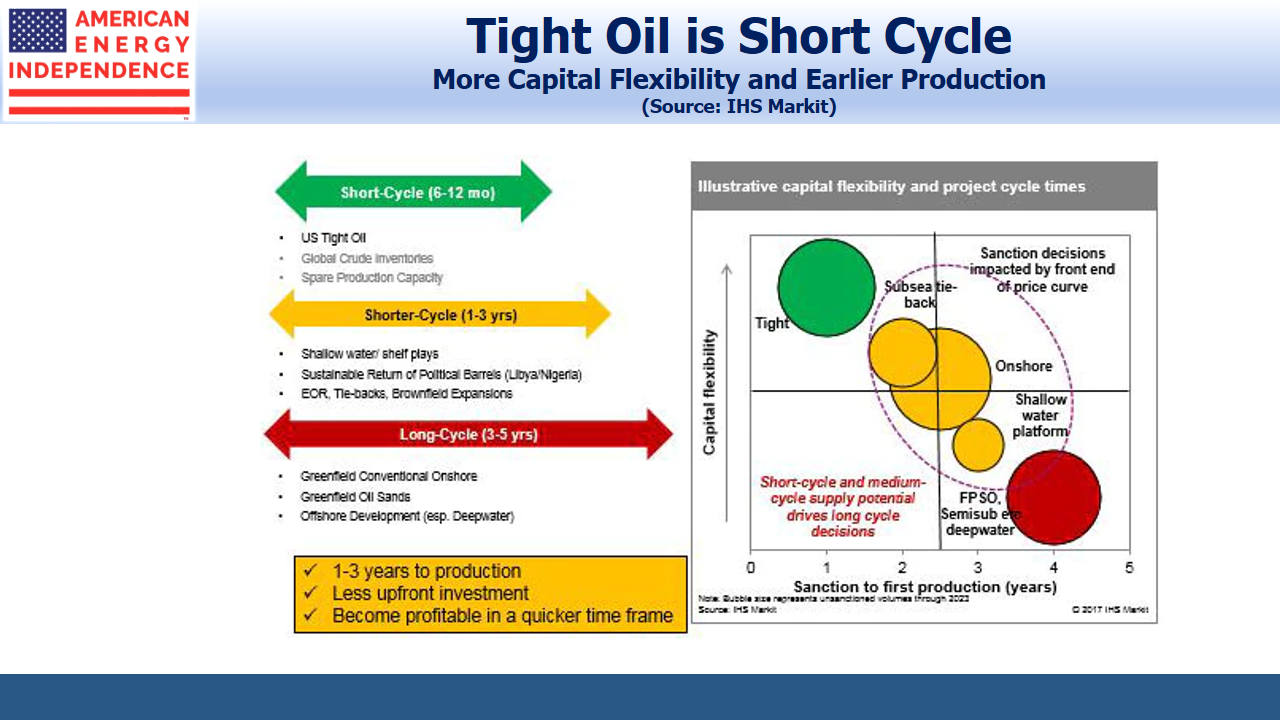
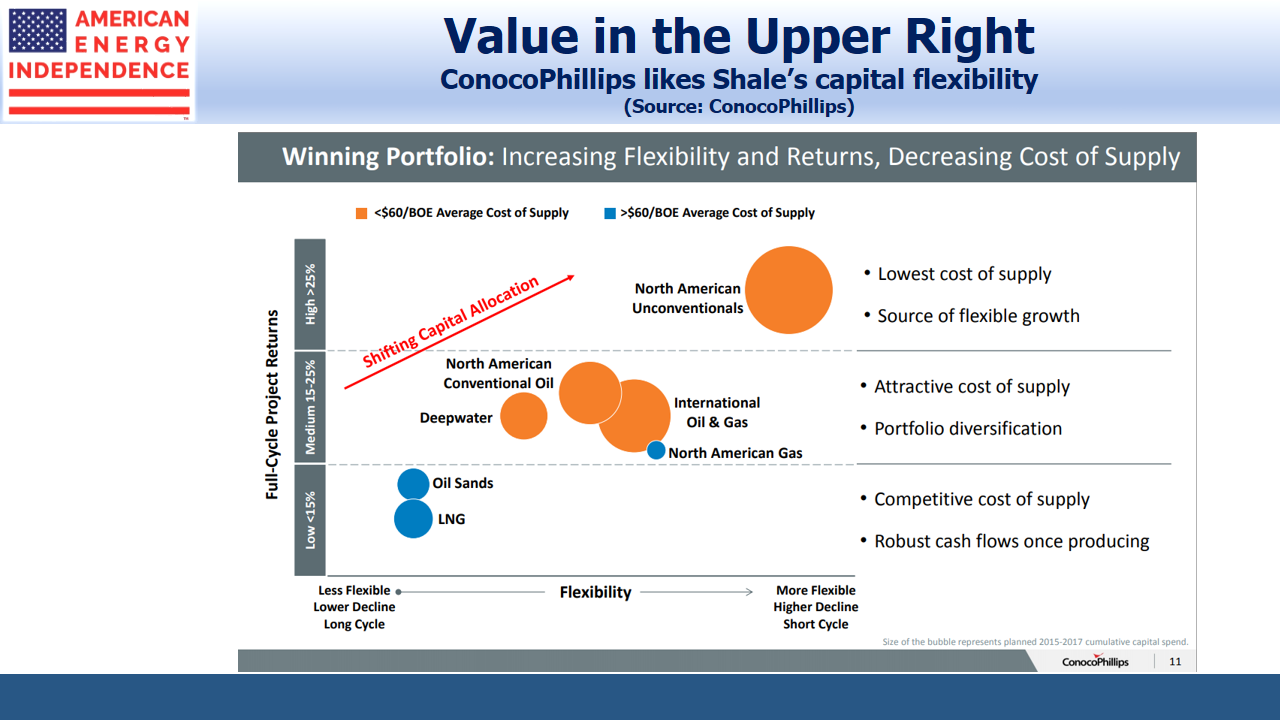
CVX isn’t alone in recognizing this. ConocoPhillips (COP) places U.S. unconventional, or tight (as shale is often called) in the upper right of a chart with the best combination of capital flexibility and returns.

.avia-image-container.av-26j0sw9-2dc3d7e788068a42283771042a1ed56e img.avia_image{ box-shadow:none; } .avia-image-container.av-26j0sw9-2dc3d7e788068a42283771042a1ed56e .av-image-caption-overlay-center{ color:#ffffff; }

Shales Capital Flexibility

This chart from IHS Markit links high capital flexibility with fast initial production.

.avia-image-container.av-1key3xl-95a16c0a7b9467b47752e3bf76687fdf img.avia_image{ box-shadow:none; } .avia-image-container.av-1key3xl-95a16c0a7b9467b47752e3bf76687fdf .av-image-caption-overlay-center{ color:#ffffff; }

Tight Oil is Short Cycle

We have often commented on this aspect of growing domestic oil and gas output. See our short video America’s Energy Renaissance: The Short Cycle Advantage of Shale and a piece in Forbes The Short Cycle Advantage Of Shale.

Conventional projects are becoming much smaller. North America, which offers substantial short cycle opportunities, continues to draw investment. The result is that America is gaining share in the world’s energy markets. This is likely to remain the case in almost any scenario, because of shale’s lower risk profile.  Wirth went so far as to highlight that not only is shale among some of the highest return projects in their portfolio, but it’s also among the lowest risk both below and above the ground.

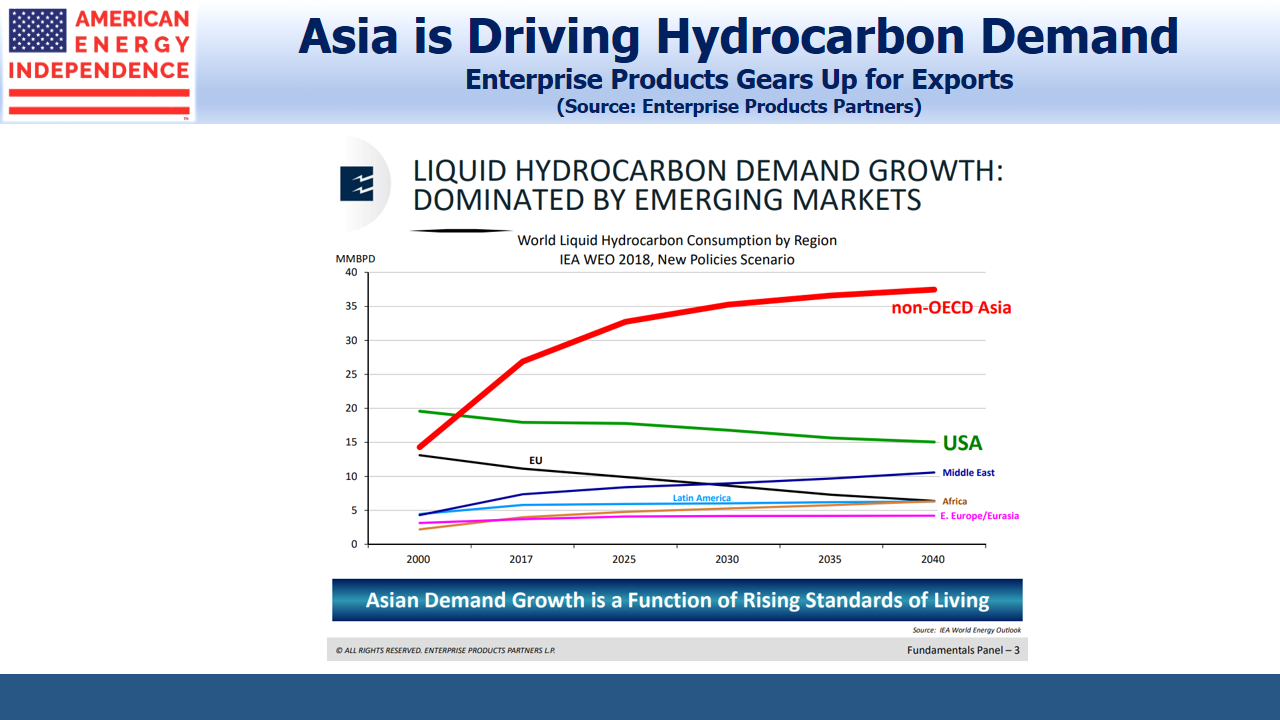
A slide from Enterprise Products Partners’ recent investor day highlights strong growth in Asia over the next couple of decades.

.avia-image-container.av-153t58p-798c45dd0dbff25b0d630956e8f119fa img.avia_image{ box-shadow:none; } .avia-image-container.av-153t58p-798c45dd0dbff25b0d630956e8f119fa .av-image-caption-overlay-center{ color:#ffffff; }

Asia is Driving Hydrocarbon Demand

For pipeline owners, this is enormously positive. North American upstream companies are our customers. The Shale Revolution has plenty of critics who argue that Wall Street continues to provide capital, illogically, to unprofitable activities. And yet well informed investors such as CVX are concluding it’s a very attractive place to be. Last year ExxonMobil (XOM) announced plans to invest $50BN in North America over the next five years. CVX was already planning 900 thousand barrels a day of oil production by 2023 in the Permian before the APC acquisition. XOM expects to produce a million barrels per day there. These companies bring scale and stability, which makes them the most attractive customers possible for midstream energy infrastructure.

This was also positive for Western Midstream Partners (WES), since their business with APC is now likely to grow substantially. In response to a question about its new MLP, Wirth pointed to the Waha basis spread, which is negative, meaning producers are paying to get rid of their natural gas. He noted the importance of offtake and high quality midstream infrastructure, and clarified that WES was a strategic asset for them.

CVX is taking advantage of relative weakness in APC’s stock price compared with their own. Nine months ago they would have had to offer almost twice as big a premium. There were also reports that Occidental Petroleum (OXY) had offered APC $5 per share more, but that CVX’s offer was preferred because it’s regarded as a better partner.

.avia-image-container.av-tz29yh-b4f6f188d828fb4ba88dddfaf106b83d img.avia_image{ box-shadow:none; } .avia-image-container.av-tz29yh-b4f6f188d828fb4ba88dddfaf106b83d .av-image-caption-overlay-center{ color:#ffffff; }

Chevron Anadarko Acquisition Relative Pricing

The bottom line is that the CVX/APC deal is great news for midstream energy infrastructure. CVX’s lower cost of capital and merger synergies can only lead to higher oil and gas production than would otherwise have been the case. Pipeline stocks are poised for a significant rally. Over four years of weakness have led to distributable cash flow yields above 10% that are growing 10-15%. Dividends are rising for the first time since 2014. The sector remains over 30% below its all-time high, even while the S&P500 flirts with a new record. CVX provided further affirmation of the enduring value in U.S. unconventional production.

We are invested in EPD and WES.

SL Advisors is the sub-advisor to the Catalyst MLP & Infrastructure Fund.  To learn more about the Fund,  please click here.

SL Advisors is also the advisor to an ETF (USAIETF.com).


Enlink CEO Talks Strategy

Sharply higher commodity prices shouldn’t be a major source of concern for pipeline investors. But that was the answer Enlink (ENLC) President and CEO Michael Garberding gave to a question we’re often asked – what could go wrong. His reason was that it would induce midstream infrastructure to add excess capacity. “Our industry has shown it knows how to overbuild” was heard more than once during a recent investor dinner hosted by MUFG Securities. This set the tone for the evening’s conversation. Adrianne Griffin, Director of Investor Relations and whom we interviewed last year (see Discussing the Shale Revolution with Enlink Midstream), smoothly guided Mike to expand on issues of most interest.

.avia-image-container.av-rkqf60-f5b8af38bec40866c865bee065dc3bb3 img.avia_image{ box-shadow:none; } .avia-image-container.av-rkqf60-f5b8af38bec40866c865bee065dc3bb3 .av-image-caption-overlay-center{ color:#ffffff; }

Enlink Midstream

Promoting the CFO to CEO doesn’t always guarantee a culture of financial discipline. For example, Kinder Morgan’s distribution cuts and taxing simplification, all to support their growth plans, took place while President Kimberly Dang was CFO. But we felt Mike Garberding had a good grasp of the company’s financial profile when he held that role, and hope to see it woven more fully into Enlink’s culture.

Any discussion with energy sector management is likely to cover the spread between cost of capital and project returns, prudent leverage and improved returns to shareholders. This dinner was no exception. ENLC expects their $1.2-1.5BN in growth capex to generate $250MM in annual EBITDA when completed, an attractive 5-6X build multiple if they achieve it.

Last year Devon Energy (DVN) sold their Enlink interest to Global Infrastructure Partners (GIP), and then Enlink consolidated their GP and MLP into a single LLC entity that is taxed as a corporation. Given ENLC’s current valuation and attractive projects, you might think GIP would want to buy the whole company, with the substantial pool of private equity dedicated to infrastructure investments. GIP’s role remains something of a mystery. Garberding noted that they were “very aligned with GIP” and that “they give us huge strategic advantages”. But specifics are few, and one investor asked when the benefits of GIP’s strategic role would become clearer. More detail would be welcome. Mike noted that there had been little opportunity to provide more clarity since last summer’s deal, given the just completed simplification. Hopefully, we’ll learn more in the future.

Another investor asked whether ENLC would sell their Barnett shale assets to a potential acquirer of DVN’s acreage, if the buyer was seeking more vertical integration. This was thought unlikely (though “every asset has a sale price”), and Garberding noted that if the new owner adds one more rig that would double the rig count on a play that requires very little annual capital, albeit with output currently declining 4-5% annually.

Upstream customers seem to be showing more stability – ENLC expects rig counts to be maintained across a wider range of oil and gas prices than in the past, which probably speaks to improving balance sheets across the energy sector. Drillers are showing, “a better capability to live within their cashflows.” It’s why he believes gathering and processing businesses are less risky than sometimes believed.

Vertical integration increases the number of opportunities to earn a fee from a molecule, and ENLC regards that as a critical means of competing with bigger firms such as Plains All American (PAGP) and Enterprise Products Partners (EPD), both of whom offer integrated solutions. Providing shippers with optionality and affording customers a choice of where to direct their output to maximize profits remains a key focus.

Connecting with other networks adds choices, and ENLC does this extensively with Oneok’s (OKE), for whom they are a top five customer.

CFO Eric Batchelder was jokingly referred to as the “C-F-No” as if to emphasize C-suite financial discipline. There was an interesting exchange on the balance between returning cash to shareholders via buyback versus distribution growth. The 9% yield on ENLC’s equity suggests that too few investors are attracted to the stock, and therefore a planned 5% increase in payout is unlikely to entice them. Some investors, including ourselves, would prefer that excess cash be returned through buybacks. Since buybacks reduce the sharecount, there’s the added benefit of raising coverage on the dividend

However, Batchelder noted that opinions varied and a significant number of long-time holders still favor dividend growth. ENLC reports fairly low investor turnover in the past couple of years, and clearly a great many original MLP holders (i.e. older, wealthy Americans) have retained their holdings. We think if ENLC investors fully understood the improving coverage inherent in buybacks, they’d prefer them to an increased payout.

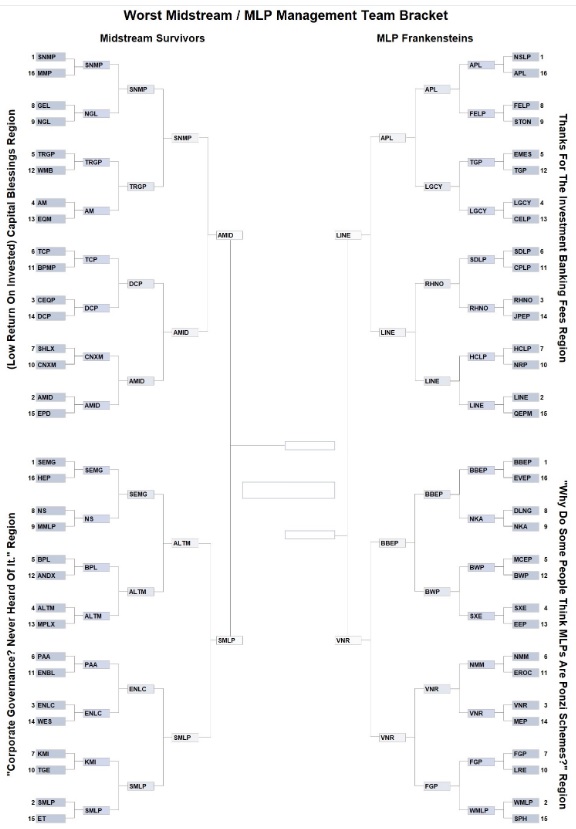
An anonymous Twitter contributor well-versed in the capital mis-steps of the sector ran a hilarious NCAA-style tournament of pipeline stocks, which was still ongoing at the time of our dinner (see MLP Humor — A Target-Rich Environment). Voters determined the result of each match-up, based on which visited the more egregious abuse on investors. This was a brief topic of conversation. ENLC progressed through the first two rounds, and must have been relieved to have been eliminated at the “Sour Sixteen” stage.

ENLC is an overweight long position across our portfolios. It’s cheap, with good growth prospects and we like the management. Dinner reaffirmed our conviction.

We are invested in ENLC, EPD, OKE and PAGP.

SL Advisors is the sub-advisor to the Catalyst MLP & Infrastructure Fund.  To learn more about the Fund,  please click here.

SL Advisors is also the advisor to an ETF (USAIETF.com).


MLP Humor — A Target-Rich Environment

Humor can be a most effective weapon against your adversaries, especially when more extreme measures are unavailable.  MLP management teams have made many poor capital allocation decisions in recent years, providing a rich source of material for an observer armed with both wit and a deep knowledge of the sector’s history. On Twitter, such a combination exists in the anonymous Mr. Skilling, who has been aiming rapier-like thrusts at many of the industry’s worst offenders, to hilarious effect.

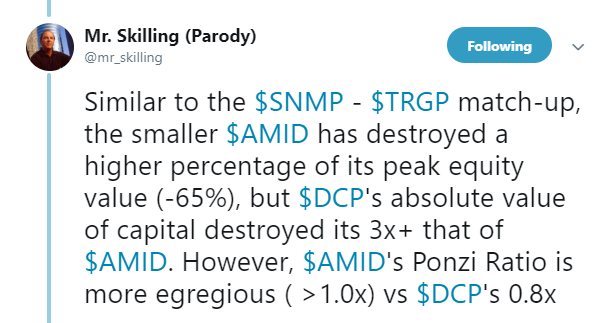
Inspired by the NCAA basketball bracket, he constructed a 64-team equivalent for present and past MLP managements. The winner of each match-up was decided by votes, with Mr. Skilling helpfully providing recent form, such as “total equity value destroyed”, number of distribution cuts, and the priceless “Ponzi Ratio” (equity raised divided by distributions paid out). This is one competition nobody wants to win, and any progress through the tourney presents an investor relations challenge.

Competitors were assigned to four regions, with names like “Corporate Governance? Never Heard Of It”. They were seeded, with the top seeds being assigned to the worst offenders. Perhaps this will lead to a new due diligence question (“What’s the highest seeded holding in your portfolio?”).

Prior to each match-up, Tweeted commentary set the stage.

.avia-image-container.av-5v09vz-dd7097c4988fcec7f8ab18ef8daf256d img.avia_image{ box-shadow:none; } .avia-image-container.av-5v09vz-dd7097c4988fcec7f8ab18ef8daf256d .av-image-caption-overlay-center{ color:#ffffff; }

$AMID

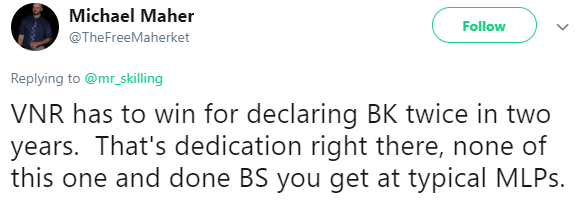
Some companies had achieved a head start by already going bankrupt – and Vanguard Natural Resources’ two bankruptcies gave them a clear edge.

.avia-image-container.av-2vf8vj-06696cbc05f9bf6dffd75449a8360975 img.avia_image{ box-shadow:none; } .avia-image-container.av-2vf8vj-06696cbc05f9bf6dffd75449a8360975 .av-image-caption-overlay-center{ color:#ffffff; }

$VNR

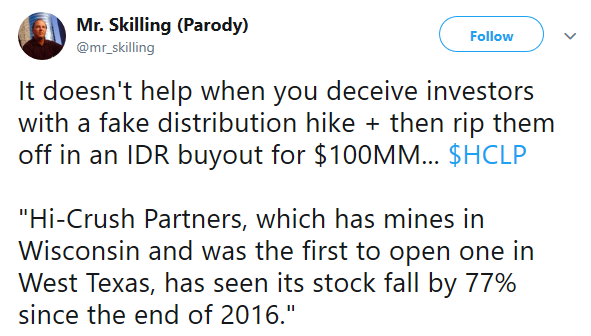
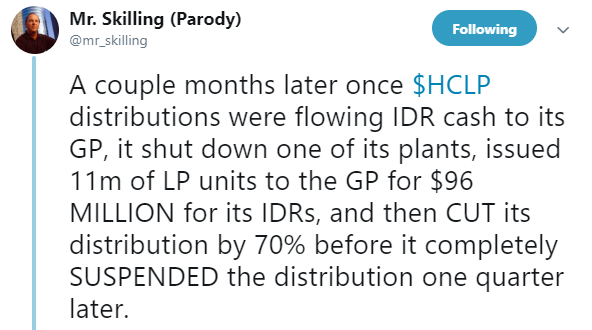
HiCrush (HCLP) showed an exquisite touch in fleecing their investors. They temporarily raised their distribution to an unsustainable level which threw off increased Incentive Distribution Rights (IDR) payments to the General Partner (GP). These IDR’s were then cancelled in exchange for new equity issued to the GP, before the distribution was then slashed.

.avia-image-container.av-26c467j-25940d6c40c2613ab851b809e041e5cd img.avia_image{ box-shadow:none; } .avia-image-container.av-26c467j-25940d6c40c2613ab851b809e041e5cd .av-image-caption-overlay-center{ color:#ffffff; }

$HCLP IDR takeout abuse

.avia-image-container.av-1ho6alr-7841b41ad68d6fec0ff743a3420a8a5d img.avia_image{ box-shadow:none; } .avia-image-container.av-1ho6alr-7841b41ad68d6fec0ff743a3420a8a5d .av-image-caption-overlay-center{ color:#ffffff; }

$HCLP

.avia-image-container.av-pgl2wf-e0ee4f31705bfe93c740815e9a711558 img.avia_image{ box-shadow:none; } .avia-image-container.av-pgl2wf-e0ee4f31705bfe93c740815e9a711558 .av-image-caption-overlay-center{ color:#ffffff; }

$HCLP IDR Buyout

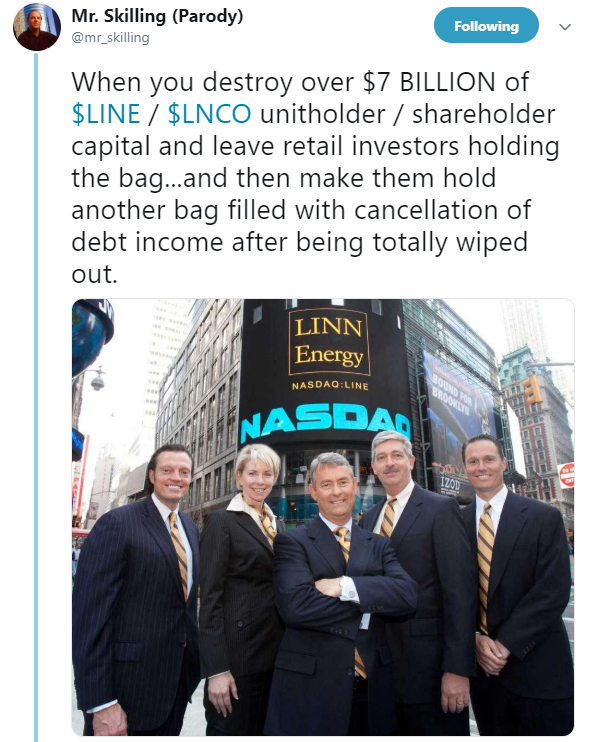
Such a record would seem to be unassailable, but Linn Energy’s bankruptcy provided unanswerable competition by saddling their investors with an additional taxable gain for debt forgiveness on top of their worthless LP units.

.avia-image-container.av-16x03wv-2405f24d67e3ea9d841f317910ca754a img.avia_image{ box-shadow:none; } .avia-image-container.av-16x03wv-2405f24d67e3ea9d841f317910ca754a .av-image-caption-overlay-center{ color:#ffffff; }

$LINE

Failed companies should dominate such a tournament, but Targa Resources (TRGP) progressed to the “Sour Sixteen”, propelled by repeated poor investment decisions led by CEO Joe Bob Perkins of the now infamous “capital blessings” comment.

Mr. Skilling spares few, including Alerian who inducted Energy Transfer CEO Kelcy Warren into their Hall of Fame.

.avia-image-container.av-1avtzxr-fc1d1b0c661d6a1a877fea820ebed41b img.avia_image{ box-shadow:none; } .avia-image-container.av-1avtzxr-fc1d1b0c661d6a1a877fea820ebed41b .av-image-caption-overlay-center{ color:#ffffff; }

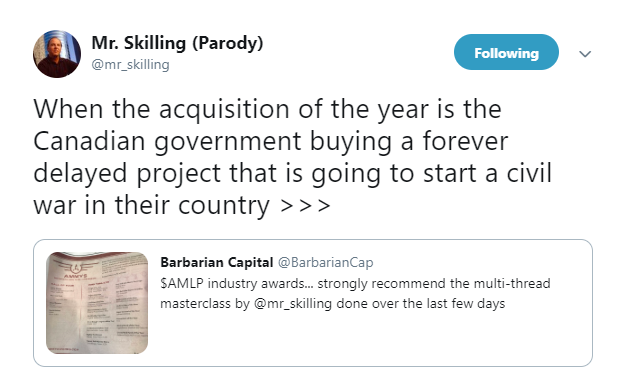
Kinder Morgan’s sale of their TransMountain Expansion also won an award for best acquisition, although there’s little doubt the Canadian taxpayer got the worse end of the deal.

.avia-image-container.av-jlvrwv-97f04a6f180469268d17b13b8c20d03e img.avia_image{ box-shadow:none; } .avia-image-container.av-jlvrwv-97f04a6f180469268d17b13b8c20d03e .av-image-caption-overlay-center{ color:#ffffff; }

Trans Mountain Pipeline

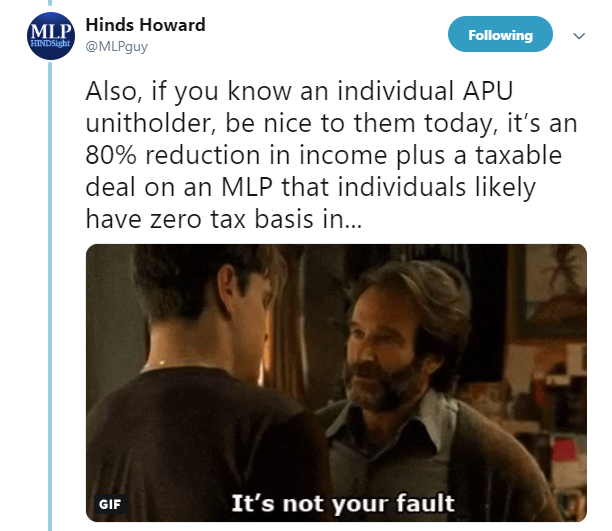
Hinds Howard, who follows the sector for CBRE Clarion Securities, was inspired to add this little gem.

.avia-image-container.av-mavacv-e5285c9bb5497ddc996f63a3473f09eb img.avia_image{ box-shadow:none; } .avia-image-container.av-mavacv-e5285c9bb5497ddc996f63a3473f09eb .av-image-caption-overlay-center{ color:#ffffff; }

The humor is biting, and entertaining if you’re not financially scarred by the miscreants. But beyond the hilarity there are a couple of takeaways. The traditional MLP-GP structure, under which MLP investors endured weak governance rights and paid IDRs to the GP, has always looked to us like the relationship between a hedge fund and the hedge fund manager.

It’s widely accepted that hedge fund investors have done poorly (see The Hedge Fund Mirage). This recognition is why we have long favored the GP versus the MLP, although few such situations remain. It’s also why we don’t invest in any MLP that’s paying IDRs. Our portfolios haven’t avoided poor stewards of capital, but in always being aligned with management we have sidestepped the worst examples listed above.

The other point is that the industry has changed substantially. Simplifications have removed the GP’s ability to direct their MLP into dilutive projects while increasing IDRs. Governance has improved with the conversion of many large MLPs into corporations. Projects are increasingly self-financed and leverage is coming down.

The sheer quantity of episodes of investor abuse reflect the opprobrium so widely earned, and yet reputations lag reality on the way down as well as on the way back up. Depressed valuations reflect the past, far more than the future of sharply growing cashflows.

Mr. Skilling worries that, “…the same clowns that destroyed value are still running these companies” but is “…more positive on the space now that most IDRs have been killed off.”

Investors who learn from past mistakes, amply displayed on Twitter, can exploit a sector still priced for the misdeeds of old while positioned for a much better future.

The final is on Monday, April 8th. Make your voice heard by voting.

.avia-image-container.av-a4mdr-8417b7457e3e2ce2d871b450e75d8350 img.avia_image{ box-shadow:none; } .avia-image-container.av-a4mdr-8417b7457e3e2ce2d871b450e75d8350 .av-image-caption-overlay-center{ color:#ffffff; }

We are invested in ET, KMI, TRGP. We are short AMLP.

SL Advisors is the sub-advisor to the Catalyst MLP & Infrastructure Fund.  To learn more about the Fund,  please click here.

SL Advisors is also the advisor to an ETF (USAIETF.com).


Blinded By The Bonds

.avia-image-container.av-o5hoxd-b5439a9a04335976beced74869fc41a7 img.avia_image{ box-shadow:none; } .avia-image-container.av-o5hoxd-b5439a9a04335976beced74869fc41a7 .av-image-caption-overlay-center{ color:#ffffff; }

German 30 year bunds yield 0.6%. Investors are inured to insultingly low yields, but somehow this still shocks. The ECB defines price stability as inflation “…below, but close to, 2% over the medium term.” Assuming it averages 1.5%, investors are accepting a negative real return virtually in perpetuity.

French energy company Total (TOT) issued perpetual bonds at 1.75%, to buyers who are apparently satisfied with never earning a real return on a corporate credit.

Germany’s ten year yields are -0.05%. Could their 30 year bonds one day join them in negative territory? Japan’s ten year yield is -0.08%. U.S. ten year treasury yields of 2.4% are profligate by global standards.

There is some logic to accepting negative returns over the short term. You can only stuff so much currency under the mattress. But the point of investing is to preserve purchasing power. Somehow, bond investors have become trapped by inflexible thinking into self-destructive actions on a vast scale.

Asset allocations that rely on a split between equities and fixed income persist in maintaining some bond exposure even while loss of purchasing power is guaranteed. Clearly, tens of billions of dollars in assets has accepted this. The stewards of this capital retain a rigid adherence to portfolio diversification. Since falling yields have supported positive returns on bonds through capital appreciation, maintaining bond exposure hasn’t caused visible losses, for now.

Perhaps there’s a principal-agent problem here. The certain knowledge that an investment will lose money should cause an investor to change her selection. Self-evidently, if the purpose of saving is to consume tomorrow, when you know your purchasing power will be lower, perhaps you should consume more today and not save as much. If your career is buying bonds for clients, you’re unlikely to promote radical thinking.

The Equity Risk Premium favors stocks over bonds. This is true even though S&P500 2019 consensus earnings forecasts are being revised down. The current $168 forecast is down $10 since October, and puts the market’s P/E at around 17. But bond yields have also fallen, which has maintained equities’ relative attraction.

.avia-image-container.av-mp9z69-af0504a6afe016d05b8d37efcf220ca1 img.avia_image{ box-shadow:none; } .avia-image-container.av-mp9z69-af0504a6afe016d05b8d37efcf220ca1 .av-image-caption-overlay-center{ color:#ffffff; }

We’ve often illustrated the wide spread between the earnings yield on the S&P500 and bond yields by showing how little money invested in stocks could generate the same return as $100 in ten year treasury securities. Today, only $15 in the S&P500 would match the return on $100 invested in ten year treasuries at 2.4%, assuming (1) 5% dividend growth (which is the long-term historical average), (2) an unchanged S&P500 yield in ten years, (3) unchanged tax policies, and (4) that the other $85 is invested in a money market fund at an average yield of 1%.

.avia-image-container.av-1837qoh-0708daf1d9dd8c62f1457d13a9abc222 img.avia_image{ box-shadow:none; } .avia-image-container.av-1837qoh-0708daf1d9dd8c62f1457d13a9abc222 .av-image-caption-overlay-center{ color:#ffffff; }

Make your Own Bond Cash and Equity

A German investor fleeing the tyranny of low domestic rates for the U.S. would have to hedge the currency risk, which thanks to the magic of interest rate parity would precisely eliminate the yield advantage. But German stocks yield 3%, a substantial advantage over ten year Bunds.

Bund yields are negative because short term securities are even more negative. Two year German bunds yield  -0.63%. To some degree, investors in long term bunds are fleeing even worse short term yields. The example above using equities and cash to achieve the return on ten year bunds still works though. Assuming cash rates of -1.0% for ten years, a 23/77 split between German stocks and cash would achieve the ten year Bund return of approximately 0%. This assumes no dividend growth, which is a highly conservative assumption and would suggest the DAX finish the decade where it started. Just 2% dividend growth improves equity returns and lowers the split to 14/86.

.avia-image-container.av-p0zitt-6c8fd5fa9c044f892f19f6f3c034f1e0 img.avia_image{ box-shadow:none; } .avia-image-container.av-p0zitt-6c8fd5fa9c044f892f19f6f3c034f1e0 .av-image-caption-overlay-center{ color:#ffffff; }

German Bund Investors

Returning to Total and their perpetual bonds – energy has been a miserable sector and is cheap, as regular readers know. Energy infrastructure offers dividend yields of 6% or more, with distributable cash flow yields above 10%. The buyers of Total’s 1.75% perpetual bonds prefer this to the 5.2% dividend yield on its stock. There’s too much money in bonds struggling to find an adequate return.

Although central banks have been substantial participants in global bond markets since the 2008 financial crisis, plenty of commercial buyers are also investing at current yields. They’re exhibiting a remarkable lack of intellectual flexibility. When returns are certain to leave you poorer, it’s time for some fundamental questions about the purpose of investing. Bond investors will probably have to endure a couple of years of steep losses before making that assessment. By then, the folly of investing in debt at today’s yields will be completely obvious and too late to correct.

SL Advisors is the sub-advisor to the Catalyst MLP & Infrastructure Fund.  To learn more about the Fund,  please click here.

SL Advisors is also the advisor to an ETF (USAIETF.com).


The Quiet Investors in Energy

The S&P Energy sector has delivered the worst returns of eleven sectors for four of the past five years. Reflecting investor disdain, energy is now around 6% of the S&P500, down by half in the past decade. Realizing the full potential of the Shale Revolution has demanded a lot of capital – over $1TN by one estimate. Management teams’ desire to grow has increasingly conflicted with investors’ insistence on greater cash returns. In midstream infrastructure this has been especially acute, with the traditional income-seeking MLP investor enduring multiple distribution cuts to support growth projects.

On Twitter, an anonymous, well informed energy investor created a humorous NCAA-type bracket to identify the most capital-destructive management team among publicly traded energy stocks. Each pairing is resolved through online votes, with the ultimate winner earning a most ignominious title. One comment asked if there was another sector with as wide a gap between management self-perceptions and those of investors.

Yet there’s a class of investor that continues to find energy attractive – private equity.

A recent presentation by S. Wil VanLoh Jr. of Quantum Energy Partners offered a useful perspective.

Public equity investors are repelled by the energy sector’s persistently low free cash flow, with profits too frequently plowed back into new production. By contrast, private equity (PE) funds with their locked up capital are drawn by the internal rates of return, which they find attractive. Their ability to outspend cashflow for several years as projects are developed can’t be matched by their public counterparts, whose investors are sensitive to quarterly earnings. Although this hasn’t led to any significant public companies being taken private, it has led to PE becoming a steadily bigger player in shale. They recognize that the U.S. has already won the shale race against the rest of the world.

.avia-image-container.av-ixtv0x-d1caf6905f9e92f053a1ed1ae1e6abba img.avia_image{ box-shadow:none; } .avia-image-container.av-ixtv0x-d1caf6905f9e92f053a1ed1ae1e6abba .av-image-caption-overlay-center{ color:#ffffff; }

Private Equity Views the Shale Revolution

Growing market share and increased geopolitical flexibility must surely lead to good investment returns. But around $1TN in capital has not all been well spent, and any sector recovery depends on management teams regaining the trust that has been lost.

.avia-image-container.av-2fkvc5t-c2e12f7ccd2301094a564501caf2ae45 img.avia_image{ box-shadow:none; } .avia-image-container.av-2fkvc5t-c2e12f7ccd2301094a564501caf2ae45 .av-image-caption-overlay-center{ color:#ffffff; }

Private Equity Views the Shale Revolution

The industry’s operating efficiencies are well known. Capex per well has been declining while output has soared. Pad drilling has brought scale and corresponding efficiencies, with rig productivity up 6X in the last five years. Since 2010, acquisition and development of shale resources by PE has grown from 10% to over half the total. PE rig count is estimated at 37%, up from 20% six years ago.

.avia-image-container.av-7f3b0x-83bc3f107e84c67f138645c46c74ded3 img.avia_image{ box-shadow:none; } .avia-image-container.av-7f3b0x-83bc3f107e84c67f138645c46c74ded3 .av-image-caption-overlay-center{ color:#ffffff; }

ROCE for Upstream E&P Companies

Nonetheless, the shrinking of the public equity investor appetite for energy has impacted PE, because it’s constrained their ability to exit via a sale of assets to a publicly traded company, or via an IPO. There were no MLP IPOs last year, illustrating that the public equity markets are closed to energy companies. So PE holding periods have gone from 2-4 years to 4-7.

.avia-image-container.av-1jkrfg1-533aa5556c22516192ea39932a848c65 img.avia_image{ box-shadow:none; } .avia-image-container.av-1jkrfg1-533aa5556c22516192ea39932a848c65 .av-image-caption-overlay-center{ color:#ffffff; }

Falling Free Cash Flow Hurts Valuations

Meanwhile, public companies are responding to calls for greater cash flow discipline by moderating growth capex and redirecting more cash back to investors through dividend hikes and buybacks. There are also signs that capex plans now adjust more quickly to altered circumstances than in the past. Several upstream companies lowered their planned spending during 4Q18 as oil slumped.

On the midstream side, Magellan Midstream (MMP) recently have shelved an expansion project because of insufficient shipper demand. Several projects are planned to increase capacity for the largest crude tankers, which require deepwater ports offshore. Perhaps concerned about overcapacity, Kinder Morgan pulled out of a JV with Enbridge to develop a deep water crude oil export facility, although the project is still expected to proceed.

.avia-image-container.av-1a2wbw1-1acff8eaa47bd5a5ed5ff546a03ab2d5 img.avia_image{ box-shadow:none; } .avia-image-container.av-1a2wbw1-1acff8eaa47bd5a5ed5ff546a03ab2d5 .av-image-caption-overlay-center{ color:#ffffff; }

A consequence of this new capital discipline is that public companies’ criteria for buying assets from PE owners include that they be FCF-positive, so as to maintain promised cash returns to stockholders. A positive NPV is no longer enough, which is forcing PE investors to develop their assets more fully than expected, taking up more time and capital.

.avia-image-container.av-qqugk1-5daa86b4470e4eb22d9f31fed7f61fa2 img.avia_image{ box-shadow:none; } .avia-image-container.av-qqugk1-5daa86b4470e4eb22d9f31fed7f61fa2 .av-image-caption-overlay-center{ color:#ffffff; }

Infrastructure funds, which often include midstream energy infrastructure in their mandate, raised a record $88BN in 2018, up from $75BN in 2017.  PE investors have been active in the pipeline sector. Blackstone invested almost $5BN in two deals with Targa Resources (TRGP) and Tallgrass (TGE). Funds managed by Carlyle, Stonepeak and Arclight have also committed capital.

Although the 2014-16 MLP price collapse continues to haunt investors, there is a chronic shortage of assets that can generate stable cashflows over two decades or more. The recent drop in U.S. ten year yields to 2.4% is one example. Ten year German Bund yields are negative again, and French oil giant Total issued perpetual bonds at 1.75%. PE investors buying infrastructure understand this better than public markets, and a publicly owned pipeline with a distributable cash flow yield above 10% looks like a mispriced asset. It’s why we think the sector has substantial room to appreciate.

SL Advisors is the sub-advisor to the Catalyst MLP & Infrastructure Fund.  To learn more about the Fund,  please click here.

SL Advisors is also the advisor to an ETF (USAIETF.com).