MLPs: Five Years On, Cheaper Than Ever

The end of August was the five year anniversary of the peak in MLPs. Had it not been for the distraction caused last week by a more compelling story (see Blackstone and Tallgrass Further Discredit the MLP Model), we would have already noted this milestone.

The Alerian MLP index, albeit much changed and diminished since August 2014, remains 38% lower including dividends. We won’t repeat the reasons, which are familiar to regular readers (see It’s the Distributions, Stupid!).

Pipeline stocks have certainly labored under some poor management decisions (see Kinder Morgan: Still Paying for Broken Promises) and self-dealing (see Why Energy Transfer Can’t Get Respect). However the Blackstone take-private offer for Tallgrass (TGE) plays out, this unfortunate episode has confirmed the wariness of many investors for the weak governance of publicly traded partnerships.

But the broad energy sector also languishes, now representing less than 4.5% of the S&P500. The S&P energy ETF (XLE) is 42% off its highs of June 2014. The Van Eck oil services ETF (OIH) is down a staggering 83%. The sustained weakness in the pipeline sector has to be considered against this backdrop. Even Exxon Mobil (XOM) is 25% off its April 2014 high, and yields over 5%. For the first time in the history of the S&P500, XOM is not in the top ten.

Energy investors are keenly aware that, although their sector bottomed in February 2016 along with crude oil, the broader equity market has risen over 50% from that low point. The S&P500 is within 2% of new all-time highs.

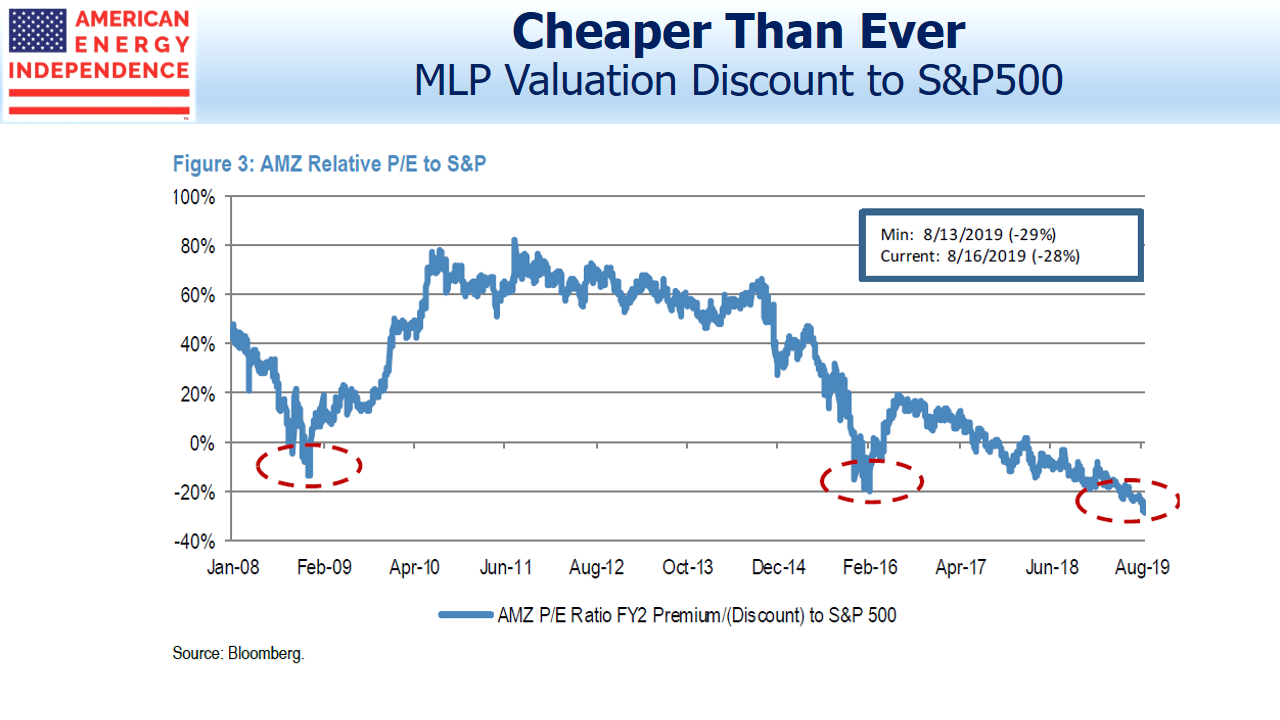
Holders of midstream energy infrastructure stocks are clearly not momentum investors. But they have identified relative value – the chart below highlights that relative P/Es compared with the S&P500 favor MLPs more clearly than during the financial crisis, or even the February 2016 low which capped an even bigger drop than in 2008-9.

.avia-image-container.av-1rhgxz3-d2adf80a8c6ba312fd02a3875925d646 img.avia_image{ box-shadow:none; } .avia-image-container.av-1rhgxz3-d2adf80a8c6ba312fd02a3875925d646 .av-image-caption-overlay-center{ color:#ffffff; }

MLP Valuation Discount to the SP500

P/Es rarely even figure in evaluations of MLPs, since earnings are often distorted by depreciation charges that don’t reflect the actual change in value of owned assets. So it’s notable that even using earnings numbers that are usually lower than Distributable Cash Flow (DCF), the sector is cheap.

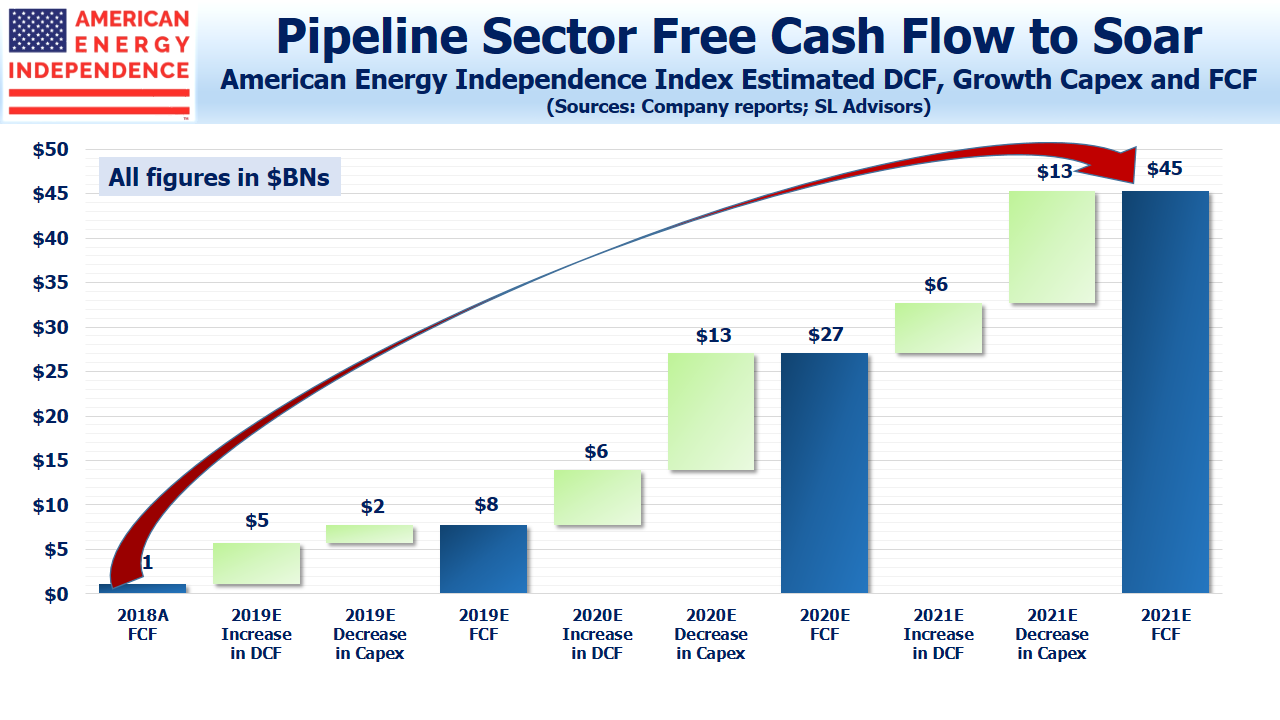
In discussions with investors, we continue to find that growth in free cash flow is the strongest bullish case. The chart below (also see The Coming Pipeline Cash Gusher) is based on the American Energy Independence Index, which provides broad exposure to North American corporations along with a few large MLPs. Existing assets are generating increased DCF, and investment in new projects peaked last year. We revise these projections quarterly based on guidance during earnings calls, and so far the numbers are approximately tracking what we expected when we first projected FCF in April.

.avia-image-container.av-19gvbjz-fcbd1028d1ef542ef5f2bbdfbf90a6ef img.avia_image{ box-shadow:none; } .avia-image-container.av-19gvbjz-fcbd1028d1ef542ef5f2bbdfbf90a6ef .av-image-caption-overlay-center{ color:#ffffff; }

Pipeline Sector Free Cash Flow Soars

There can be few areas of investing as unloved as energy. Investors may be put off by past distribution cuts, poor capital allocation decisions, questionable governance or climate change (see  Our Fossil Fuel Future (With a Bit More Solar and Wind)).

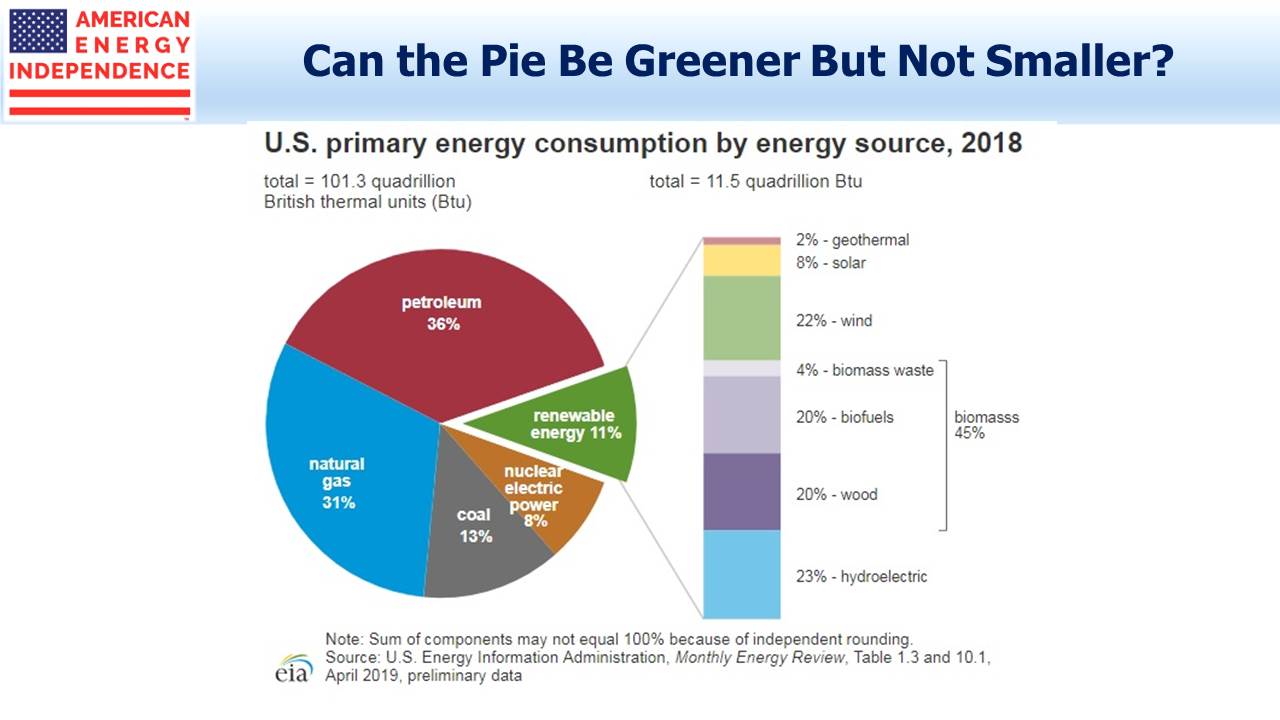
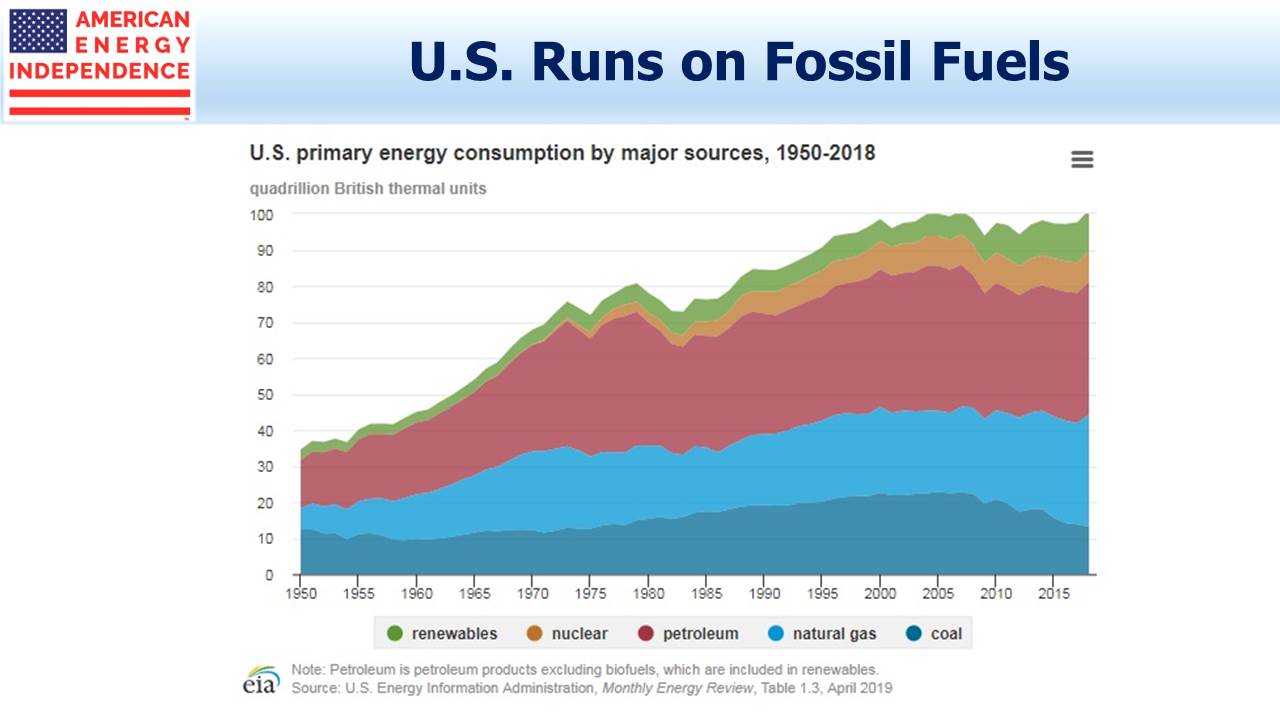
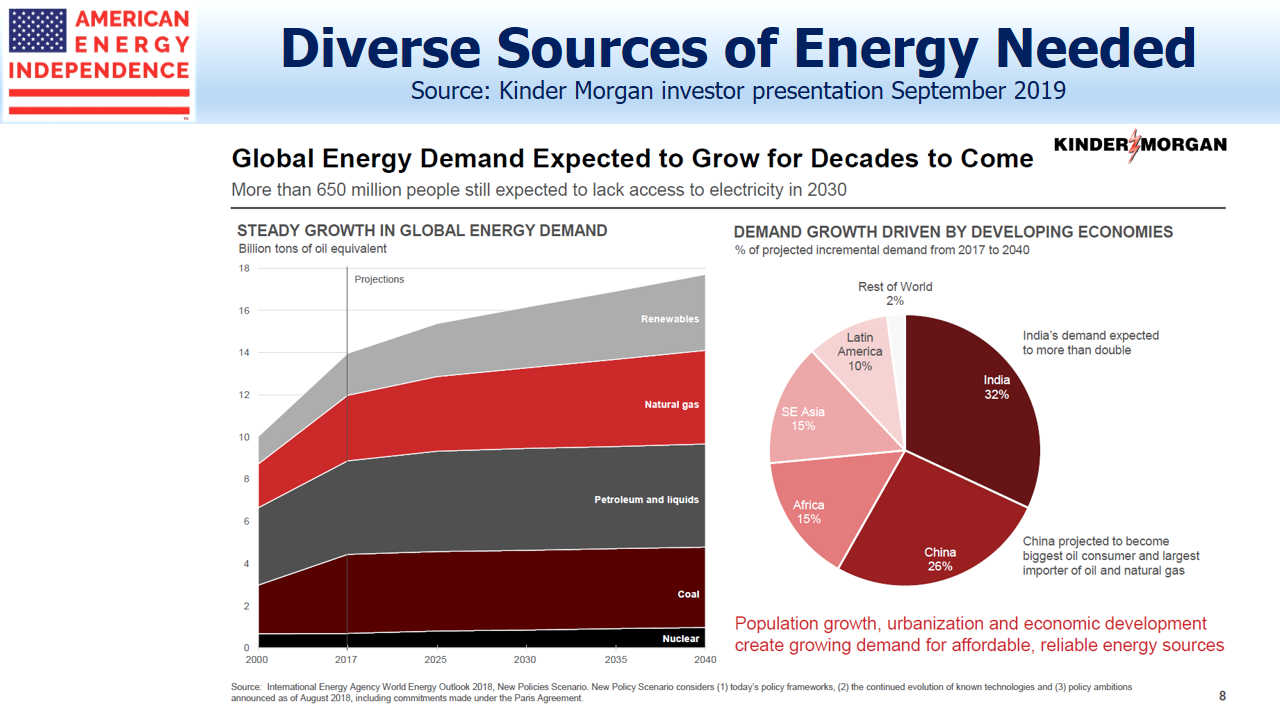
In response: distributions are rising; growth capex has peaked; most of the sector is now corporations, with more robust governance; and serious long term forecasts recognize that fossil fuels will provide 80% or so of the world’s energy for decades to come.

.avia-image-container.av-rbzdkv-2d118d36586cdcfc4859b6fd2df5673a img.avia_image{ box-shadow:none; } .avia-image-container.av-rbzdkv-2d118d36586cdcfc4859b6fd2df5673a .av-image-caption-overlay-center{ color:#ffffff; }

Diverse Sources of Energy Needed

Valuations and growing cashflows support a recovery in prices.

We are invested in TGE.

SL Advisors is the sub-advisor to the Catalyst MLP & Infrastructure Fund.  To learn more about the Fund,  please click here.

SL Advisors is also the advisor to an ETF (USAIETF.com).


Blackstone and Tallgrass Further Discredit the MLP Model

​To be an SEC-registered asset manager is to submit to extensive rules of behavior, all with the objective of protecting the clients. Where a portfolio manager invests personally alongside her clients, creating a desirable alignment of interests, regulations require that the client’s interests are placed ahead of the manager’s. The asset manager has a fiduciary obligation to the owners of the capital under management, and a web of regulations exists to this end. CFA charterholders agree to additional obligations regarding ethical behavior and the primacy of clients’ interests.

The recent offer from Blackstone (BX) to acquire the 56% of Tallgrass Energy LP (TGE) it doesn’t already own at $19.50 per share has revealed an ethical gulf between prevailing standards at the providers of capital versus the users. No SEC-registered asset manager could do to its investors what TGE management is doing to theirs.

When BX acquired 44% of TGE in January at $22.43, a regulatory filing of a sideletter outlined an unusual arrangement under which, if BX bought the rest of TGE within a year, TGE management could sell their shares at $26.25.

In April, TGE CEO David Dehaemers fielded questions as to whether this arrangement created a risk that BX might take advantage of weakness in TGE shares to buy the rest of the company cheaply. He was adamant that, “…there is no intention of Blackstone doing anything here untoward.” Dehaemers went on to note that, “I’ve still got $50 million and invested in that. And that is from money that I put in this thing. It’s not restricted stock in fact I’ve never gotten a share of restricted stock in the last seven years at this thing.

“And so I didn’t leave $50 million in this thing to lose money and that just simply [isn’t] going to happen.”

These comments led investors in TGE to erroneously believe that they were invested in TGE alongside Dehaemers.

TGE’s stock fell sharply in August, creating the conditions for BX to acquire the rest of the company. Perversely, the weaker TGE’s stock the more likely was BX to attempt the buyout. Since the buyout triggered the $26.25 sale price, Dehaemers and other senior management actually benefited from the stock falling.

Although the $19.50 “take private” offer was 36% above its price the day before, it was below where TGE had traded all year until the sharp drop in August.

One might initially regard the elevated price for management’s TGE shares as nothing more than a bonus for selling the company. But because the $26.25 price is independent of the price at which the company is sold, the sideletter breaks the alignment of interests that exists when management owns shares alongside investors. The price received by other TGE investors no longer impacts the management team’s economics.

Nobody has suggested TGE deliberately drove their stock lower. But management clearly had little incentive to arrest the decline. Questions on capex plans and recontracting of pipelines received frustratingly vague answers. A management team incented to drive the stock price up might have been more forthcoming. Clearly BX, as an insider, saw little to concern them in the company’s recent operating performance.

We’ve long liked David Dehaemers and what he has achieved at TGE. We’ve talked to him several times in the past. But we are deeply disappointed at this turn of events, which at best reflects a serious judgment lapse on his part.

TGE is a partnership, which means it has much weaker governance than if it was a corporation. Sideletters such as this are legal, whereas it’s hard to imagine such a device being employed if TGE was a regular c-corp. It seems that investors in partnerships cannot rely on management promises that they have “skin in the game”, and that shared outcomes are assured.

The energy sector already struggles to demonstrate responsible stewardship of capital. The weak corporate governance of MLPs has dissuaded many institutions from investing in them. Some, like TGE, have elected to “check the box” so as to be taxed like a corporation while retaining the partnership structure. Although this improves tax reporting by providing holders with a 1099 rather than the disliked K-1, the governance weaknesses remain.

The BX-TGE episode will tarnish all the partnerships that remain in midstream energy infrastructure. Investors have little reason to hope for a high-priced acquisition, since it seems management can negotiate a different price for themselves. What’s to stop Kelcy Warren selling control of Energy Transfer (ET) in exchange for the acquisition of just the management team’s shares at a substantial premium to what’s offered the other investors? It seems there’s very little, which alters the risk/return profile.

Partnerships trade at a discount, and this shows why.

In a podcast interview with Alerian’s Kenny Feng last year, Dehaemers recounted a time earlier in his career when he wanted to relocate his family back to Kansas City, so his two boys could attend a Jesuit school. So he must know as well as anyone that unethical behavior isn’t excused simply by pointing to its prior disclosure, as is the defence of the BX-TGE sideletter.

It shouldn’t be the case that the asset managers who invest in companies like TGE adhere to higher ethical standards than the companies do themselves, but that is how things work. The list of publicly traded partnerships that can be relied upon to refrain from such moves is a short one. Choosing to pay corporate taxes while retaining the partnership structure can only be justified by managements that desire the weaker protections afforded investors, compared with corporations.

.avia-image-container.av-opuqsz-070278af818782207d8f98598a2b4464 img.avia_image{ box-shadow:none; } .avia-image-container.av-opuqsz-070278af818782207d8f98598a2b4464 .av-image-caption-overlay-center{ color:#ffffff; }

Rich Kinder did much to build the MLP model with Kinder Morgan (KMI) before breaking his “promises made, promises kept” pledge on distributions (see Kinder Morgan: Still Paying for Broken Promises). Five years later, income seeking investors have still not forgotten. David Dehaemers worked under Kinder at KMI, who was at Enron before that. A substantial portion of America’s energy infrastructure emerged from Enron’s energy business. Jeff Skilling’s record of broken promises persists.

TGE’s board has an opportunity to restore some trust, depending on how they respond to BX’s offer.

We are invested in ET, KMI and TGE

SL Advisors is the sub-advisor to the Catalyst MLP & Infrastructure Fund.  To learn more about the Fund,  please click here.

SL Advisors is also the advisor to an ETF (USAIETF.com).


Private Equity Sees Value in Unloved Pipelines

Last week the Financial Times wrote about the dwindling conviction of believers in the Shale Revolution (see Why US energy investors are experiencing a crisis of faith). Religion is an appropriate metaphor – secular values such as Enterprise Value to EBITDA or forward free cash flow yield have offered scant protection. To invest in energy today is to be a Christian thrown into Rome’s Coliseum.

In January Blackstone Infrastructure Partners (BIP), invested $3.3BN for a controlling interest in Tallgrass Energy (TGE) which, following a simplification of its GP/MLP structure left Blackstone owning 44% of the company. On Tuesday night TGE disclosed a take-private offer from BIP for the rest of TGE. It’s a measure of how poorly TGE’s stock has performed that buying the remaining 56% would cost $200MM less than BIP’s original investment even after the 35% premium embedded in the proposal.

The good news came with a sour taste. A previously agreed sideletter between BIP and TGE came to light revealing a sweetheart deal for management. In the event of a take-private transaction like this one, management can sell its shares at $26.25, not the $19.50 agreed for all the public investors. A cynic might conclude that TGE allowed uncertainty about their capex plans and recontracting on pipelines to weigh on the stock price, inviting BIP to acquire the balance below their earlier deal price while paying insiders 35% more. Energy sector executives provide ample material for critics who see scant evidence of a fiduciary mindset.

Returning to negative sentiment, retail investors struggle with the failure of growing oil and gas production to lift the prices of midstream energy infrastructure, with its toll-model supposedly fairly insulated from commodity prices. Public market valuations differ from where private equity sees things. It turns out  BIP is also puzzled but happy to exploit the opportunity.

They’re not the only private equity investor to have misjudged the depth of public market antipathy to energy. Last year Global Infrastructure Partners (GIP) invested $3.125BN to acquire a controlling interest in Enlink Midstream (ENLC). Following their GP/MLP simplification a few months later, GIP owned 40% of ENLC.

Today ENLC’s market cap has sunk to $3.6BN, creating a paper loss for GIP of almost $1.7BN. Former CEO Barry Davis returned, replacing Mike Garberding who had been promoted from CFO less than a year earlier. It’s not just retail investors who have bought into undervalued pipeline stocks too soon.

Earlier this year private equity firm IFM Investors bought Buckeye Partners for $6.5BN, a 32% premium to the market price.

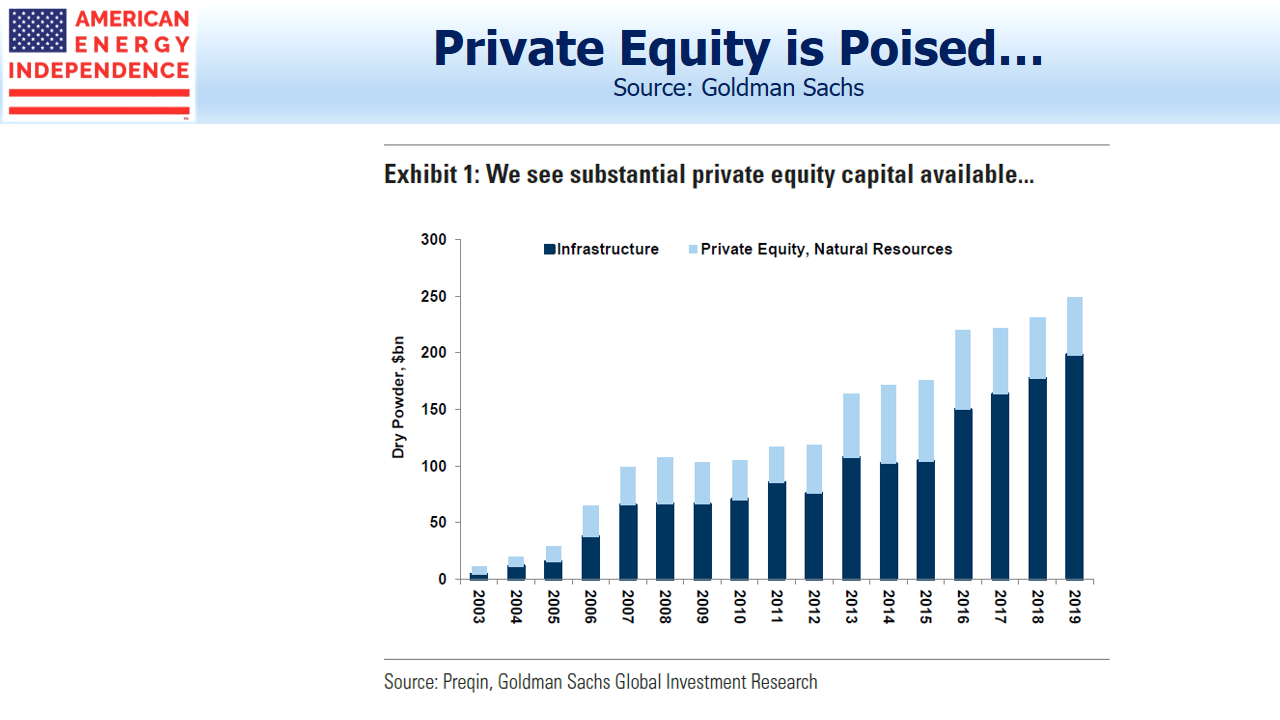
Goldman Sachs recently noted that around $250BN in private equity “dry powder” is dedicated to infrastructure and natural resources. It won’t all find its way into the U.S. pipeline sector, but the American Energy Independence Index, which broadly reflects the sector, now has a market cap of around $450BN. The float-adjusted figure, removing shares held by management that don’t trade, is $372BN. GIP is raising a fourth fund targeting $17.5BN, undeterred by the paper loss GIP III has taken on ENLC.

.avia-image-container.av-swd4in-9015c6ab55276ee089f158e509a03700 img.avia_image{ box-shadow:none; } .avia-image-container.av-swd4in-9015c6ab55276ee089f158e509a03700 .av-image-caption-overlay-center{ color:#ffffff; }

Available Private Equity Capital

The end of August marked the five year anniversary of the peak in the Alerian MLP Index. It remains 39% off its high. Hinds Howard, who follows the sector for CBRE Clarion Securities, notes more than 80 constituents have been removed from the index. MLPs have steadily become less representative of midstream energy infrastructure. The Alerian MLP Index (AMZ) has a market cap of around $250BN ($150BN float-adjusted).

The FT article blamed the slump in part on poor spending discipline. By way of confirmation, PDC Energy’s (PDCE) recently announced acquisition of SRC Energy (SRCI) anticipates annual savings of $50MM in General and Administrative (G&A) expense. Considering SRC’s entire G&A was $39MM last year and the company’s market cap is $1.1BN, this is not a company with a parsimonious culture towards corporate overhead. Both stocks rose on the news.

Investors want further consolidation in the energy sector, including midstream. There are more senior energy executives than we need.

We are invested in ENLC and TGE.

SL Advisors is the sub-advisor to the Catalyst MLP & Infrastructure Fund.  To learn more about the Fund,  please click here.

SL Advisors is also the advisor to an ETF (USAIETF.com).


Hopes for a Trade Deal Slipping

Article I of the U.S. Constitution gives Congress the “…Power to lay and collect Taxes, Duties, Imposts and Excises…” Congressional control over tariffs has never been so strong since.

The Reciprocal Trade Agreement Act of 1934 granted President Roosevelt the authority to adjust tariffs and to negotiate bilateral trade agreements without prior congressional approval. Other legislation increased the Administration’s control over trade, including the Trade Act of 1974 which allowed the President to impose a 15% tariff if imports threatened national security. There’s much to recommend a single decision maker heading up such negotiations. It should lead to more predictable, less capricious discourse than one requiring congressional approval. For decades, it’s how the U.S. has conducted trade negotiations, and it’s broadly worked.

In recent months, President Trump has demonstrated the full range of options afforded a president to manage trade. Updates on the progress of negotiations with China have been responsible for much of the recent market volatility.

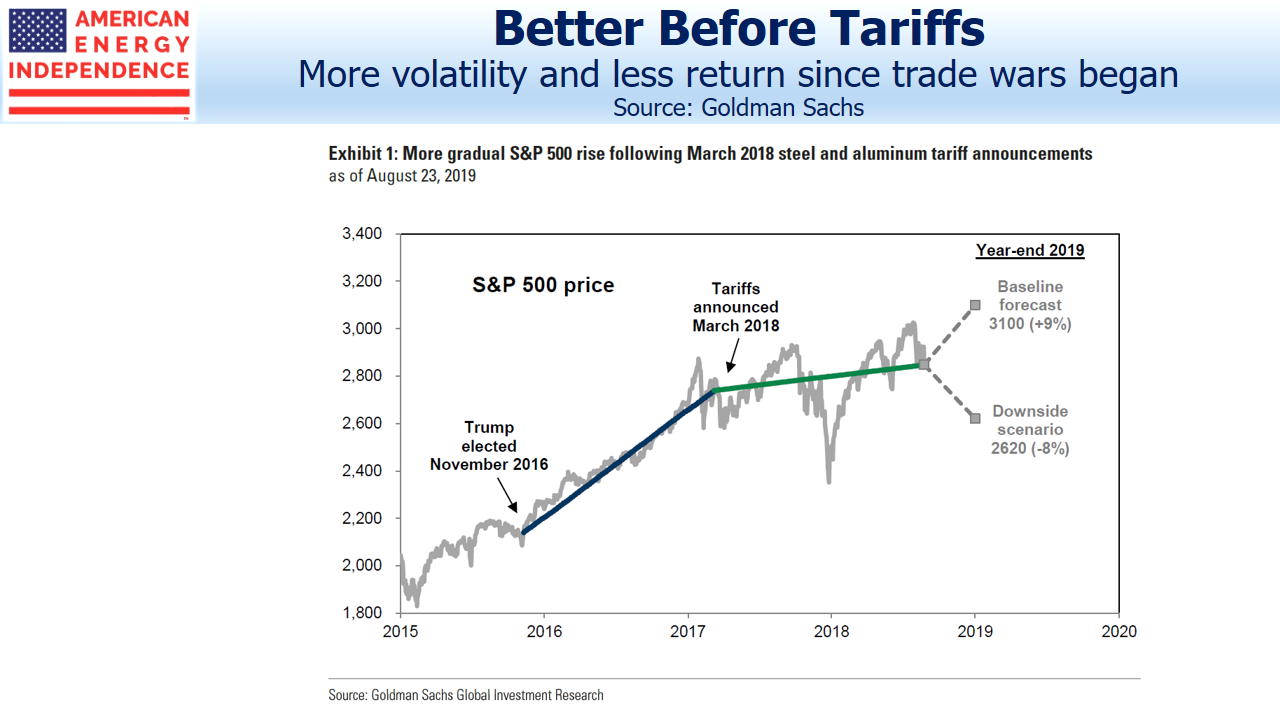
An interesting chart from Goldman Sachs divides the three year performance of the S&P500 into two periods – a steady uptrend that prevailed from Trump’s surprise election until the first imposition of steel tariffs early last year, followed by a modest rise punctuated by higher volatility.

.avia-image-container.av-1bvfqup-cf9f6e5d517ef0fef314b195261c555b img.avia_image{ box-shadow:none; } .avia-image-container.av-1bvfqup-cf9f6e5d517ef0fef314b195261c555b .av-image-caption-overlay-center{ color:#ffffff; }

Trade War Increases Market Volatility Lowers Returns

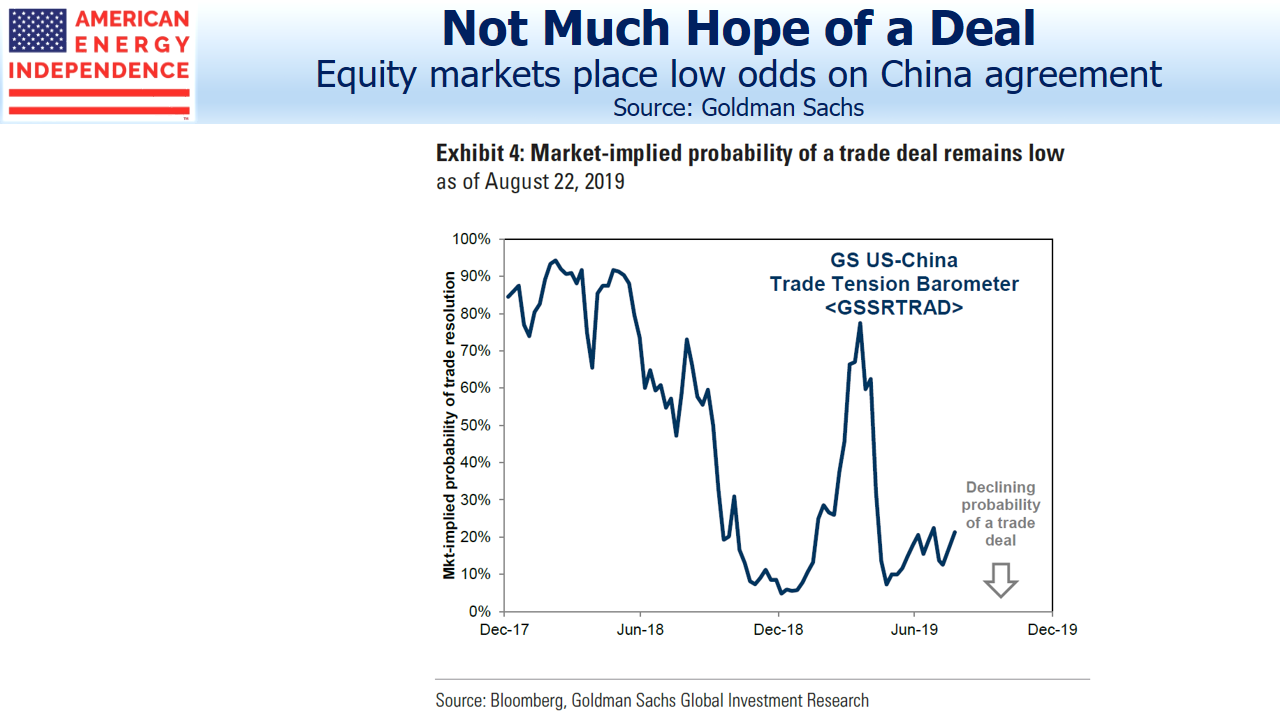
A second Goldman chart infers the market’s estimate of a trade deal by comparing baskets of stocks with sharply different exposure to China. Based on this, market expectations of a trade deal are low, and Goldman duly do not expect one before next year’s election.

.avia-image-container.av-pnjvm9-77310e467510156e33526f447ecaa56a img.avia_image{ box-shadow:none; } .avia-image-container.av-pnjvm9-77310e467510156e33526f447ecaa56a .av-image-caption-overlay-center{ color:#ffffff; }

Market Places Low Odds on Trade Deal

Stocks are cheap relative to bonds (see Stocks Offer Bond Investors an Opening). It seems self-evident that Trump’s re-election prospects are better without trade disputes slowing growth, and therefore rational for him to seize a deal. The trade deficit with China is already falling (see Trade Wars: End in Sight), so the opportunity to declare victory and reach agreement is a real one.

Low expectations of an agreement coupled with relatively cheap stocks mean a big rally would follow.

But this analysis isn’t unique, and market participants are looking beyond it. Current pricing of no deal before the election either means Trump won’t seize one, or China will decline to offer a graceful exit from a negotiating strategy that hasn’t yet worked.

This brings us back to the issue of which arm of government should control trade negotiations. There’s much to be said for the current structure. Congress is an unwieldy negotiating partner, and myriad parochial interests could easily derail an almost perfect agreement.

If the low expectations of an agreement turn out to be accurate, calls to restore some of the power originally vested in Congress are likely to grow. Senators from both parties have begun advocating for such a change. If protracted trade uncertainty continues into next year, the odds of legislative action will rise.

Paradoxically, such an outcome could well be bullish if it removed much of the trade uncertainty we’re learning to live with. It’s just hard to assess how much intervening market volatility will be required to provoke lawmakers into action.

SL Advisors is the sub-advisor to the Catalyst MLP & Infrastructure Fund.  To learn more about the Fund,  please click here.

SL Advisors is also the advisor to an ETF (USAIETF.com).


Pension Funds Keep Interest Rates Low

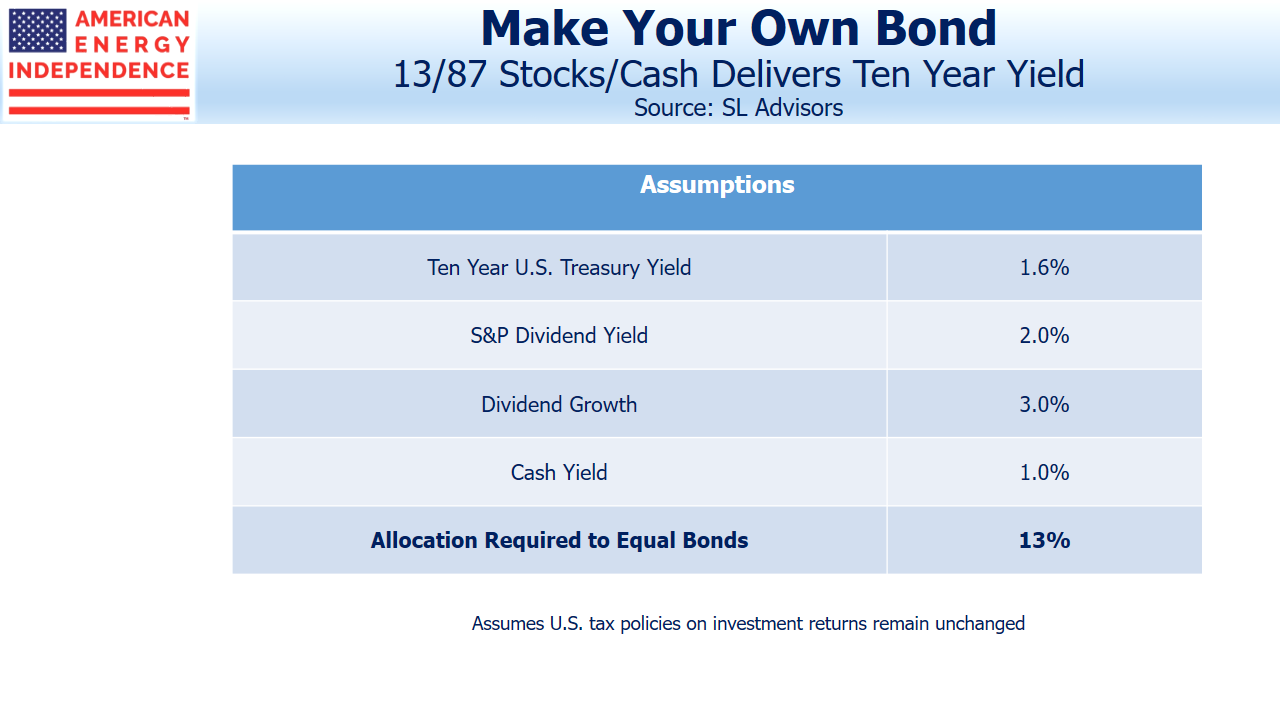
The Equity Risk Premium reveals that stocks are cheap relative to bonds (see Stocks Offer Bond Investors an Opening).  A corollary of this insight that bonds are expensive is that you can replicate the return on $100 in ten year treasury notes with a combination of stocks and cash. It relies on a few assumptions, such as an unchanged dividend yield, known dividend growth rate and unchanged tax policy. Because it shows that as little as 13% in equities, with the rest in cash (i.e. a 13/87 barbell) can match the ten year note, it starkly highlights the expense of bonds.

.avia-image-container.av-1awq69e-1d73be0471e9a64e4624569d11e23708 img.avia_image{ box-shadow:none; } .avia-image-container.av-1awq69e-1d73be0471e9a64e4624569d11e23708 .av-image-caption-overlay-center{ color:#ffffff; }

Make Your Own Bond 13_87

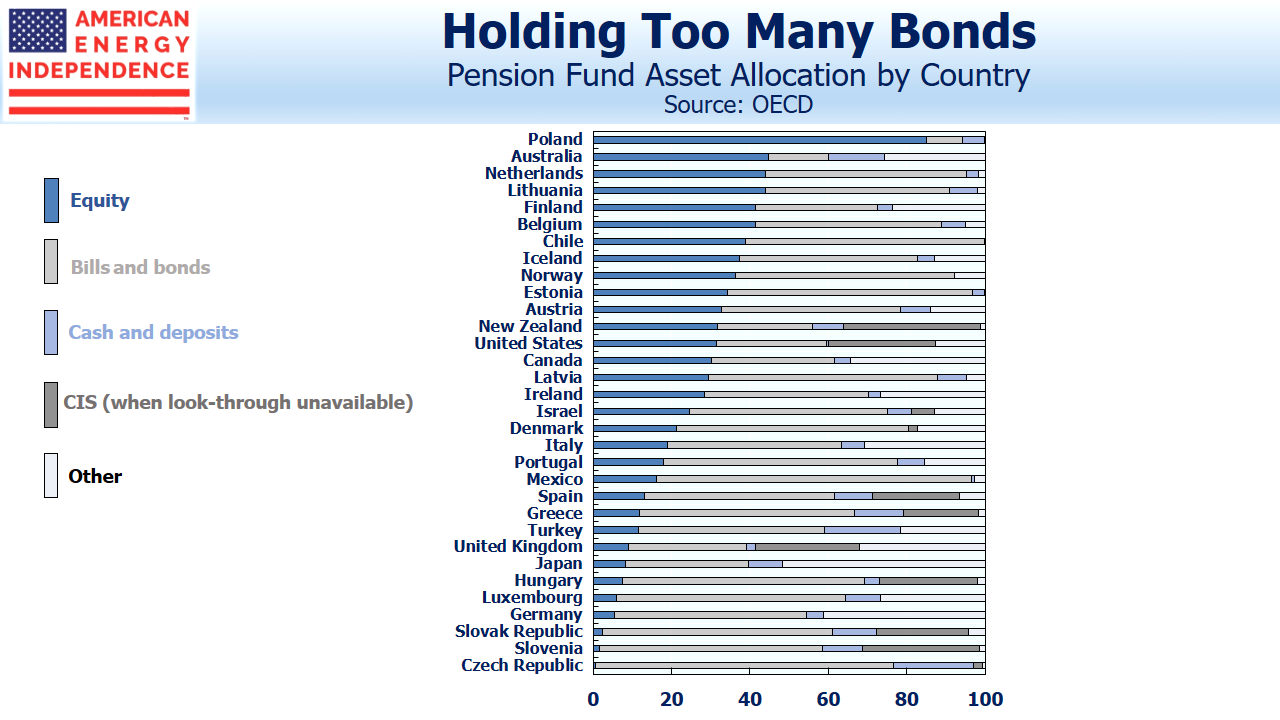
Pension funds are large investors, including in fixed income. The OECD estimates that they hold over $8TN in bonds, equal to approximately 10% of the global investment grade bond market. About half is U.S. pension funds.

.avia-image-container.av-jddavm-5c0aa8d405e91fd52f0552da87df6796 img.avia_image{ box-shadow:none; } .avia-image-container.av-jddavm-5c0aa8d405e91fd52f0552da87df6796 .av-image-caption-overlay-center{ color:#ffffff; }

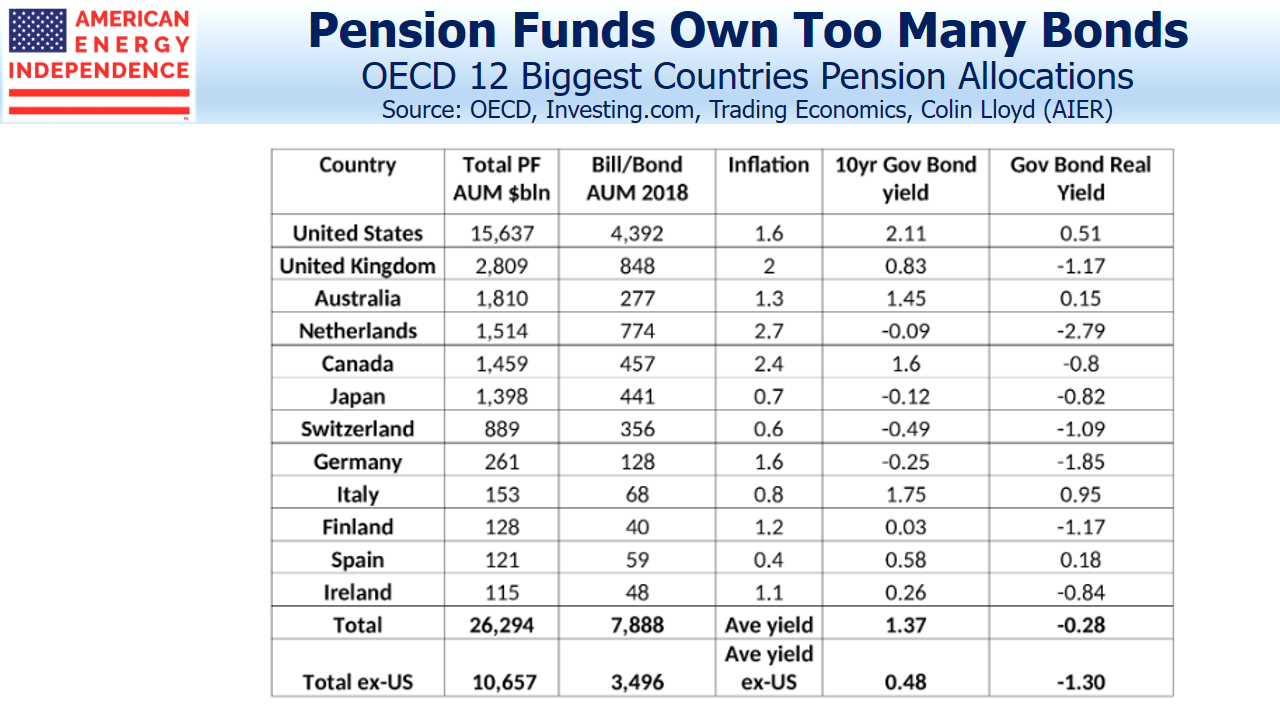
An interesting blog post by Colin Lloyd (see The Pension Fund Apocalypse)  estimates that the real return on this $8TN in debt is negative.

.avia-image-container.av-sl8bgy-07abce247d04803800893cf08d7ed7c1 img.avia_image{ box-shadow:none; } .avia-image-container.av-sl8bgy-07abce247d04803800893cf08d7ed7c1 .av-image-caption-overlay-center{ color:#ffffff; }

Pension Allocations OECD 12 Biggest Countries

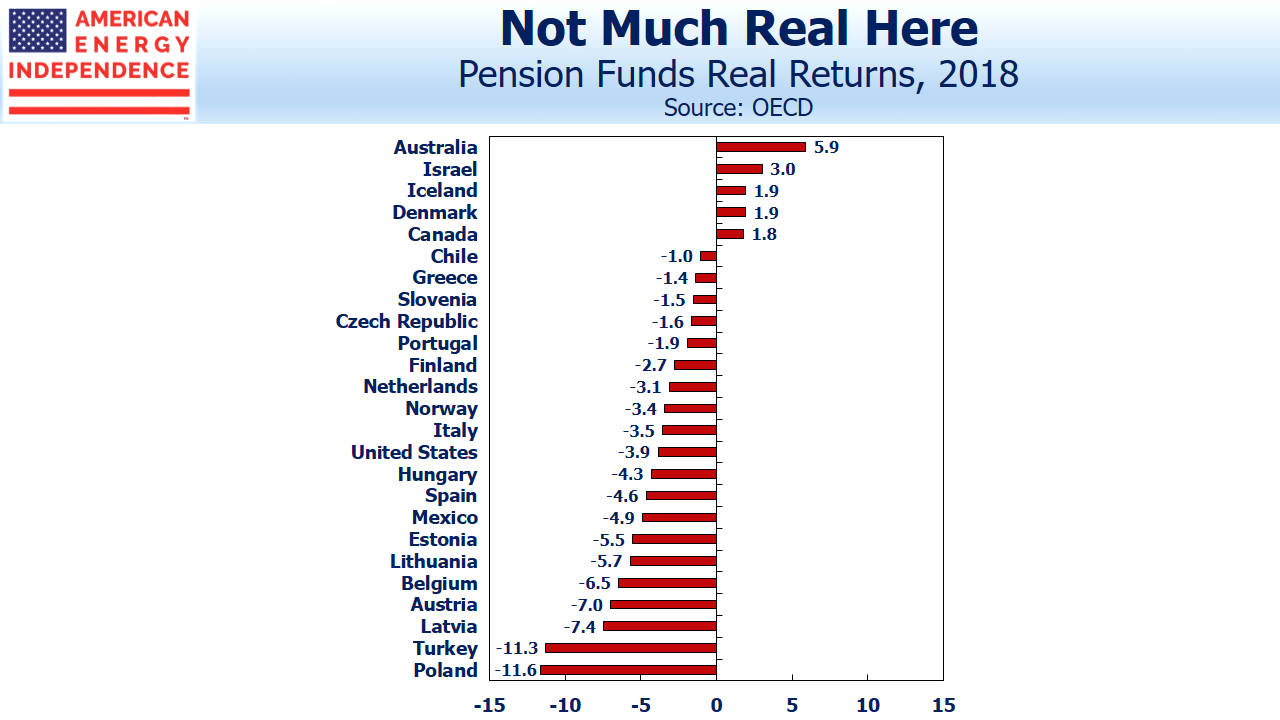
A consequence is that U.S. pension funds earned a negative real return last year of -3.9%. The S&P500 was -4.4% (nominal), but fixed income didn’t help.

.avia-image-container.av-m7ezyq-4f971bd53d9f3c055389fb11f6c1ba04 img.avia_image{ box-shadow:none; } .avia-image-container.av-m7ezyq-4f971bd53d9f3c055389fb11f6c1ba04 .av-image-caption-overlay-center{ color:#ffffff; }

Pension Funds Real Returns

This unsurprising result has worsened with this year’s further drop in bond yields. Although the math of divesting from long term debt is compelling, pension funds face complex restrictions on their asset allocation. For example, U.S. pension funds maintain a 28.1% allocation fixed income, in the certain knowledge of a negative real return. They inexplicably raised their allocation, from 24.9% the prior year.

What should have happened by now is that discerning pension funds shift away from bonds, but so far there’s little evidence of this.

The demand for fixed income from investors such as pension funds is fairly inelastic. Colin Lloyd calculates that the nominal return on bonds over the past century is 4.3%. The regulatory framework assumes that negative real returns can’t persist indefinitely, and that mean reversion will bring higher yields. But the inability or unwillingness of pension funds to lower their exposure makes such a correction less likely.

More flexible investors, such as endowments and foundations, can be more discriminating. But the persistence of low/negative yields, with almost $17TN of sovereign debt now yielding less than zero, shows that demand remains strong.

Bond yields may rise from their recent new lows. But a return to the long run average real return of 2% would require ten year notes to yield 3.5-4%, double their current level. Continued negative real returns and unchanged fixed income allocations will make it harder for pension funds to be fully funded.

It doesn’t have to lead to a crisis, but it’s one reason to expect long term rates will remain low for the foreseeable future. Perversely, for funds that seek to match the cashflows of assets and liabilities, lower interest income can lead to greater bond investments to achieve a required level of cashflow. What’s needed is a relaxation of regulations to allow a more objective rejection of bonds when returns are inadequate.

Pension funds are one reason rates have stayed low.

SL Advisors is the sub-advisor to the Catalyst MLP & Infrastructure Fund.  To learn more about the Fund,  please click here.

SL Advisors is also the advisor to an ETF (USAIETF.com).


Bond Buyers Should Buy Pipeline Stocks

Yields on McDonalds’ Euro-denominated bonds recently joined European sovereign debt in negative territory. It’s a headline writers dream (juicy burgers, not yields…customers and investors pay to do business, etc).

$17TN in publicly traded debt now yields less than zero – 30% of the entire investment grade market. Debates rage about what this means. Bond investors are not accused of being analytically weak – something bad must be over the horizon. As mentioned before, we’re contemplating the idea that such a stubborn retention of fixed income investments reflects a degree of risk aversion towards stocks, for fear of a sharp fall. The searing memories of the financial crisis are within the careers of most market participants. Stocks are always vulnerable to a big sell off. But the preponderance of caution reflected in the scramble for low-risk yet yield-less bonds suggests speculative fever is not rampant. In this view, stocks are cheap.

The energy sector has provided unattractive risk/return of late. It’s why it’s so cheap. One of the reasons for poor sentiment could be climate change. 82% of the world’s energy comes from fossil fuels, and the average of serious 20-year forecasts sees this at around 80% in 2040. Reading articles on renewables can consume much of a day, every day, while those expecting the 82% share to stay roughly the same are a rare breed.

If equity valuations on midstream energy infrastructure stocks reflect a widespread belief that oil and gas pipelines will soon be as useful as a VHS recorder, bonds issued by these same companies should offer commensurately high yields.

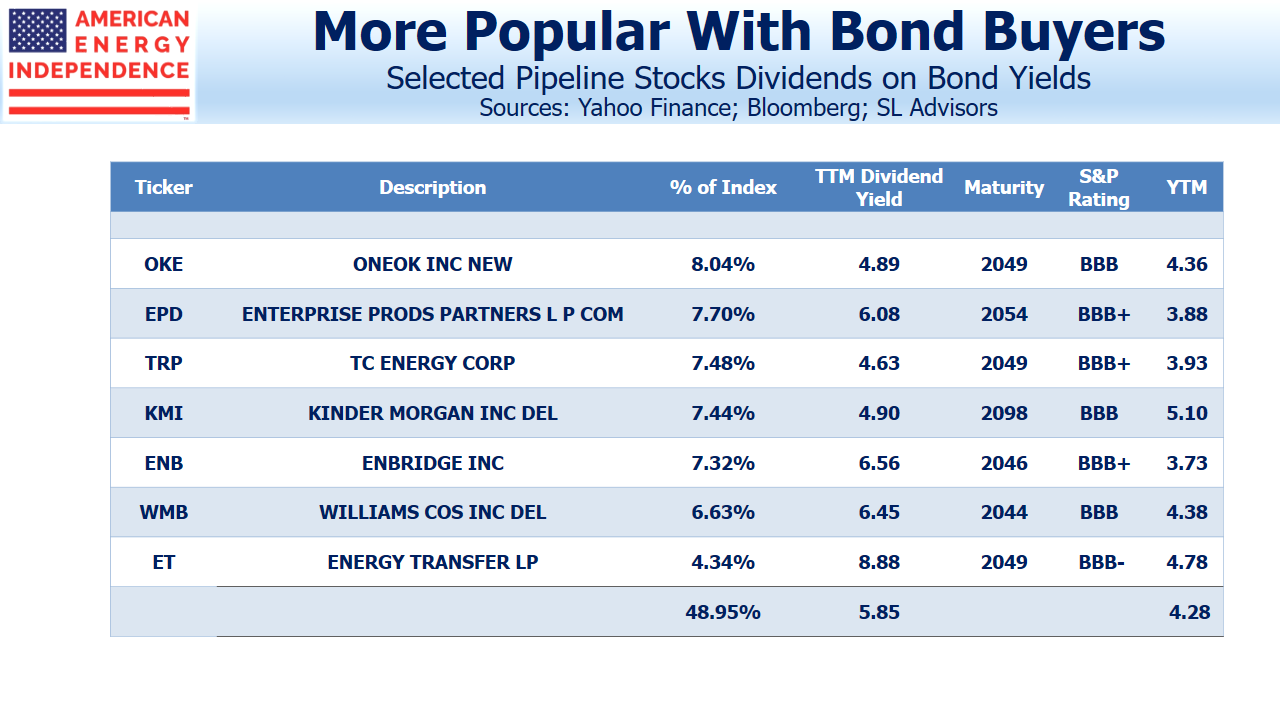
But they don’t. A review of yields on the investment grade bonds of U.S. issuers in the American Energy Independence Index averages 3.7% (using the weights of the index). Although yields of any kind are hard to obtain nowadays, the 3.9% yield on 2054 bonds issued by Enterprise Products Partners (EPD) suggests a high expectation of being repaid in full. This in turn requires pipelines and related infrastructure to maintain their critical role in America’s energy supply for at least another four decades. EPD’s stock yields over 6%. Its distribution is growing and buybacks are likely. Try and conceive a scenario in which the holder of the 2054 bonds will, over any plausible investment horizon, do better than the equity investor.

.avia-image-container.av-rh5ug2-dcd046a7442d61ac4d8dc1e914e83f79 img.avia_image{ box-shadow:none; } .avia-image-container.av-rh5ug2-dcd046a7442d61ac4d8dc1e914e83f79 .av-image-caption-overlay-center{ color:#ffffff; }

Pipeline Stocks Dividends on Bond Yields

Kinder Morgan (KMI) has bonds maturing in 2098, in effect perpetual debt, yielding 5.1%. Although this is modestly higher than the stock’s 4.9% dividend yield, next year’s expected 25% hike will fix that. Although the 2098 bond issue is a tiny $26MM, they have $33BN outstanding, much falling due after 2040. The holders of KMI 2098 bonds no doubt congratulate themselves for doing better than investing in French energy giant Total (TOT), who recently issued perpetual Euro debt at 1.75% (see Blinded by the Bonds). But if they like KMI’s 80 year bonds, they’d have to prefer the equity.

The investment grade issuers in the table represent half of the American Energy Independence Index. Their long dated bonds yield 4.3% — profligate by today’s standards, but nonetheless too low to reflect anything other than confidence of full repayment over the decades ahead. The holders of these bonds must regard equity buyers as having abandoned all reason in allowing dividend yields to drift so high.

If fixed income buyers like midstream energy infrastructure, eventually equity buyers will find reason to follow.

We are invested in EPD and KMI.

SL Advisors is the sub-advisor to the Catalyst MLP & Infrastructure Fund.  To learn more about the Fund,  please click here.

SL Advisors is also the advisor to an ETF (USAIETF.com).


Trade Wars: End in Sight

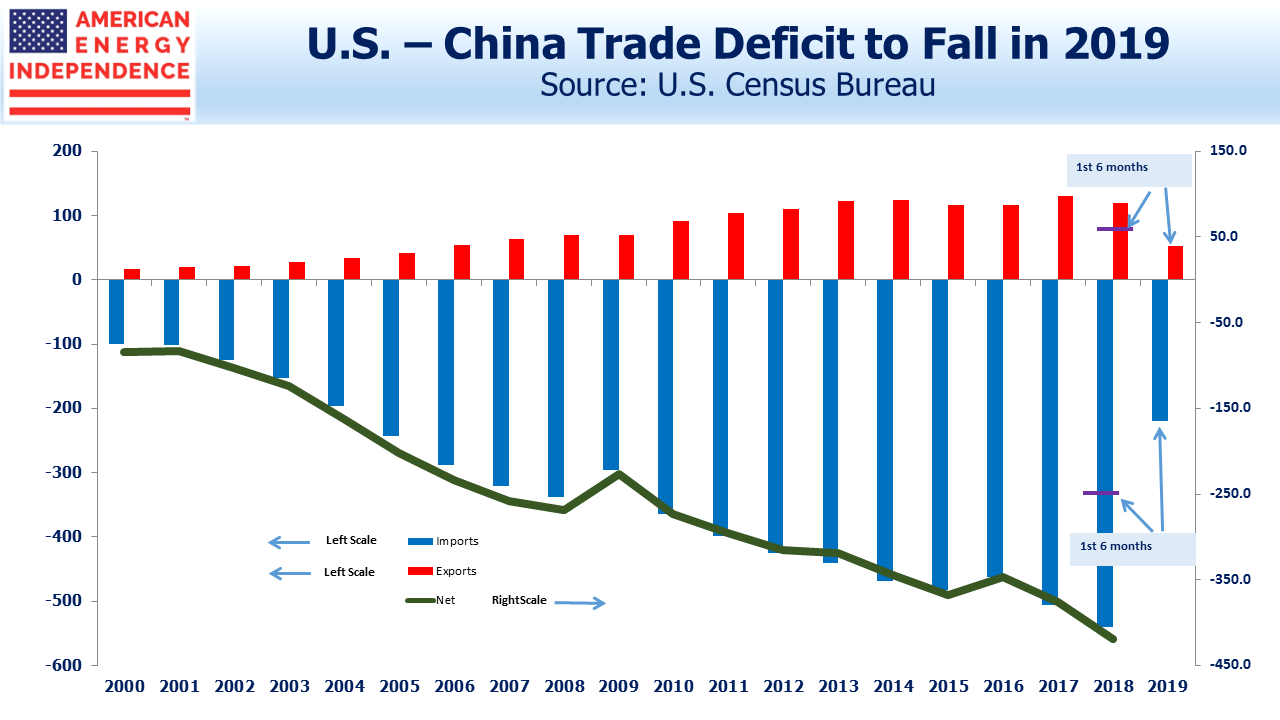
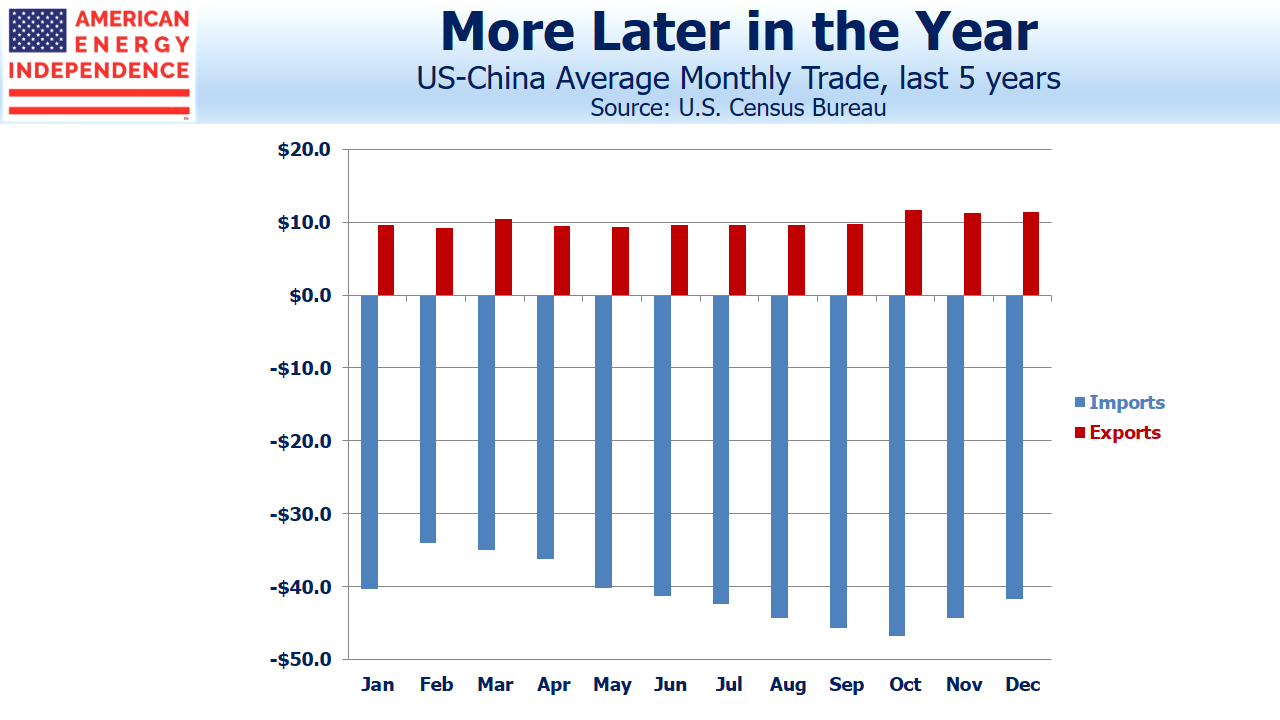
Last week’s fears of global recession herald the late stages of Trump’s trade war. It’s already possible to see the outlines of a triumphant victory speech. The U.S. trade deficit with China is on track to fall for the first time in at least 30 years. After it reached a new record last year, critics were quick to point out the Administration’s failure to resolve an issue that figured prominently in the 2016 campaign. But as the chart shows, unless trade flows for the second half of 2019 follow a dramatically different pattern than in the past, this year will provide the White House with plenty of ammunition heading into the 2020 election.

.avia-image-container.av-rgop4p-15c512a427d9eff914fbc3f6a710941a img.avia_image{ box-shadow:none; } .avia-image-container.av-rgop4p-15c512a427d9eff914fbc3f6a710941a .av-image-caption-overlay-center{ color:#ffffff; }

.avia-image-container.av-twbpdl-a5e1df90d2bb922375b2e95903bb652e img.avia_image{ box-shadow:none; } .avia-image-container.av-twbpdl-a5e1df90d2bb922375b2e95903bb652e .av-image-caption-overlay-center{ color:#ffffff; }

U.S. China Average Monthly Trade

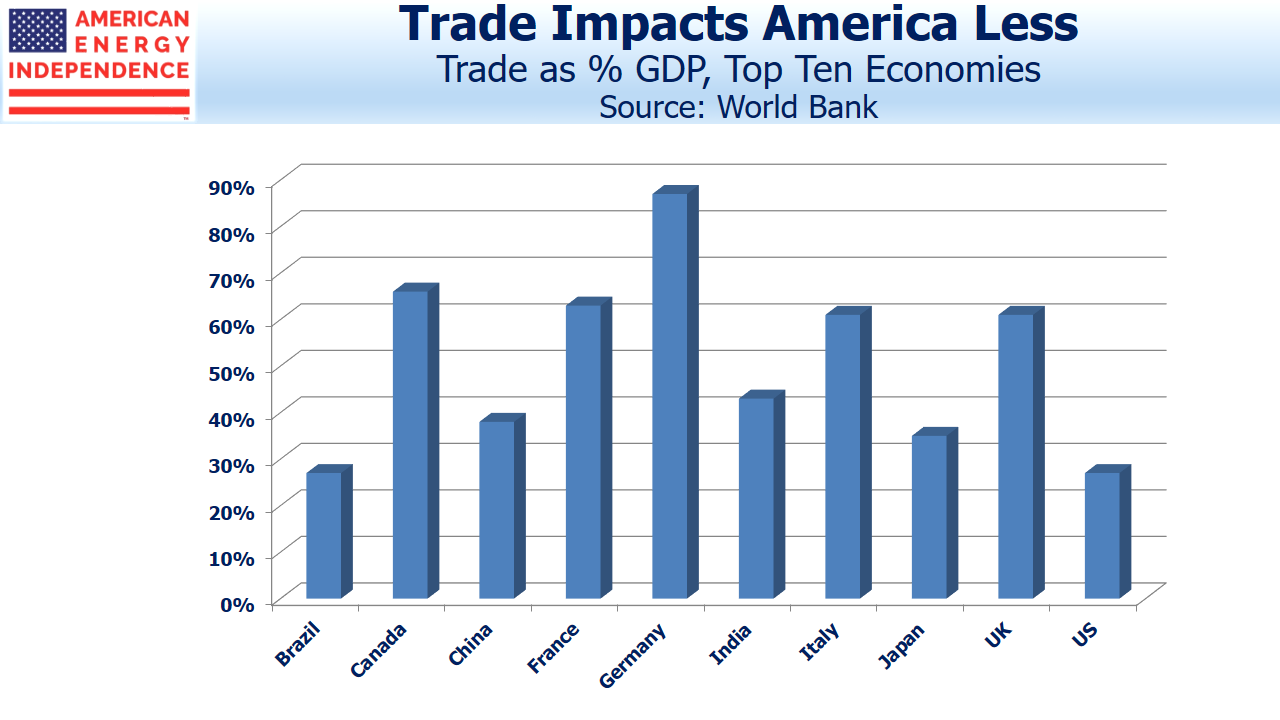
The U.S. always had a stronger hand; America’s vast domestic market means trade penetration is the joint-lowest among the world’s ten biggest economies (tied with Brazil). America has hundreds of world class companies selling goods and services globally. But many thousands more achieve years of growth without having to venture abroad. Compare that with Germany’s vaunted “mittelstand”, of small and mid-size industrial companies that export successfully around the world. Overseas customers are vital to German GDP growth, which is why ongoing trade friction tipped the German economy into contraction during the second quarter.

.avia-image-container.av-j84opl-ba658967a897ee2265cfaadc98feb6b8 img.avia_image{ box-shadow:none; } .avia-image-container.av-j84opl-ba658967a897ee2265cfaadc98feb6b8 .av-image-caption-overlay-center{ color:#ffffff; }

Trade as a Percentage of GDP

Soybean exports to China represent 10% of all U.S. farm output, so there are regions and industries that have suffered. Consequently, the Administration recently announced $16BN in aid to farmers hurt by Chinese reciprocal tariffs. But the overall result is that U.S. GDP has been less harmed than in other countries. High-tech goods such as aircraft and integrated circuits are among the biggest export categories to China, but since intellectual property is one source of conflict, these industries shouldn’t be surprised if they get caught in the crossfire.

Trump draws widespread condemnation for the manner in which he governs, but in taking on the trade deficit with China he is reflecting the views of many Americans. Since World War II, the U.S. navy has protected vital shipping lanes around the world, facilitating trade and thus promoting global prosperity. Questioning this policy doesn’t resonate with most politicians; but the emergence of other big economies, such as China, to compete with the U.S.suggests that American security policy can be less selfless than in the past.

A more transactional U.S. approach, less drawn to underwriting the greater good prompts simple questions: one is, why does the U.S. maintain troops in Germany as protection from Russia, while Germany increases its imports of Russian natural gas? America has bankrolled military support for many countries rebuilding their economies since World War II. Times are changing.

Bilateral trade deals suit the U.S. Although the White House was widely criticized for withdrawing from the Trans Pacific Partnership (TPP), negotiating within large groups blunts the leverage of the world’s biggest economy. The U.S. benefits from a series of bilateral agreements creating a hub and spoke framework, although most nations do better by coordinating with others.

Last year’s free trade deal with South Korea is an example. More recently, NAFTA was replaced with the US-Mexico-Canada Agreement (USMCA) in a pair of bilateral negotiations with Canada and Mexico that tweaked the old deal to suit the U.S.

It’s why the EU is more popular with smaller countries. Once Britain leaves the EU and opens bilateral trade negotiations with the U.S., it’ll experience the reduced leverage that comes from being outside the group.

The shrinking deficit with China is creating an opening for Trump to reach an agreement, removing the growing headwind slowing global GDP. He can boast of being the first president to interrupt the steadily increasing trade deficit with China. If he doesn’t dwell for too long, he may even head off the recession that investors increasingly fear.

What’s unclear is whether it’s been worth the fight. The U.S. Federal budget deficit relies on financing by foreign investors. Because America doesn’t save enough to meet its borrowing needs domestically, the surplus dollars held by trade partners, including China, get reinvested into U.S. financial assets, such as treasury bonds. A lower trade deficit suggests fewer excess dollars owned by foreigners to be invested. This in turn means more U.S. debt will need to be financed by domestic savers, which will require higher interest rates as an inducement. And even though the U.S. has a strong hand in trade negotiations, slowing GDP growth doesn’t help anyone.

Provoking trade friction may not always be smart policy, but it does reflect popular opinion. It is democratic. Trump’s critics are many, but he is a reflection of American views on trade.

SL Advisors is the sub-advisor to the Catalyst MLP & Infrastructure Fund.  To learn more about the Fund,  please click here.

SL Advisors is also the advisor to an ETF (USAIETF.com).


Art of the Tariff

Yesterday’s White House announcement that newly imposed tariffs on Chinese goods would be delayed three months sent stocks higher. The trade dispute hasn’t hurt the U.S. that much, although there’s widespread evidence of financial distress among farmers. Agriculture Secretary Sonny Perdue showed his sledgehammer wit in a joke aimed at farmers complaining about tariffs. China recently stopped buying U.S. agricultural products entirely in response to the latest U.S. tariffs. Farmers vote, and the White House has modestly recalibrated its approach. Trump clearly enjoys the relatively unfettered freedom of action afforded the president on trade.

Trade friction threatens global growth. The IMF recently called for a quick resolution between the U.S. and China. It’s blamed for the continuing drop in bond yields, with some investors openly contemplating whether the U.S. could soon join other developed country sovereign debt with negative interest rates. U.S. ten year yields of 1.7% are the highest in the G7, and among those who shop for value in government bond markets they probably look enticing.

America’s higher yields reflect our relative immunity to trade war fallout. The S&P500 recently broached 3,000 for the first time before retreating on new tariffs. But yesterday’s bounce took it back to within 3% of recent al-time highs. We noted last week how the Equity Risk Premium provided a compelling case for investors to allocate towards risk assets (see Stocks Offer Bond Investors an Opening).

.avia-image-container.av-kc50k1-a189e228114131af2ae65b376581b2c0 img.avia_image{ box-shadow:none; } .avia-image-container.av-kc50k1-a189e228114131af2ae65b376581b2c0 .av-image-caption-overlay-center{ color:#ffffff; }

America Shielded from Trade War

Although Trump’s protracted dispute with China has broad domestic support, we continue to believe that a resolution will be found within the next few months, so as to avoid any economic fallout in an election year. Expect to see agricultural exports and natural gas heralded as big winners.

The U.S. energy sector could certainly use a confidence boost. Pipeline earnings have generally been at or ahead of expectations. The bull story relies on the growth in free cash flow (see The Coming Pipeline Cash Gusher). 2Q19 earnings reports provided further confirmation that growth projects peaked last year, leaving more cash available for dividend hikes.

Traders betting on a global slowdown are quick to short crude oil, and recent weakness in energy prices has hurt the sector’s stocks too. No matter that pipeline company earnings are generally not sensitive to commodity prices. The most asked question by clients recently centers around the incongruity of good operating performance with falling stock prices. The short answer is that several years of dividend cuts left income-seeking investors betrayed. So far this year, this traditional buyer hasn’t rushed back, as shown by flows into retail-oriented funds.

Improving fundamentals and compelling valuations are attracting private equity buyers. Public market buyers will surely follow.

SL Advisors is the sub-advisor to the Catalyst MLP & Infrastructure Fund.  To learn more about the Fund,  please click here.

SL Advisors is also the advisor to an ETF (USAIETF.com).


Canada Looks North to Export its Oil

Infrastructure projects can require a lot of planning, but the proposed link by the Alaska – Alberta Railway Development Corporation (A2A Rail) traces its roots back to 1898, when a charter to build a line to Alaska was awarded to the Edmonton & District Railway Company. Canada is perennially challenged to move its bitumen-based crude oil to export markets. Progress on the Keystone XL suffered years of delays. It’s designed to move crude from Alberta to Cushing, OK. Environmental activist opposition under Obama at one point caused TC Pipelines (TRP, then called Transcanada) to take a C$2.9BN writedown in 2016.

The obvious move was Trans Mountain (TMX), an expansion pipeline within Canada to the Pacific coast for export. But this caused such acrimony between Alberta and neighboring province British Columbia that Kinder Morgan Canada eventually gave up, selling the project with fortuitous timing to the Canadian federal government.

Enbridge (ENB) recently told us they wouldn’t attempt to build a new oil pipeline in Canada, unless it was wholly within energy-friendly Alberta.

Against this backdrop, there’s a resurgence of interest in moving crude by rail to export facilities in Alaska. It’s a measure of the unintended consequences of environmental extremists that a higher-cost, riskier route is being pursued. Alberta’s oil production exceeded the takeaway infrastructure so significantly that the provincial government imposed production constraints. Last year the benchmark Western Canada Select (WCS) traded as much as $30 per barrel below the WTI benchmark, ruinous testimony to Canada’s domestic transport constraints. Getting its oil to markets has created fissures within Canada. Albertans feel their net contributions to the Federal budget are unappreciated by the rest of the country.

Few Canadians will soon forget the 2013 crude train disaster in Lac-Magentic, when a fireball engulfed a small town in Quebec, killing 47 people. Pipelines’ better safety record is ignored by opponents of today’s energy, hence reconsideration of the railroad.

The Alberta – Alaska Railway (A2A) will run from Edmonton and Fort McMurray, in the heart of Alberta’s tar sands region, carrying 1-1.5 million barrels a day of crude to the ports of Alaska’s south central coast. It’ll link up with the Trans Alaska Pipeline System, which accesses Alaska’s North Slope oil reserves. Proximity to Asian markets shaves four days off the shipping time compared with ports in the Gulf of Mexico, home to North America’s crude export terminals.

.avia-image-container.av-jlgsn0-c8a4d35f028d85da5e2e96a7db337187 img.avia_image{ box-shadow:none; } .avia-image-container.av-jlgsn0-c8a4d35f028d85da5e2e96a7db337187 .av-image-caption-overlay-center{ color:#ffffff; }

A2A Rail Route

A2A will pass through Canada’s Yukon territory, a remote and resource-rich area. Supporters note that extracting Yukon’s valuable minerals will become more commercially attractive with access to railroad transport. Flexibility is rail’s main advantage over the pipelines, which offer safe, specialized transport just for liquids and gas. Copper, lead, zinc and uranium could be mined and linked by an extension to the A2A, boosting local employment in a sparsely populated and relatively poor region. By promoting benefits beyond global access for Alberta’s crude, the project is aiming for broad support.

A2A may even provide alternative rail shipment for Asian goods coming into the U.S.

The cost is estimated at C$14-20BN, and should find eager investors among the many private equity funds dedicated to infrastructure. Robert Dove, Head of Financing and Strategy for A2A Rail, said, “We anticipate institutional investors will find the long term cash generating ability of the railway to be highly attractive. By providing improved access to export markets for Canadian crude oil as well as developing important mineral reserves in the Yukon Territory, we think there are multiple revenue opportunities for this important infrastructure project.”

In June, A2A Rail reached agreement with the Alaska Railroad Corporation on working together to build the connection. Stakeholder consultations come next, including negotiations with the many indigenous tribes known collectively as First Nations. In many cases opposition can probably be softened with community investments. 121 years after first being contemplated, a railroad from Alberta to Alaska took another step towards reality.

Although there seem to be countless stories about the demise of fossil fuels because of climate change, projects such as A2A reinforce that oil, gas and natural gas liquids will continue to provide the vast majority of the world’s energy for decades to come.

We are invested in ENB and TRP.

SL Advisors is the sub-advisor to the Catalyst MLP & Infrastructure Fund.  To learn more about the Fund,  please click here.

SL Advisors is also the advisor to an ETF (USAIETF.com).


Stocks Offer Bond Investors an Opening

The Federal Open Market Committee probably feels pretty good about last week’s decision to cut rates. We noted the multiple macro issues confronting decision makers (see Fed Ponders Multiple Uncertainties). With Chinese trade negotiations moving away from a deal, diversification isn’t helping as all risk assets are lower.

Government bonds provide a useful counterweight at such times – U.S. ten year yields briefly dipped below 1.7%. Knowing when to sell is key to extracting value from the flight to safety.

We regularly note the Equity Risk Premium (ERP), the difference between the earnings yields on the S&P500 and ten year treasury yields. It’s been showing stocks are cheap – on days like Monday, when global stocks were routed on trade war fears, it’s easy to overlook the ERP.

Interest rates remain ruinously low. Last month, in Real Returns on Bonds Are Gone, we showed that profit growth would provide an even more powerful ERP-case for stocks.

Current fears are for a growth slowdown, although bottom-up earnings forecasts on Factset continue to project 11% higher earnings next year. The chart below reflects the impact of a 20% drop in earnings – a substantial decline. Even an outcome as dire as this would leave stocks substantially cheaper than ten years ago. During the financial crisis, earnings fell by 29% over three years, from 2006-09.

.avia-image-container.av-jc8kr5-9340a833f6320c475f5f9b8278c92e1f img.avia_image{ box-shadow:none; } .avia-image-container.av-jc8kr5-9340a833f6320c475f5f9b8278c92e1f .av-image-caption-overlay-center{ color:#ffffff; }

Getting the ERP back to its 50+ year average of 0.6 would require a 60% drop in earnings.

Over $12TN of sovereign debt has negative yields (see Still Fearing Another Financial Crisis). The continued inflexible allocation to fixed income of vast pools of capital reflects widespread fear of another financial crisis. In effect, a 60% drop in stocks with its consequent mean reversion of the ERP is regarded as plausible by a great many large institutional investors.

Over the near term the ERP has little to say on valuations. Trading dominates as much as ever. But over any realistic investment horizon – say a year or more – the math is striking. P/E ratios are historically high, as adherents of Cyclically Adjusted Price Earnings (CAPE) maintain. But bond yields are historically low, and there’s little point in considering either in isolation.

The pricing of financial assets reflects a healthy degree of caution, something easily overlooked when a downturn in trade negotiations hurts risk assets. Trillions of dollars is avoiding stocks in favor of the tyranny of low and negative interest rates. U.S. state and local defined benefit public pension funds hold $4.4TN in assets, $4.2TN less than projections show they need. This 48% funding shortfall isn’t going to be solved by bonds.

We think equities provide a substantial margin of safety compared with bonds for long term investors.

SL Advisors is the sub-advisor to the Catalyst MLP & Infrastructure Fund.  To learn more about the Fund,  please click here.

SL Advisors is also the advisor to an ETF (USAIETF.com).