It’s the Distributions, Stupid!

Jim Carville’s admonition during Bill Clinton’s 1992 run for President was, “It’s the economy, stupid!”

In its August 2018 edition, The Utility Forecaster warns readers to approach MLPs “with caution.” Too risky for income investors is their conclusion. MLP buyers have been badly abused, and Chief Investment Strategist Robert Rapier reminds readers of the many “simplifications” that triggered unwelcome tax bills, as well as the multiple distribution cuts. Without doubt, MLP prices have followed distributions.

In one important respect though, Rapier adopts a simplistic yet incorrect explanation. “…during a long downturn in oil and gas prices, contracts expire and MLPs had to renew agreements under less favorable terms. Many MLPs found themselves doing what was once unthinkable – they had to cut distributions.”

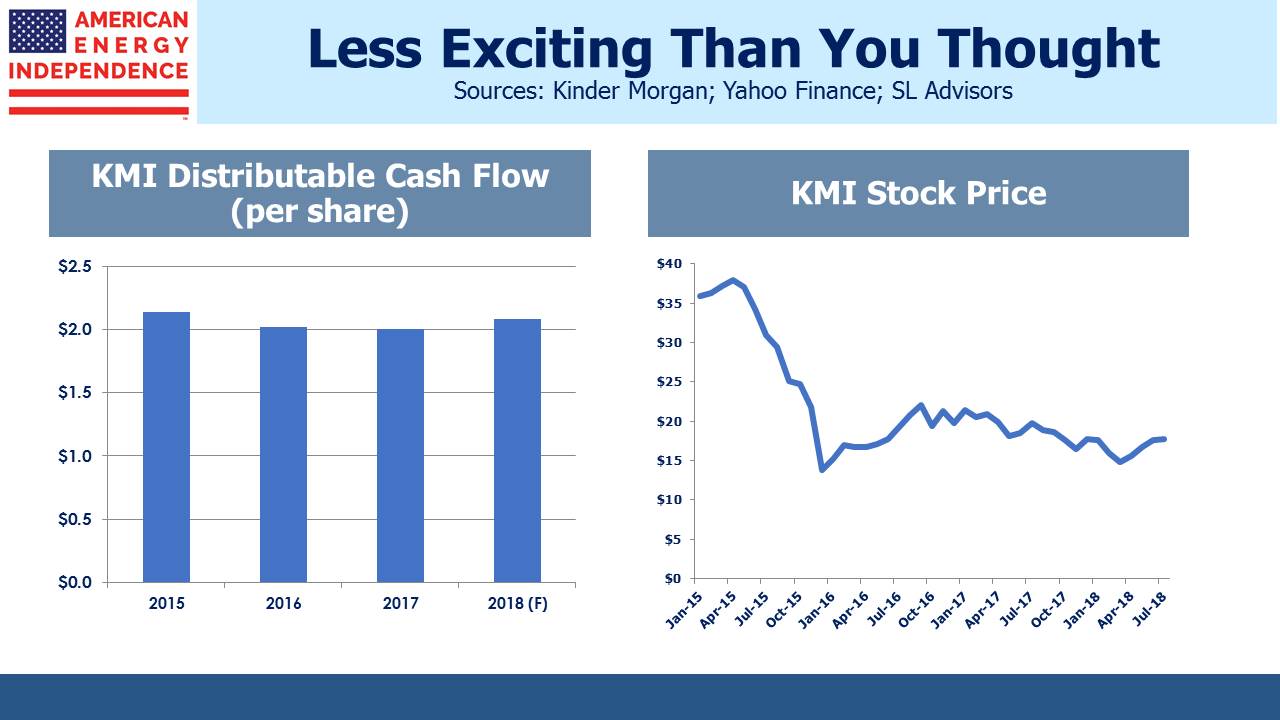
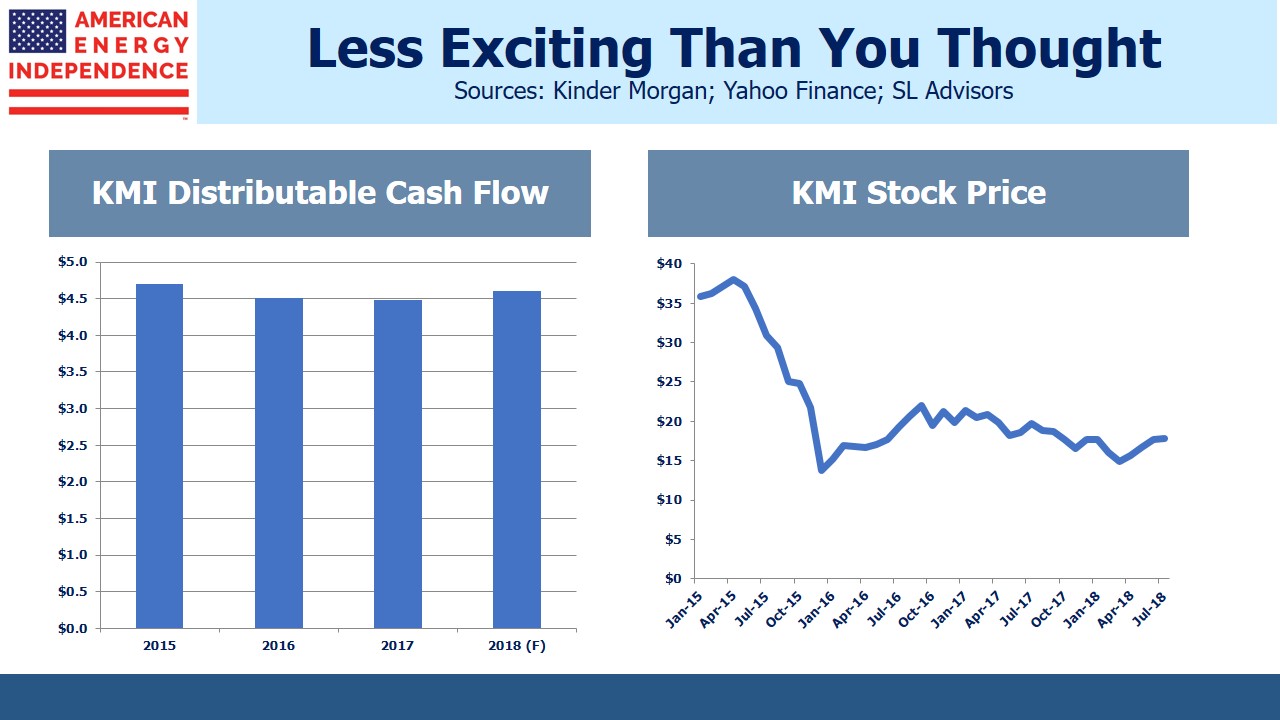
It’s conventional wisdom that the 2014-15 oil collapse hurt pipeline company operating earnings, which caused payout cuts. But the numbers don’t support this narrative. The Kinder Morgan (KMI) chart below shows their Distributable Cash Flow (DCF) per share alongside a significantly more volatile stock. KMI’s DCF per share is little changed from 2015 to 2016, but the share price fell by half. They cut their payout twice: once when combining Kinder Morgan Partners (KMP) with KMI (“simplification”, in which KMP investors received KMI stock with a lower payout as well as a tax bill); and again later when KMI cut its dividend. KMI was learning that MLP investors want income over the promise of growth.

.avia-image-container.av-jz5pbz-ab04edb85ae7933d057934f28fe27824 img.avia_image{ box-shadow:none; } .avia-image-container.av-jz5pbz-ab04edb85ae7933d057934f28fe27824 .av-image-caption-overlay-center{ color:#ffffff; }

To fund their growth projects, KMP was paying out most of its DCF and then seeking to recoup some of it through secondary offerings.  In effect, investors were being asked to reinvest a portion of their distributions back into the company. Many holders found this unattractive, since they spend the income. So KMP’s yield rose, which made issuing equity too expensive. KMI concluded MLP investors no longer suited their purpose, and left to become a corporation. Today, KMI yields 5.1%, with a payout more than 2X covered by its $4.7BN DCF.

MLP buyers can be focused on distributions to the exclusion of anything else. Two recent examples highlight:

In late July, American Midstream Partners (AMID) slashed its distribution by 75% so as to, “…significantly reduce leverage, provide capital for strategic growth opportunities, and create long-term value.” Although these all sound like desirable objectives for a total return investor, AMID’s stock fell 43%.

Meanwhile, Hi-Crush Partners (HCLP) tripled its distribution and now yields 23%. The higher payout is unlikely to persist, but if it’s sustained for a year the company will convert to a corporation. Whether or not this is good for investors, its stock rose 28% on the day of the announcement.

MLP investors want their income.

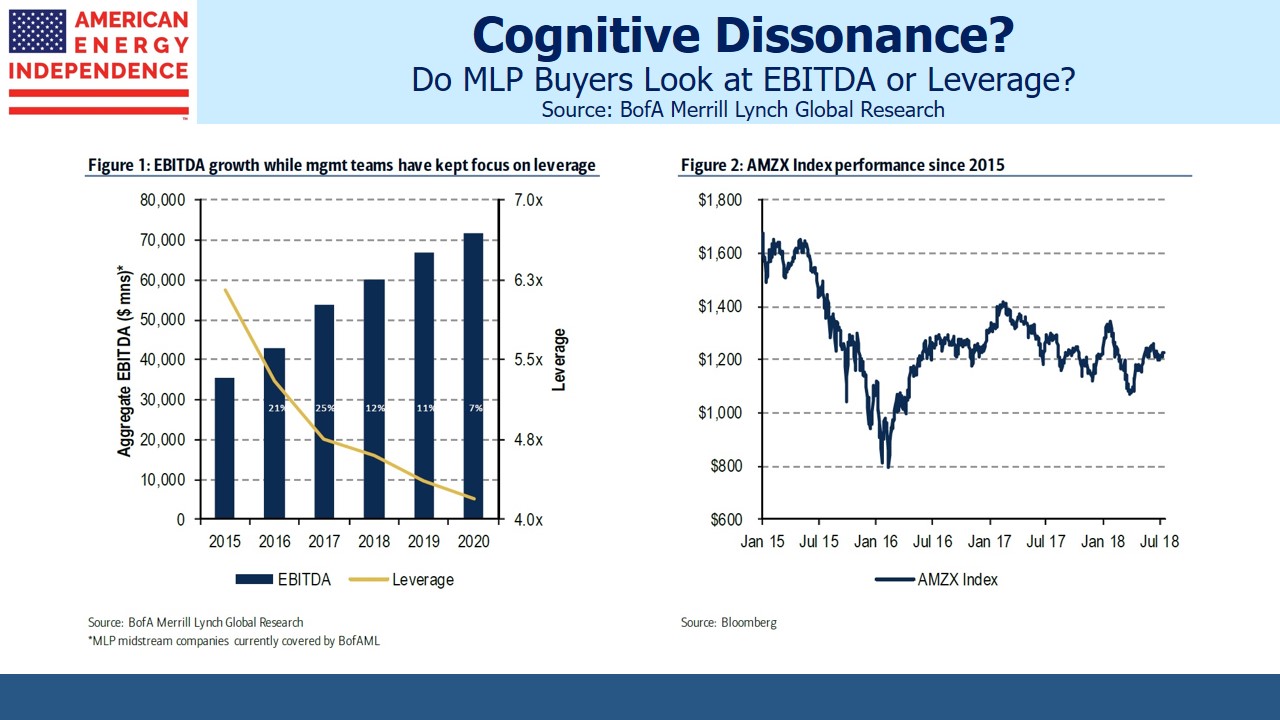
The chart from Bank of America is even more striking. On the MLPs they cover, they show steadily growing EBITDA with improving leverage, alongside a declining Alerian MLP Index. Falling MLP distributions clearly drove index performance more than improving financials.

.avia-image-container.av-10zoghr-b04696c9a3e335708761f4a632692d1d img.avia_image{ box-shadow:none; } .avia-image-container.av-10zoghr-b04696c9a3e335708761f4a632692d1d .av-image-caption-overlay-center{ color:#ffffff; }

EBITDA vs Leverage

It’s as if MLP investors look at payouts and little else.

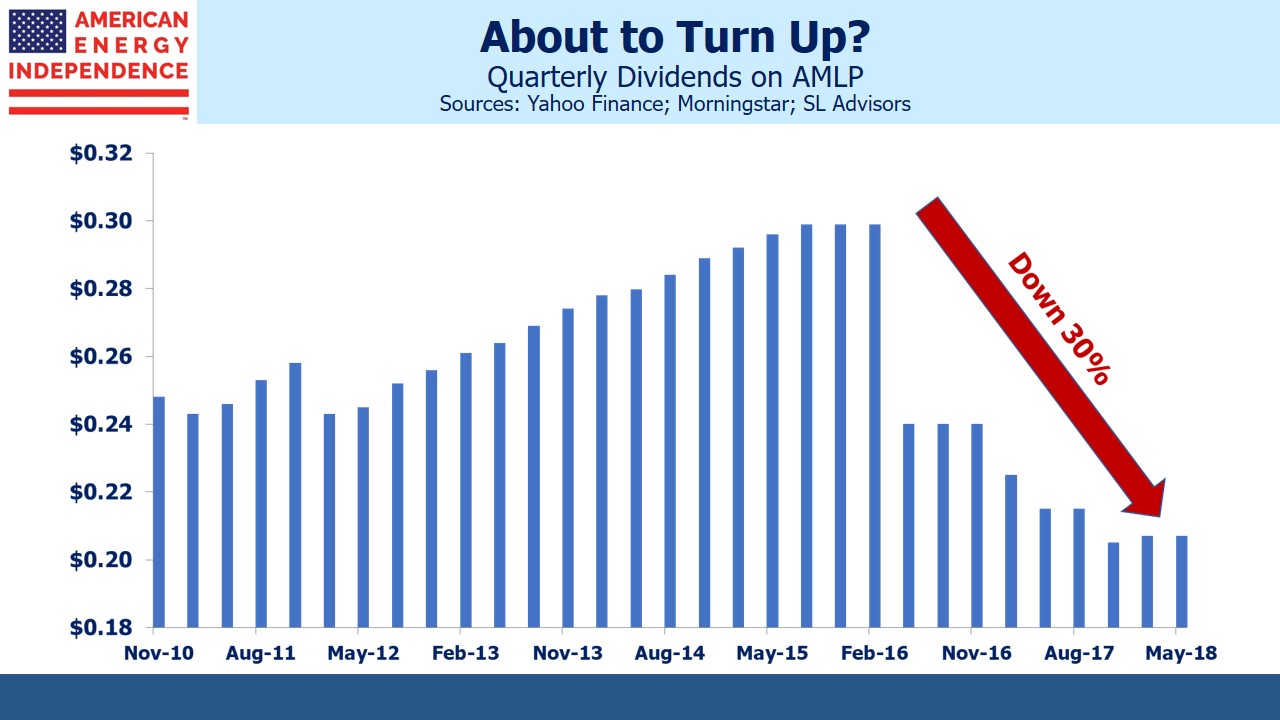
Probably the simplest measure of MLP payouts is to look at dividends on the Alerian MLP ETF (AMLP), which are 30% lower than in 2015.

.avia-image-container.av-25kzun-aff82ce80a769a809c7b65abbb9437f0 img.avia_image{ box-shadow:none; } .avia-image-container.av-25kzun-aff82ce80a769a809c7b65abbb9437f0 .av-image-caption-overlay-center{ color:#ffffff; }

There were nonetheless some companies whose operating performance sagged. Plains All American (PAGP/PAA) relied in part on its Supply and Logistics division to support its distribution. When arbitrage opportunities dried up in 2016-17, almost $800MM in EBITDA evaporated, leading to a second distribution cut. Today, increased Permian volumes are boosting cashflows once more. On last week’s earnings call they forecast 2019 EBITDA growth of 14-15%.

But episodes such as PAGP were the exception – operating results for the most part held up.

As memories of the 2014-15 bear market recede, we believe the conventional explanation for it will shift. MLP prices didn’t collapse because of weak operating performance. They fell because DCF was redirected to pay down debt and finance new projects, all to achieve growth (see Will MLP Distributions Pay Off?). Income seeking MLP investors don’t want their income redirected in this way. Hence, persistently weak MLP prices which have led the shift to a corporate structure for those companies wishing to access a far larger pool of buyers.

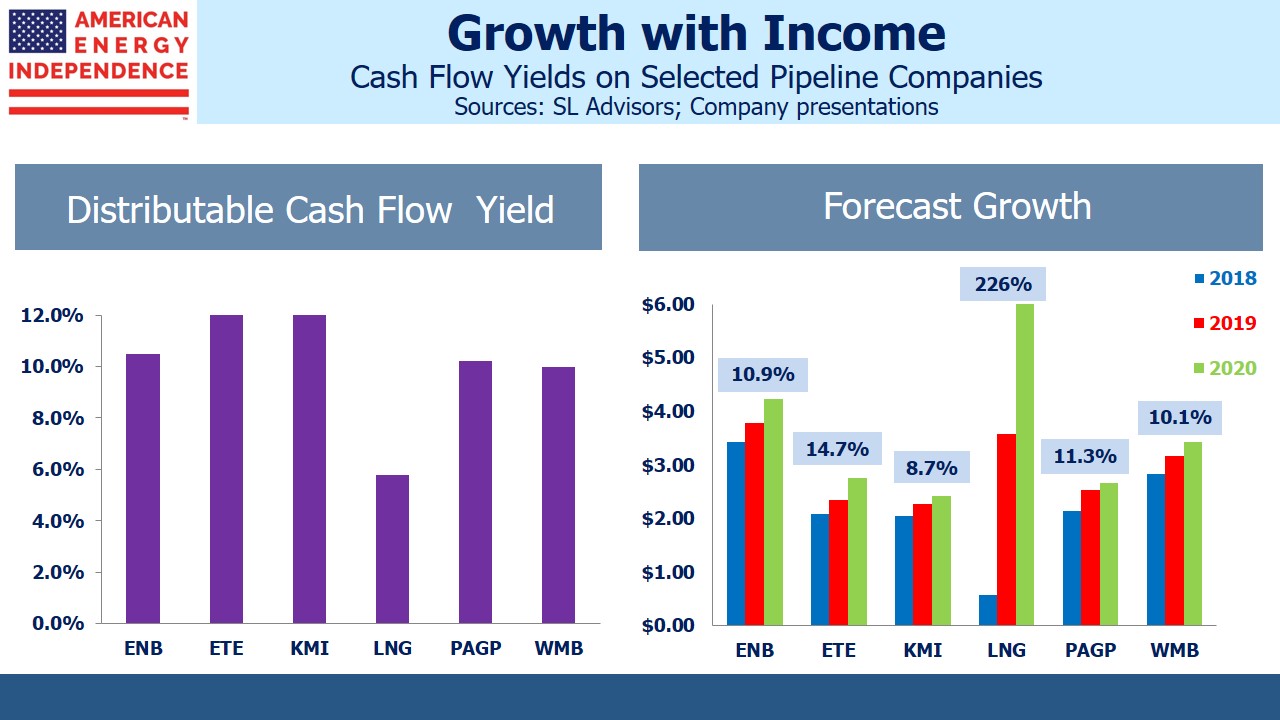
BofA Merrill is forecasting 2016-20 distribution growth for 27 of the 32 midstream infrastructure names they cover. JPMorgan forecasts 6-10% growth 2017-19. We expect our American Energy Independence Index to grow its dividends by 9% this year and 11% in 2019.

These forecasts are supported by growing pipeline demand. There are bottlenecks in moving crude oil and natural gas out of the Permian Basin in west Texas, and in getting natural gas out of the Marcellus in Pennsylvania. New pipelines to transport Canadian heavy oil from Alberta continue to face political challenges. The Shale Revolution is driving volumes higher.

With pipeline demand and dividends both growing, the sector is poised to continue its rally.

We are invested in KMI and PAGP. We are short AMLP.

Includes corrected text and a revised chart compared to an earlier version, with respect to Kinder Morgan


Running Pipelines is Easy

“A monkey could make money in this business right now.” Kelcy Warren, Energy Transfer Partners CEO, August 2nd, 2018.

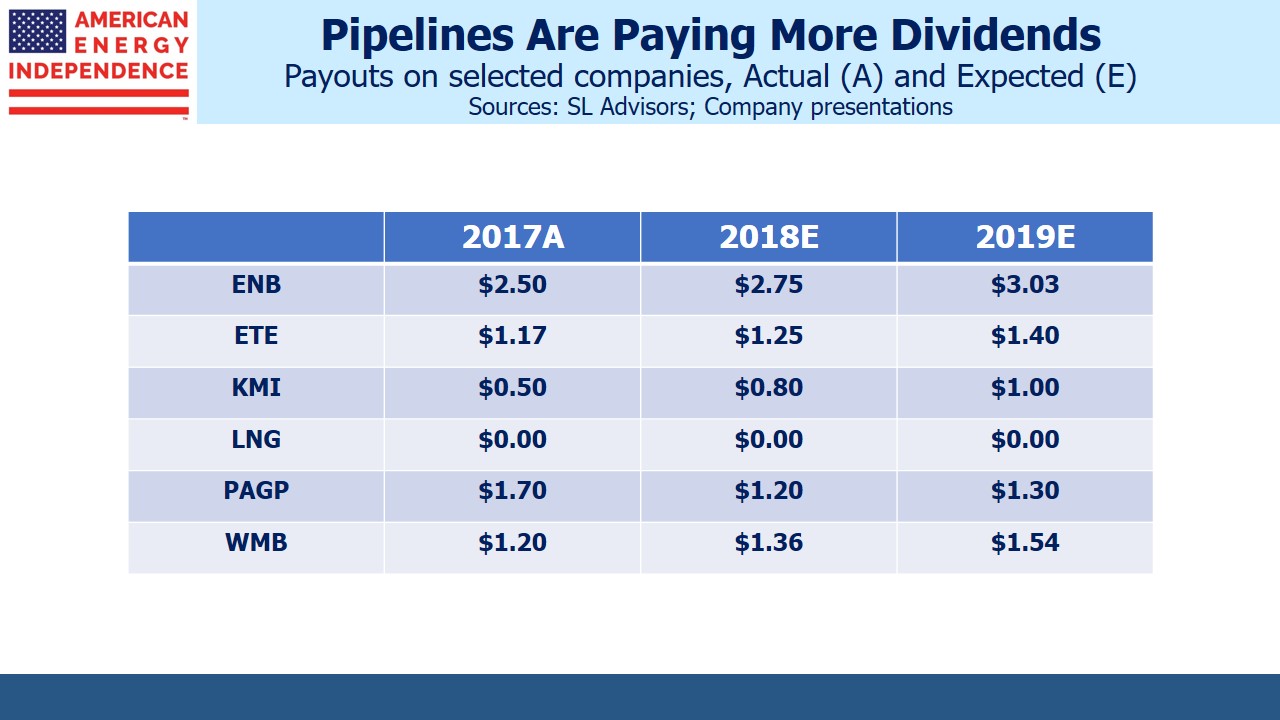
Presumably when Energy Transfer Partners (ETP) announces earnings next week they’ll be good. That was the clear message in the attention grabbing combination of ETP with its General Partner (GP), Energy Transfer Equity (ETE). The 1.28 exchange ratio represented an 11% premium but also a 30% distribution cut for ETP investors, given ETE’s lower payout. The new company anticipates coverage of 1.6X-1.9X by 4Q18, a Distributable CashFlow (DCF) yield of 11.5% based on its current price.

Kelcy Warren’s comment on favorable conditions contributed to positive sentiment across the sector, something that has been sorely missing until recently. Wall Street’s most recent solution to the weak MLP market has been eliminating the GP/MLP structure, and with it the Incentive Distribution Rights that boost the GP’s share of DCF. ETE endorsed that recommendation, but still retained some special rights through the issuance of “A” class shares to insiders. Overall though, we think this move shows ETE’s attractive valuation.

In 2Q results, pipeline companies reported earnings buoyed by higher volumes. Output of natural gas, Natural Gas Liquids (NGLs) and crude oil are all hitting new records. The U.S. is on track to be the world’s biggest oil producer by late 2019 – if infrastructure bottlenecks don’t delay that for a year.

As pipeline capacity out of the Permian Basin has dwindled, it’s caused a spectacular widening in regional differentials. Crude oil in Midland, west Texas is worth $17 less per barrel than in Cushing, OK. This reflects the cost of moving the marginal barrel, which has to go by truck since there’s no spare capacity on pipelines or railroads. This $17 differential is a thing of beauty to a pipeline owner with some uncontracted availability. For oil producers faced with unexpectedly steep shipping costs, it’s a hit to profitability. The larger companies tend to have committed transport which guarantees them access to market. For example, Devon Energy (DVN) reported realizations on crude oil production within 2% of the Cushing benchmark. It’s the smaller, more speculative companies that stand last in line.

Enterprise Products (EPD) reported Earnings Before Interest, Taxes, Depreciation and Amortization (EBITDA) of $1.767BN, $202MM ahead of consensus. One analyst announced, “EPD Embarrasses Street Estimates”, while his own equally inaccurate earnings forecast sat alongside an “Overweight” recommendation. Wrong, but right too.  EPD reported strong volumes across NGLs, crude, natural gas and propylene (feedstock can be ethane or propane).

EPD is the biggest MLP, and they’re succeeding by behaving like the corporation many of their peers have become. Although MLPs pay out 90% or so of their DCF, EPD sports a coverage ratio of 1.5X (i.e. pays out only two thirds). Consequently, they announced almost $500MM in retained DCF which they plan to reinvest in the business. While MLPs historically have funded growth with new issuance of debt and equity, EPD is self-financing. While they’re not planning to buy back stock, their 5.9% distribution yield compares favorably with the S&P500 yield from buybacks and dividends of 4.5%.

EPD hasn’t over-borrowed and then cut its distribution to fund growth, like many MLPs. By behaving unlike MLPs, it’s remained one, while many others have offended their investors and decamped in search of new ones as a corporation. American Midstream Partners (AMID) is a small MLP that shrunk further following a 75% distribution cut. They plan to redirect the savings, “…towards accretive growth projects and reduce debt.” Their income-seeking investors, now substantially deprived and less excited than management about this redirection of cash, let the stock fall 50%.

EnLink Midstream, LLC (ENLC), the GP of Enlink Midstream Partners (ENLK), beat EBITDA expectations by 5%, while raising guidance. This propelled both ENLC and ENLK sharply higher. Regrettably for the EPD analyst noted above, his miss on earnings was compounded with an Underweight on ENLC.

Oneok (OKE) reported increased pipeline utilization and modestly increased full-year guidance. Since absorbing their MLP last year OKE has become the poster child for such conversions, outperforming the Alerian MLP Index since then by over 35%. In the ensuing year OKE has announced $4.3BN of growth projects and in January issued $1.2BN in equity. Their Debt/EBITDA is down to 3.4X. Former Oneok Partners (OKS) investors endured an adverse tax outcome as they swapped their LP units for OKE shares, so at least the subsequent rally offers some vindication.

Williams (WMB) met expectations but guided to higher capex on new projects. Investors liked the prospect of accretive growth and drove the stock up 3%.

Crestwood (CEQP) raised guidance again, continuing a strong run of operating performance under CEO Bob Phillips.

It was hard to find any bad news in energy infrastructure. The sector also diverged pleasingly from the S&P500 Energy ETF (XLE), as mixed earnings from large producers such as Exxon Mobil (XOM), Conoco Phillips (COP) and Devon Energy (DVN) weighed.

If MLPs had all behaved like EPD, and unlike AMID, there would be more MLPs today. Elliot Miller is a frequent commenter on our blog. We had the opportunity to meet Elliot in person in May, at the Orlando MLP and Energy Infrastructure Conference. Elliot is a very thoughtful investor who gently chides us from time to time for not being more constructive on MLPs. We attended a couple of investor events with Elliot, and his pointed questions were well-aimed and entertaining. He’s right that MLPs’ enhanced tax status gives them an advantage, and Elliot might agree that EPD represents investor-oriented management at its best. ETE clearly intends to retain the tax benefits of an MLP as well.

Just as too few MLPs have behaved like EPD, there are too few Elliot Miller-like investors willing and able to do careful research. Many traditional MLP investors are disillusioned with distribution cuts to fund growth (see Will MLP Distribution Cuts Pay Off?). More Elliots would have led fewer MLPs to convert to corporations.

Many potential buyers are attracted by valuations but fearful of a repeat of the 2014-16 collapse. We’ve long maintained that this was chiefly caused by issues of financing growth, with midstream operating performance back then remaining generally satisfactory. Valuations are good, and corporate dividends growing. The corporate-heavy American Energy Independence Index has seen 9% dividend growth year-on-year, with >10% likely next year.

As the memories of the ‘14-‘16 sell-off recede and increased hydrocarbon throughput continues to drive profits, additional investors will be drawn to the sector.

We are long CEQP, ENLC, EPD, ETE,  OKE, WMB.


Uncle Sam Helps You Short AMLP

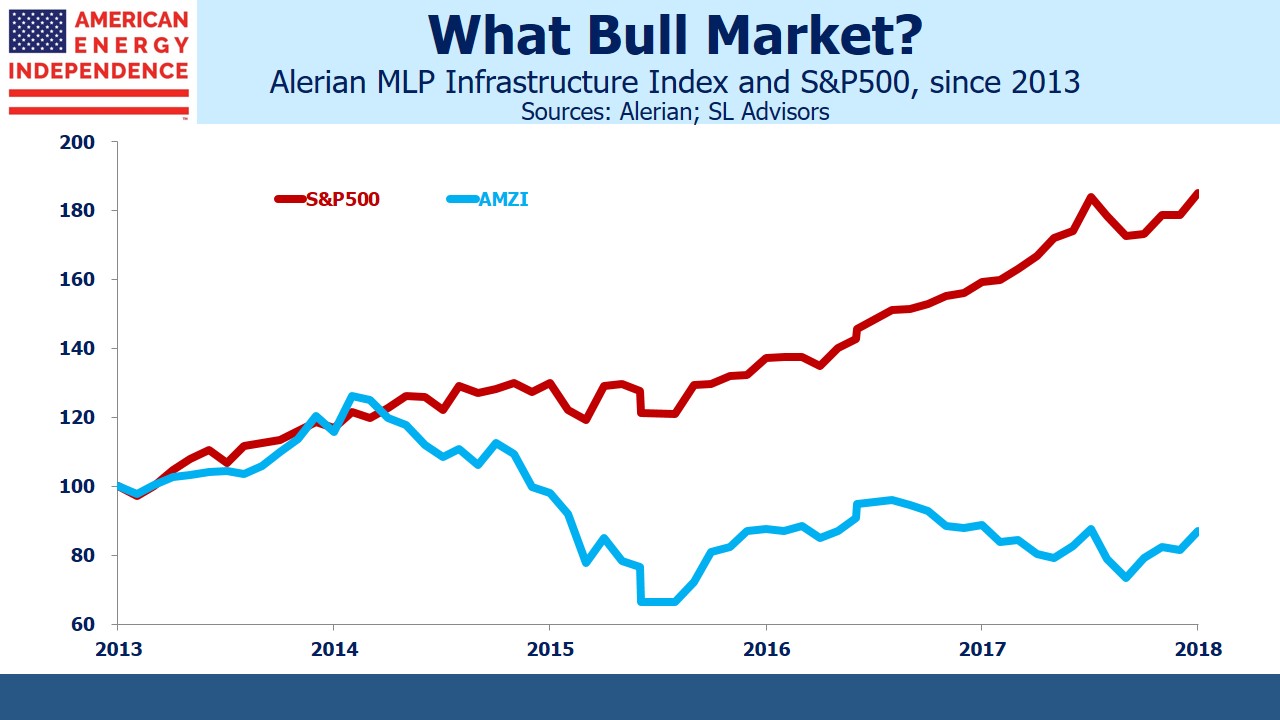
The Alerian MLP ETF (AMLP), with its tax-burdened structure (see AMLP’s Tax Bondage), is by design unable to come close to the return on its benchmark, the Alerian MLP Infrastructure Index (AMZI). Because AMLP doesn’t qualify for treatment as a Regulated Investment Company (RIC), it’s subject to corporate income taxes just like any other corporation. The fund’s tax liability has acted as a substantial drag on returns; since inception in 2010, it has returned just 1.99% (through June 30th), less than half its benchmark of 4.39%.

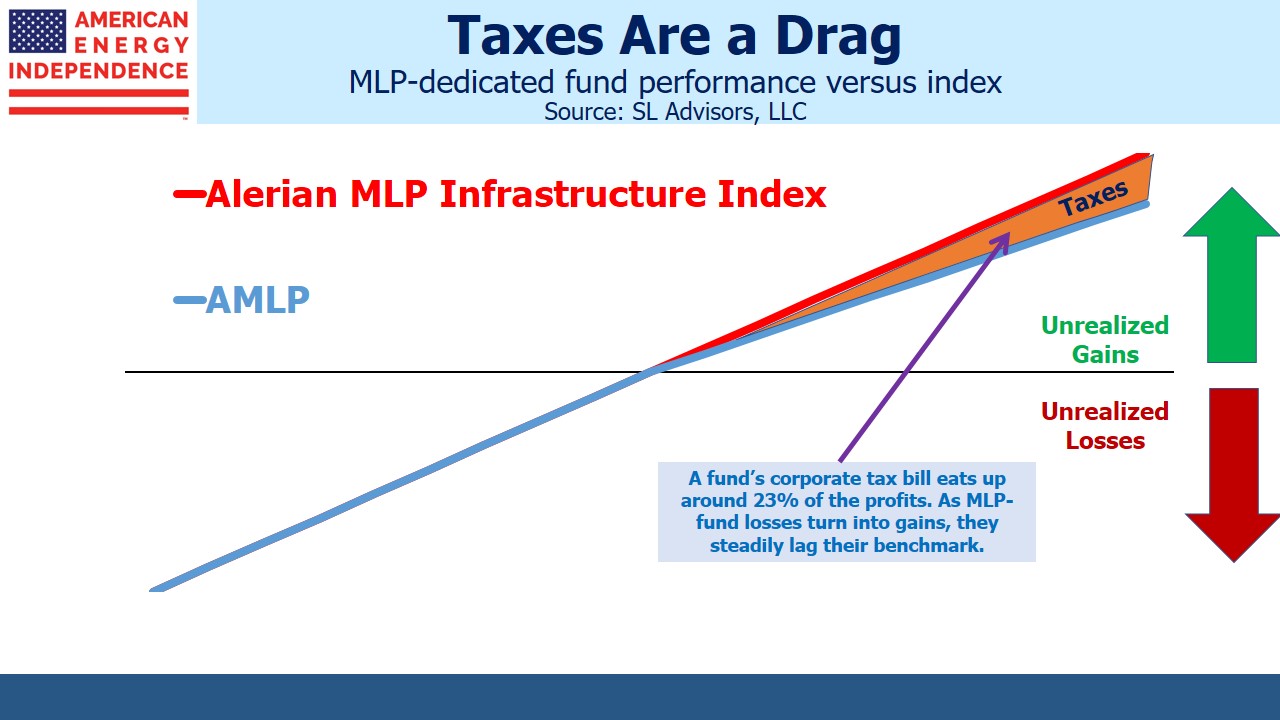
When AMLP’s portfolio rises, its NAV lags by the amount of the additional tax liability. When its holdings fall, AMLP reduces its taxes owed which cushions the blow somewhat. In fact, the tax drag acts to dampen its volatility. Tax-impaired returns ought not to be that attractive, although occasionally an investor notes that he likes the resulting lower volatility. While MLPs have been choppy in recent years, embracing this type of tax-encumbered, reduced price movement seems wrongheaded; after all, AMLP holders presumably expect a positive return, and the tax structure lowers it.

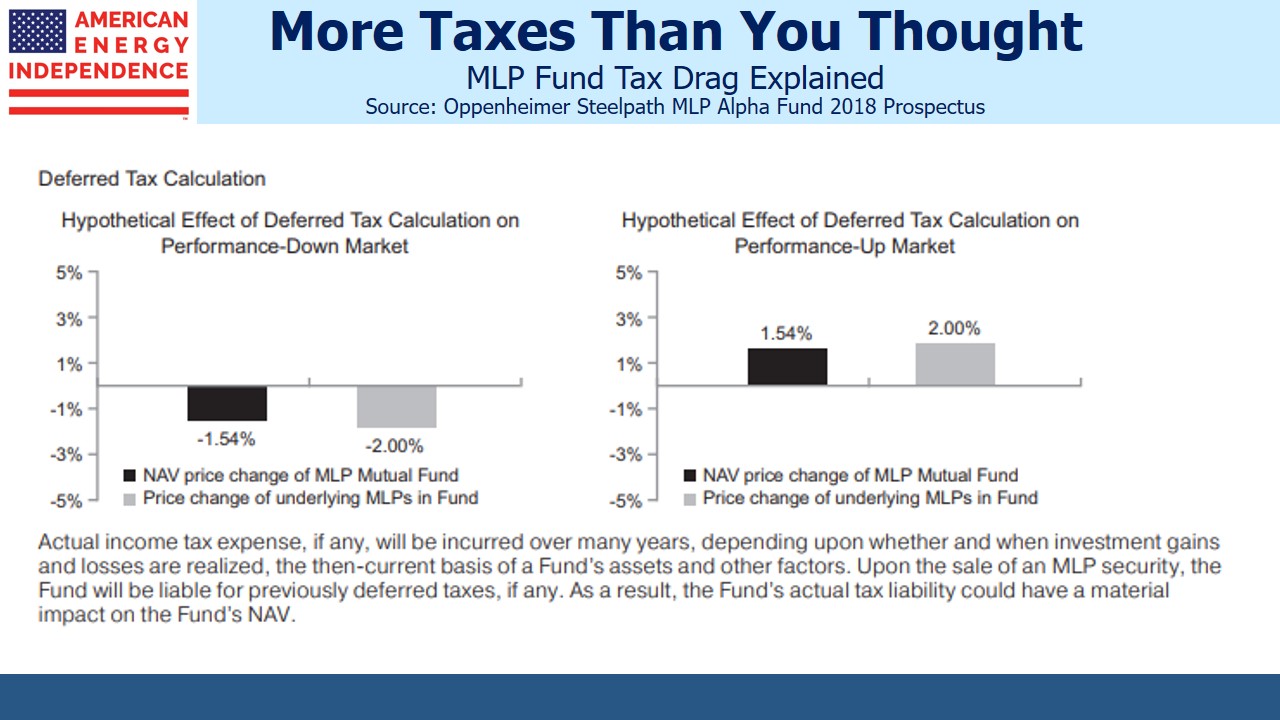
AMLP is simply the biggest of around $50BN in flawed funds. The chart below is from an Oppenheimer prospectus which helpfully explains how taxes hurt returns on their funds.

.avia-image-container.av-46wqn4-5ff82a133333ab5af23ae337652e062c img.avia_image{ box-shadow:none; } .avia-image-container.av-46wqn4-5ff82a133333ab5af23ae337652e062c .av-image-caption-overlay-center{ color:#ffffff; }

In an additional wrinkle to the pay-off profile, taxes only accrue when AMLP has unrealized gains. In such cases it holds a Deferred Tax Liability (DTL). When it has unrealized losses, as currently, it doesn’t accrue a tax loss carryforward, or Deferred Tax Asset (DTA). At such times the tax-induced low volatility disappears, and AMLP moves up and down with the market.

.avia-image-container.av-26c7ps-b393e982f1fd97dca9b32d1465a42963 img.avia_image{ box-shadow:none; } .avia-image-container.av-26c7ps-b393e982f1fd97dca9b32d1465a42963 .av-image-caption-overlay-center{ color:#ffffff; }

We are approaching an inflection point. AMLP’s unrealized losses are shrinking as the sector grinds higher. Its current DTA (which is offset with a valuation allowance, thus negating it) will flip to a DTL with the next 4-5% rise in its portfolio. At that point, further gains will trigger taxes owed. Its modestly lower volatility will return. With an approximate tax rate of 23%, AMLP will provide its holders with only 77% of the upside or all of the downside.

Like the approach of a surfer’s perfect wave, this situation offers the AMLP short-seller a rare, asymmetric opportunity. Just as an AMLP holder is accepting diminished upside for full downside risk, the AMLP short will enjoy the complete benefit on the downside with constrained losses on the upside. Combining a short AMLP with a diversified long position in energy infrastructure names or a properly structured, RIC-compliant, non-tax-burdened fund creates an interesting trading opportunity.

Such a long/short portfolio should be profitable in a rising market and roughly breakeven in a down market. There are financing costs, but AMLP has $10BN outstanding and so is not that hard to borrow.

Because AMLP is 100% invested in MLPs, a diversified long portfolio that includes energy infrastructure corporations further allows the investor to bet on a continued shrinking of MLPs as a subsector of energy infrastructure. As the biggest MLPs convert to corporations where they can access a far bigger set of buyers, this leaves fewer names with a lower median market cap (see Are MLPs Going Away?). MLP fund investors face the additional risk that one of the larger funds elects to drop the tax burden by selling 75% of its MLPs, becoming RIC-compliant. This could depress MLPs and hurt valuations of all MLP-dedicated funds.

This kind of asymmetry has value. Option premiums reflect the substantial upside/downside difference for the holder. Long-dated bonds (most dramatically, zero-coupon bonds) also offer a modest amount of asymmetry due to convexity, which causes investors to drive their yields somewhat lower than they’d otherwise be. In theory, AMLP should trade at a discount to NAV because of its tax-driven asymmetry, reducing the benefits of shorting and providing some additional return to holders to compensate for its flawed structure. Because the AMLP short is receiving the benefit of the tax drag, it’s one of the few ways you can really get Uncle Sam to work for you.

The benefits of shorting AMLP highlight the diminished return prospects of the holders. There are several other similarly tax-impaired funds, including mutual fund products from Oppenheimer SteelPath, Cushing Mainstay and Goldman Sachs, and a couple of small ETFs. While none of these are short candidates, they all suffer from the same structural flaws as AMLP. Their holders are unlikely to enjoy returns close to the indices, even while they incur unimpeded downside risk.

MLP-dedicated funds are unique in owing taxes at the fund level. Fund investors seeking energy infrastructure exposure should select a RIC-compliant, non-tax paying fund with less than 25% in MLPs.

We are short AMLP.

We have three funds that seek to profit from this environment:

Energy Mutual Fund

Energy ETF

Real Assets Fund


FERC Boosts MLPs

The Federal Energy Regulatory Commission (FERC) became MLP investors’ new BFF last week. Only four months ago, FERC’s revised policy on allowing imputed tax expense in setting tariffs caused a memorable intra-day 10% drop and contributed to dismal 1Q performance (see FERC Ruling Pushes Pipelines Out of MLPs). Ever since, MLP investors have regarded FERC warily, sensitive to additional market shocks. Cost-of-service pipeline contracts, historically common but rare nowadays and the source of much of this volatility, are unlikely to be employed in the future.

The clarification issued last week was unambiguously, if modestly, good. MLPs are still not allowed to include taxes paid by their equity investors as an operating cost in calculating applicable rates on interstate natural gas pipelines. But they can now include taxes paid by a corporate parent (if they have one), a feature omitted from the March announcement. Moreover, Accumulated Deferred Income Tax (ADIT), which most natural gas pipeline MLPs had built up, will no longer have to be refunded to customers. This had been recorded as an income tax liability using accelerated depreciation, offset by cash received from customers on cost-of-service contracts that relied on straight-line depreciation.

Depending on timing, some firms had accrued a significant net cash benefit and faced the prospect of returning this excess to customers. One research firm estimated the sums involved in the $BNs, in effect a retroactive fee adjustment. This possibility has now been eliminated.

By excluding ADIT, pipelines will show more equity invested which will in turn lower their Return on Equity (ROE). Typically, a pipeline tariff is deemed “fair and reasonable” if it generates a 10-16% ROE.  The net result will be that some contracts will fall below the threshold, reducing the likelihood of lower rates and even opening the door to bigger rate increases.

Since 2014 when Kinder Morgan (KMI) led the way, large MLPs have been converting to corporations in order to access a broader set of equity investors (see Corporations Lead the Way to American Energy Independence). More recently, Enbridge (ENB) and Williams Companies (WMB) both announced plans to roll up their MLP affiliates. TransCanada (TRP) told investors that financing assets at their MLP, TC Pipelines (TCP), was no longer viable.

Uncertainty around future FERC policy guidance tipped the scales for these conversions. But many other incentives to abandon the MLP structure and become a corporation remain. These include: onerous profit sharing with the GP (known as high IDR splits) which makes raising equity capital more expensive; potential tax shields at a corporate parent, reducing the tax advantage of being an MLP; the small investor base for MLPs (buyers are mostly old, rich American taxpayers); limited opportunities to drop down assets from parent; unfavorable rating agency treatment of debt due to the complexity of structure; and poor corporate governance rights.

Investors in Boardwalk Partners (BWP) probably received the worst FERC-induced outcome. The March policy statement depressed BWP’s stock price, letting Loews (the General Partner or GP) trigger an obscure clause in their Limited Partnership Agreement. This allowed them to  buy-in all the outstanding BWP units at their recent average price ($12.06), close to its all-time low. Only five years ago BWP was trading over $30. The Loews buy-in relied on a legal opinion that March’s announcement was an adverse regulatory ruling harmful to their business. The buy-in transaction duly closed last week, conveniently just before FERC’s revised policy guidance which would likely have nullified the legal opinion on which the buy-in relied. This is an example of the weak governance to which MLP investors subject themselves when there’s a controlling GP. Former BWP holders will join the growing list of MLP critics.

Investors welcomed the bounce. FERC solidified its reputation for unpredictable rulings that roil the market. But for CFOs trying to optimize their financial structure, their regulator’s market moving pronouncements aren’t helpful. The 202-page policy notice was accompanied by a concurring statement (rather like a dissenting opinion in a Supreme Court ruling) from the two Democrat commissioners. They noted that, “today’s order is simply guidance” and that individual rate cases would be judged on their legal merits.

Although the economics for MLP-owned natural gas pipelines are better than before, it’s unlikely that any MLP that’s converted to a corporation is regretting it. WMB will have to re-examine its previously announced roll-up of WPZ, but will also have to consider a somewhat capricious regulator whose direction may change again following the next general election in 2020.

East Daley released analysis showing that Williams Partners (WPZ) might be better off remaining separate from its corporate parent, WMB. They showed the treatment of TransCo’s pipeline network (WPZ’s principal asset) before and after the policy update, with an almost 5% swing in calculated ROE. The new, lower return supports the case for higher tariffs, which is why MLPs rose.

Interestingly, although Thursday was a good day for the sector, the Alerian MLP ETF (AMLP), which is 100% MLPs, saw net redemptions of $100MM. The FERC news raised prices but didn’t induce new buying. A week of arcane accounting developments (ADIT) and obscure adverse legal clauses (BWP) showed that MLPs are complicated.

In other news, KMI’s 2Q earnings were modestly better than expected. Of note was a 12% increase in volumes of natural gas, reflecting growing U.S. production. It also looks likely that the $2BN proceeds of their sale of the TransMountain pipeline to Canada’s Federal government will be used to pay down debt. Like most midstream energy infrastructure businesses, KMI is far more stable than their stock price would imply. Its Distributable Cash Flow (DCF) is on target to reach $4.6BN this year, up 3%. Since 2014, its worst result has been a 4% decrease.

.avia-image-container.av-2gzvdm-1e0e6ae97c75aba8656d233ae7222cb1 img.avia_image{ box-shadow:none; } .avia-image-container.av-2gzvdm-1e0e6ae97c75aba8656d233ae7222cb1 .av-image-caption-overlay-center{ color:#ffffff; }

Nonetheless, KMI’s stock has taken investors on a wild ride. In spite of their steady DCF, in late 2015 they slashed their quarterly dividend by 75% from $0.50 to $0.125, so as to redirect cash towards growth projects and pay down debt. It was a move that many others followed. Today, its payout is at $0.20 and is 2.4X covered by DCF. Decisions on how to finance their business were far more impactful than operating performance, which is why it sports an 11.5% DCF yield, awaiting buyers from more expensive sectors.

In many ways KMI is reflective of the sector.

We are invested in ENB, KMI, TRP and WMB. We are short AMLP.


Is Shale Driving Oil Higher?

Could the Shale Revolution be driving oil prices higher? It seems counter-intuitive – the U.S. is on course to be the world’s biggest oil producer by next year. And it was the additional shale supply that led to the 2014-15 oil collapse.

Yet, a growing chorus of industry voices is warning of an impending supply squeeze. This includes the Saudi Energy Minister, Khalid A. Al-Falih, who recently expressed concern about shortages of spare crude oil capacity. Last week David Demshur, CEO of oilfield services company Core Laboratories (CLB) forecast oil at $100 a barrel. He cited declining output in many key conventional plays globally, even while U.S. output is growing strongly. The International Energy Agency added their warning that, “…the world’s spare capacity cushion…might be stretched to the limit.”

Part of the problem relates to supply disruptions. Venezuela’s output continues to plummet because of chronic underinvestment. Renewed sanctions on Iran are impeding their exports sooner than expected. Saudi Arabia has promised to increase output to offset the loss of Iranian crude, but many question their ability to sustain output much above 11 Million Barrels a Day (MMB/D).

Meanwhile, global oil demand is expected to grow at around 1.5-1.7 MMB/D over the next year. Depletion of existing fields, estimated at 3-4 MMB/D annually, is worsening according to some observers. So the world needs at least 4-6 MMB/D of new supply to balance current consumption of around 98 MMB/D. Concern is growing of a shortfall.

.avia-image-container.av-2dsjz8-10ff81c02ae115ca3e04a23de55eef24 img.avia_image{ box-shadow:none; } .avia-image-container.av-2dsjz8-10ff81c02ae115ca3e04a23de55eef24 .av-image-caption-overlay-center{ color:#ffffff; }

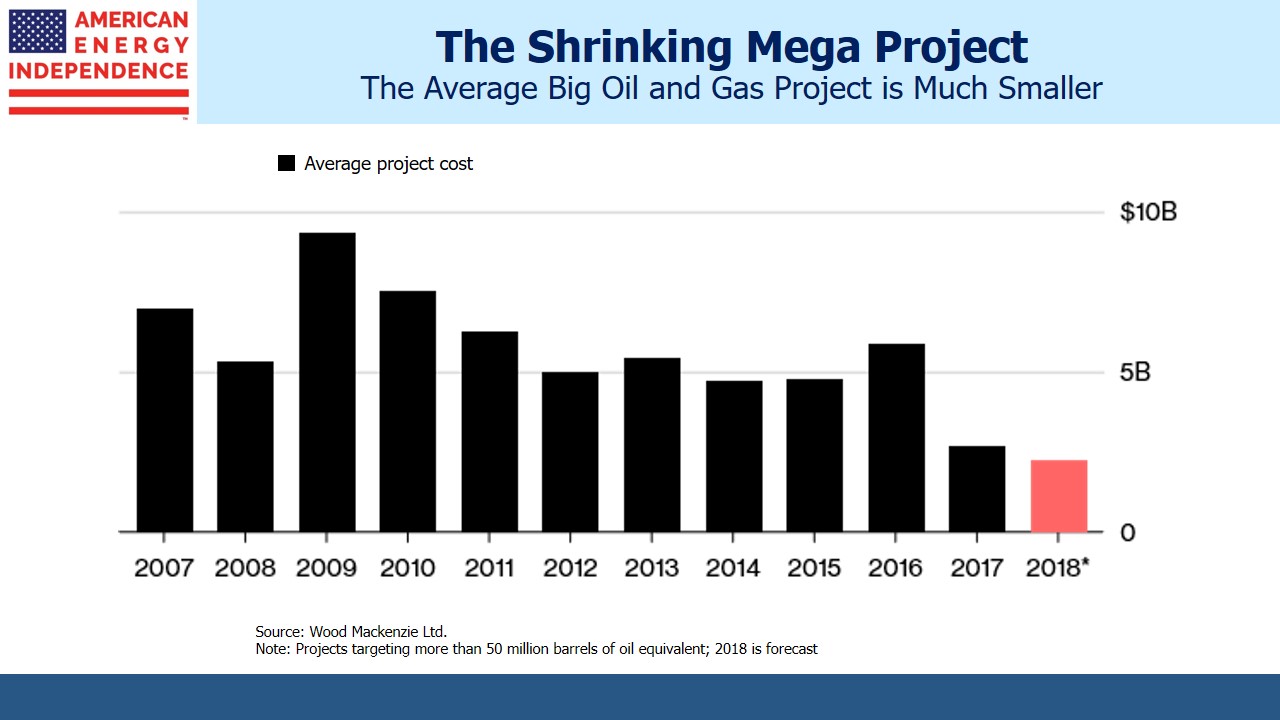
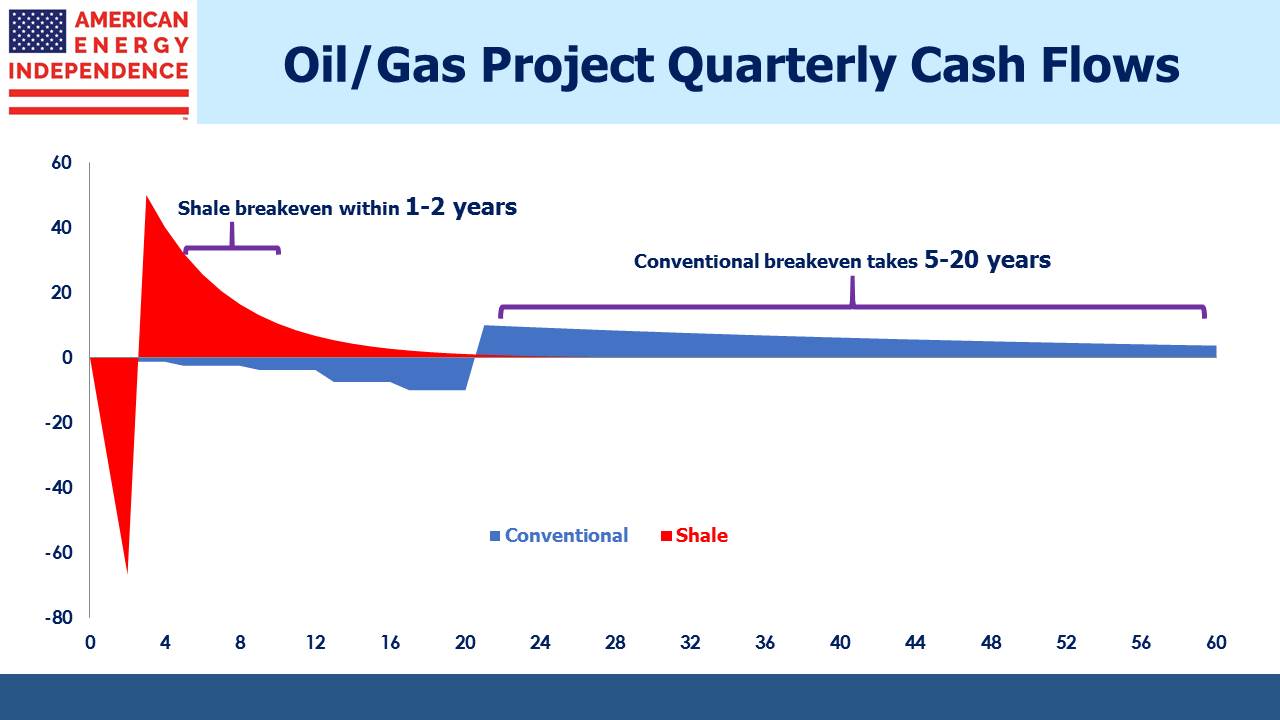
Although blaming the Shale Revolution for a looming supply shortage sounds implausible, Shale’s lower risk profile is drawing capital investment away from conventional projects. You can see this in Exxon Mobil’s (XOM) five year plan to commit $50BN to North American oil and gas production. You can also see it in the dramatic decline in the size of large projects. As we’ve noted before (see The Short Cycle Advantage of Shale) conventional oil and gas projects take far longer to return their capital invested than shale projects.

.avia-image-container.av-20dg04-62113904f0dc859d621af104e8783c4a img.avia_image{ box-shadow:none; } .avia-image-container.av-20dg04-62113904f0dc859d621af104e8783c4a .av-image-caption-overlay-center{ color:#ffffff; }

The energy business has always been cyclical for this reason, because of the supply side’s slow response function. Shale’s ability to recalibrate output much more responsively to price can smooth out the cycle, if there’s enough short-cycle supply available. But there isn’t. North America is the major source of such projects and virtually the only source of shale activity. Rising U.S. output is nonetheless insufficient to provide adequate supply.

Conventional projects have always had to consider macro factors, such as global GDP growth, commodity prices and production cost inflation before committing capital. Add to those the likely path of government policies aimed at curbing fossil-fuel related global warming, and the unknown pace of technological improvement with electric vehicles. Today it’s probably as hard as it’s ever been to confidently allocate capital to a conventional oil or gas project with a 10+ year payback horizon.

Moreover, short-cycle projects like Shale lurk in the background, capable of wrecking the market with oversupply, yet able to protect themselves by quickly curtailing production.

This uncertainty is limiting the commitment of capital to conventional projects. If the warnings are prescient, oil prices will rise to a level that induces more investment back in to conventional projects. The market will self-correct. But it’s looking increasingly likely that higher prices will be required in the meantime.


New Pipeline Investment Roars Back

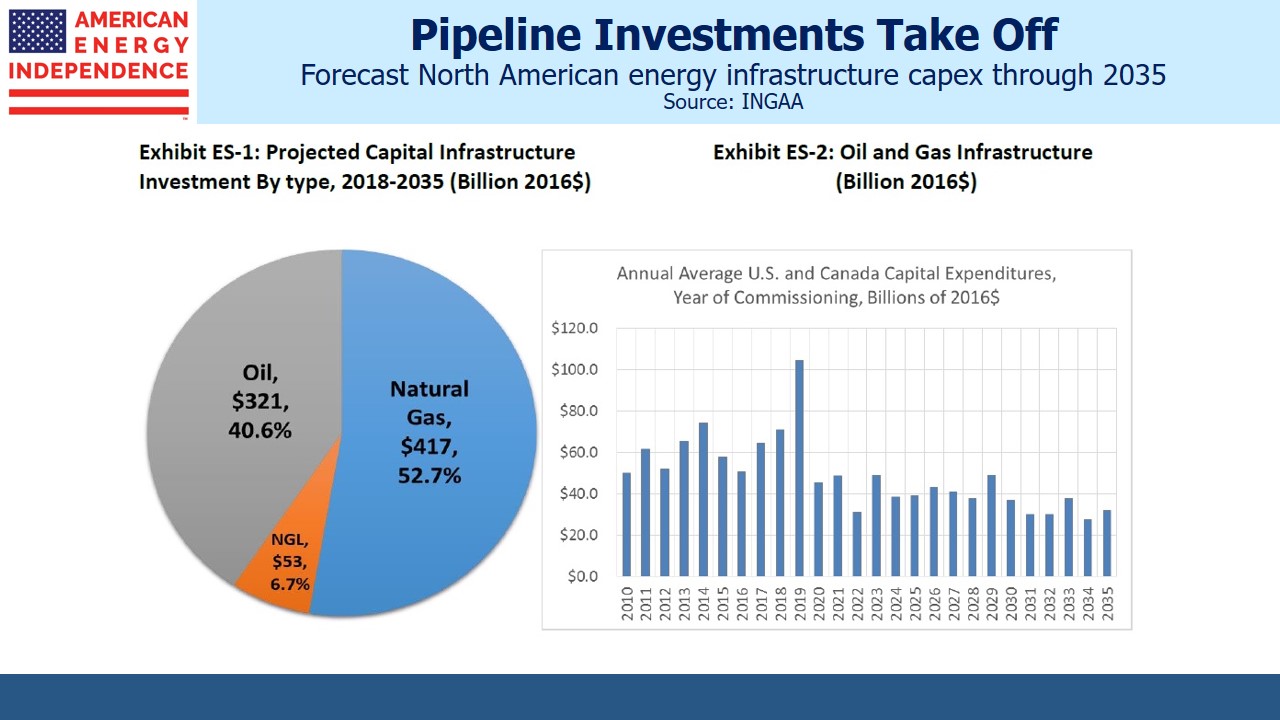
In recent years as MLP investors balked at providing the growth capital sought by midstream energy infrastructure, the biggest companies have been converting to corporations (see MLPs Searching for a New Look). The collapse in MLPs during 2014-15 slowed investment, subsequently causing many of the biggest companies to simplify as they concluded that the MLP investor base was too narrow. This shift away from MLP buyers (mostly older, wealthy Americans) to the global equity investor is evidently working, at least based on one trade group’s forecast of new investment. The Interstate Natural Gas Association of America (INGAA, not limited to natural gas in spite of their name) lobbies for industry-friendly policies and produces long term forecasts of midstream infrastructure investment in the energy sector. They see a bright future for North America.

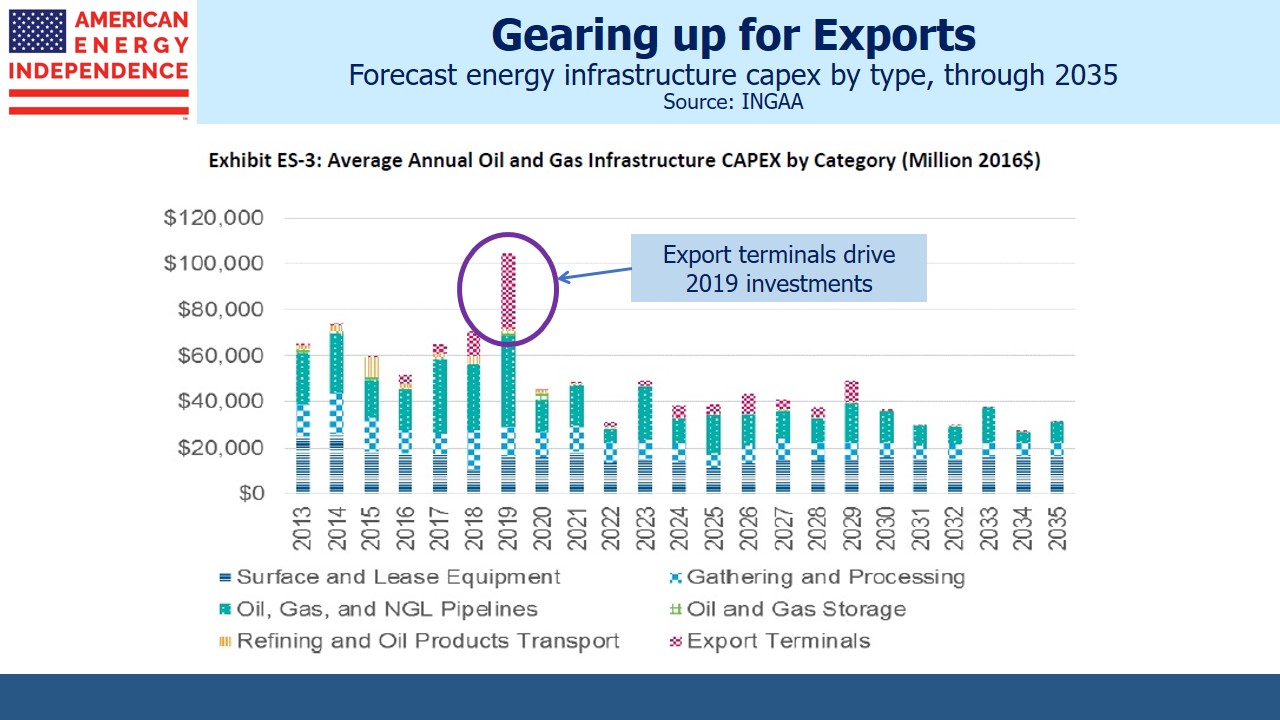
Given the renewed focus in recent years on prudent distribution coverage with lower leverage, it’s striking that 2019 is likely to be a record year for investment in new capacity. Following two years of decline as companies grappled with income-seeking investors unwilling to finance growth, in 2017 capex rebounded. The recovery has continued strongly, driven in large part by increasing export capacity for crude oil, Natural Gas Liquids (NGLs) and natural gas. The path to American Energy Independence is paved by such investments.

.avia-image-container.av-3skef4-6e7613cde42db8d29a897566e611c998 img.avia_image{ box-shadow:none; } .avia-image-container.av-3skef4-6e7613cde42db8d29a897566e611c998 .av-image-caption-overlay-center{ color:#ffffff; }

It’s interesting to compare INGAA’s current forecast with their prior one, which we covered two years ago (see There’s More to Pipelines Than Oil). INGAA has modified their format and their forecast period covers a slightly shorter time period. But after adjusting for differences, we find INGAA’s latest projection to be 39% higher than their 2016 Upside Case, at $44BN of annual investment.

It’s a remarkable statement about the resilience of the Shale Revolution and how America’s Energy Renaissance is evolving. INGAA’s prior report reflected the still raw memories of the 2014-15 energy recession, when questions lingered about the sustainability of the new, unconventional production.

Today, with production of crude, natural gas and NGLs all hitting records, there can be little doubt that the industry has shifted to an era of long term growth.

Natural gas continues to command over 50% of new investment. Although movements in crude oil pricing continue to drive short-term sector returns, natural gas remains the more important commodity. Exports, by pipeline to Mexico, and as Liquified Natural Gas (LNG) globally, are both set to rise sharply in the years ahead. Net U.S. LNG exports in 2035 are forecast to reach 12 Billion Cubic feet per Day (BCF/D), from around 1.3 BCF/D currently. Overall, North American natural gas output should rise 2% annually, from 91 BCF/D to 130 BCF/D. Natural gas use in the power sector is also expected to show healthy growth, both as coal-fired plants are retired and as a backup for renewables. We’ve long asserted that natural gas is critical to increased use of renewables, to provide baseload power for when it’s not sunny and windy.

.avia-image-container.av-25a9ps-6ce117a8455e1128a92cf965f1d60d84 img.avia_image{ box-shadow:none; } .avia-image-container.av-25a9ps-6ce117a8455e1128a92cf965f1d60d84 .av-image-caption-overlay-center{ color:#ffffff; }

NGLs receive far less attention than crude oil or natural gas, but ethane and propane are key feedstocks for ethylene and polypropylene (different types of plastics) respectively. U.S. NGL production is expected to double by 2035, to 6.6 MMB/D, with exports also doubling to 2 MMB/D.

Although the U.S. is already energy independent, in that we produce more total energy on a BTU-equivalent basis than we consume, the popular measure relates to crude oil independence. Industry forecasts of the date when the U.S. reaches that milestone generally fall between 2025 and 2030. Because crude oil comes in hundreds of grades, we’ll continue to import the heavy crude favored by U.S. refineries even while net exports triple, from 0.5 MMB/d to 1.5 MMB/D. Another favorable development will be a halving of non-Canadian imports, further lessening our dependency on unstable regions and unfriendly governments. More than 100% of the growth in U.S. crude production is expected to come from the Permian, Niobrara and Bakken formations.

Given this outlook, it’s clear why many large MLPs have converted to corporations. They need a financial structure that will support growth plans. Investment bankers will find much in INGAA’s report to get them excited, since capex implies ongoing debt and equity issuance. For investors though, the new projects will need to generate a return above their cost of capital. That’s what will determine whether INGAA’s report is truly exciting.

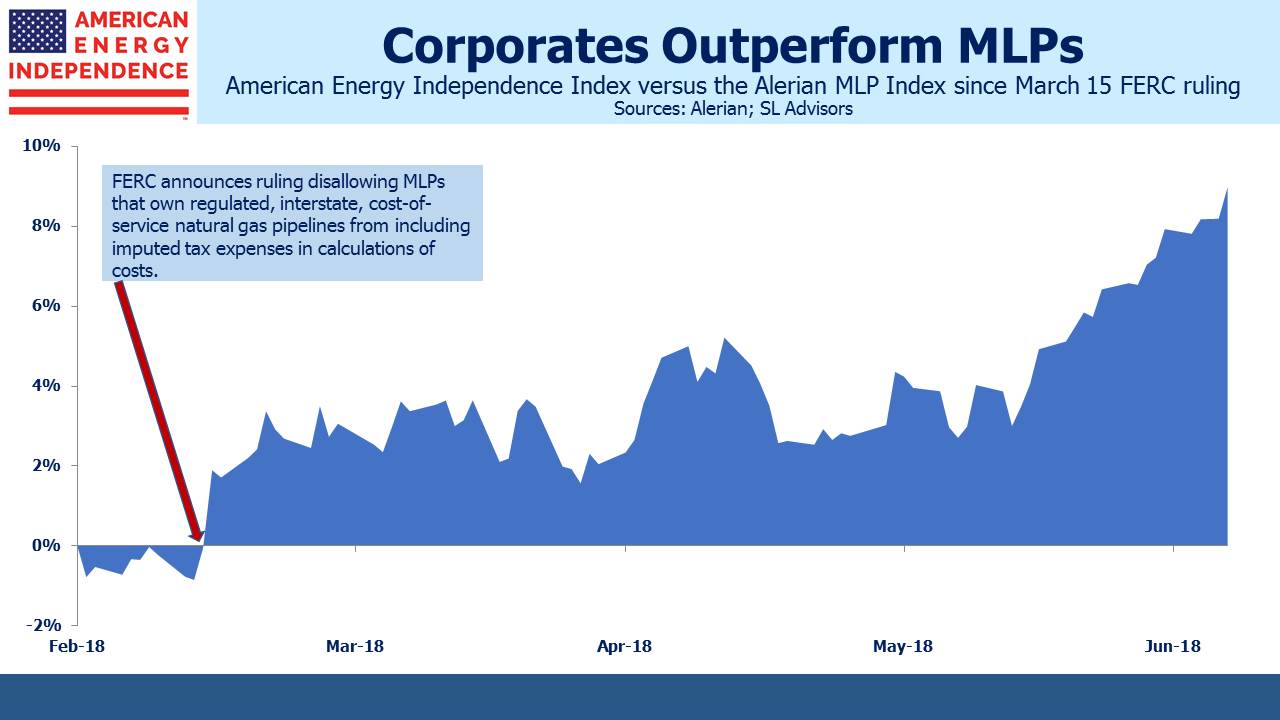
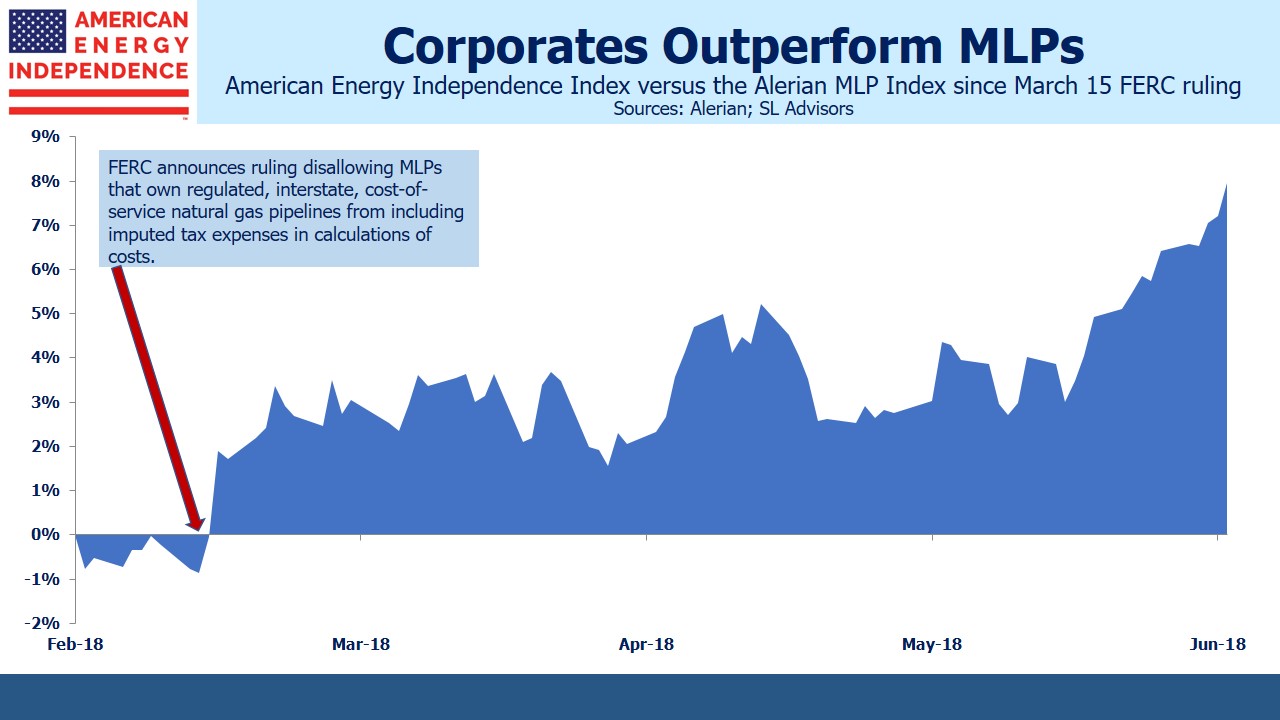
Last week the corporate-heavy American Energy Independence Index added another 1% to its outperformance of the MLP-only Alerian MLP Index, reaching a 9% difference since the March FERC decision cast doubt on the MLP structure for certain companies.

.avia-image-container.av-2dxhf4-69060bc674272246105804598c2f5f6c img.avia_image{ box-shadow:none; } .avia-image-container.av-2dxhf4-69060bc674272246105804598c2f5f6c .av-image-caption-overlay-center{ color:#ffffff; }


Old Style MLP Funds Get Left Behind

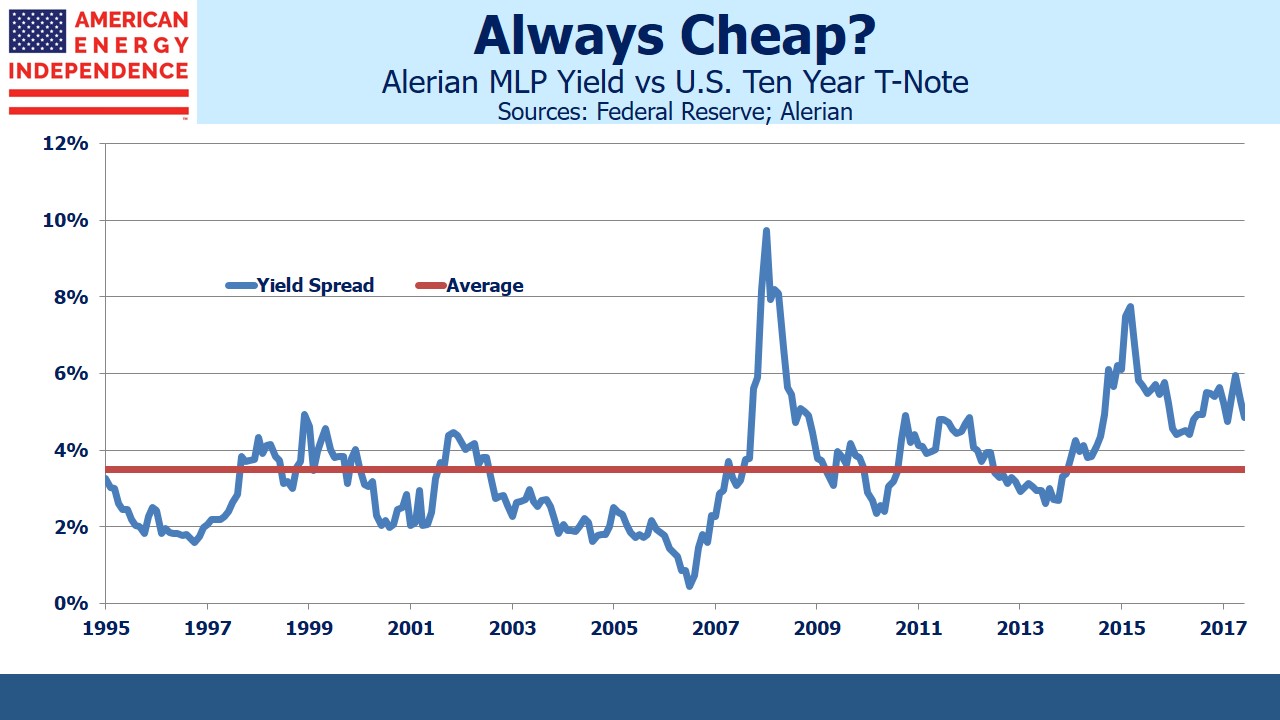
Although MLPs are cheap by historical standards, the persistence of their attractive valuation should prompt observers to think a little harder. The almost 5% yield spread between the Alerian MLP Index and ten year treasuries is 1.5% wider than the 20-year average of 3.5%. However, the MLP yield spread to treasuries has been historically wide since 2013.

.avia-image-container.av-294ath-3513f16f9ffbc66cd917546566bc86e9 img.avia_image{ box-shadow:none; } .avia-image-container.av-294ath-3513f16f9ffbc66cd917546566bc86e9 .av-image-caption-overlay-center{ color:#ffffff; }

What an investor regards as a cheap security is, for the issuer, an expensive source of capital. Market gyrations create opportunities, but a temporary mispricing can evolve into a permanent one. The buyers and issuers of such securities are in effect debating whether such a shift has occurred.

The list of companies concluding that a shift has occurred includes all those who have converted from the traditional MLP structure with a General Partner (GP) earning Incentive Distribution Rights (IDRs). In 2014 Kinder Morgan (KMI) became the first large MLP to decide that something fundamental had changed in the MLP investor, and converted to a corporation. As regular readers know, we believe the Shale Revolution upset the prior business model. Before hydraulic fracturing and horizontal drilling unlocked America’s enormous reserves of hydrocarbons, energy infrastructure companies had a limited need to reinvest profits.  Our existing network of pipelines, processing facilities and storage was adequate to the task. Hence, MLPs distributed most of their cashflow in a tax-advantaged form, which attracted income-seeking investors.

In recent years, unconventional oil and gas extraction from previously untapped areas has required new infrastructure. Financing this disrupted the high payout model, leading to distribution cuts which alienated long-time investors (see Will MLP Distribution Cuts Pay Off?).

KMI was followed by many other large MLPs (see What Kinder Morgan Tells Us About MLPs), eventually including Targa Resources (TRGP), Oneok (OKE), Tallgrass (TEGP), Williams Companies (WMB) and Enbridge (ENB). Although there were some differences in structure, all these companies ultimately sought access to the wide pool of global equity investors. They’ve moved beyond the older, wealthy Americans who had long held MLPs for income and didn’t mind the K-1s. This narrow pool of buyers was not suited to finance growth businesses.

The MLPs that converted to corporations, including those listed above, have explicitly acknowledged this inadequacy of the traditional MLP investor. Many of those companies who remain MLPs are nonetheless mindful that the structure may not always suit them. Crestwood (CEQP) CEO Bob Phillips has said, of conversion to a corporation, that, “we won’t be the first, but we won’t be the last either.” Every MLP CFO is regularly asked about their structure.

On the other side of the Corp vs MLP debate are the managers of MLP-dedicated funds, including the Alerian MLP Fund (AMLP), and numerous other tax-burdened vehicles (see MLP Funds Made for Uncle Sam).

While the biggest MLPs are converting to corporations, it isn’t easy for these specialized funds to follow them. A taxable MLP fund that invested in a taxable corporation, delivering taxable returns to investors, would look absurd. But converting an MLP-dedicated fund to a RIC-compliant structure would require dumping 75% of their portfolio in order to comply with the 25% limit on MLPs. This would be hugely disruptive. With over $50BN in various poorly structured vehicles, they must all be hoping that none of their peers decide to become RIC-compliant, because it would depress MLP prices and lead fund investors to fear that others would follow (see The Uncertain Future of MLP-Dedicated Funds).

Faced with unpalatable choices, the managers of such funds naturally enough like their MLP-only approach.

.avia-image-container.av-2aco1h-b804fd402cd0cf9e90f0f2e0b031a029 img.avia_image{ box-shadow:none; } .avia-image-container.av-2aco1h-b804fd402cd0cf9e90f0f2e0b031a029 .av-image-caption-overlay-center{ color:#ffffff; }

As the chart shows, since the FERC ruling in March which caused many to reconsider the MLP structure (see FERC Ruling Pushes Pipelines Out of MLPs), diversified energy infrastructure has handily beaten MLPs. The American Energy Independence Index (AEITR) consists mostly of U.S. and Canadian corporations as well as having 20% allocated to the largest MLPs.  Driven by its heavy exposure to corporations, the AEITR has delivered an 8% higher return than the Alerian MLP Index. Moreover, investors in AMLP and other MLP-dedicated funds have to contend with the corporate tax drag which further impedes their return. The broader investor base available to corporations means better liquidity, which in turn attracts additional capital. Clearly, the companies that converted from MLPs can feel their choice was vindicated. Even Alerian CEO Kenny Feng concedes that the midstream sector, “…is in a bit of an identity crisis.”

The lesson here is that when a sector stays cheap for an extended period of time, perhaps something has fundamentally changed. Along with many of the largest energy infrastructure corporations, we think it has.

We are invested in CEQP, ENB, KMI, OKE, TEGP, TRGP, WMB.

We are short AMLP.


How to Profit From MLPs Overnight

A few months ago the NYTimes ran an interesting piece on the difference between intra-day and overnight returns on the stock market. The article compared a strategy of buying on the open and selling every day at the close (“IntraDay”), with a strategy of buying on the close and selling the next morning at the open (“Overnight”). Using the S&P500 ETF (SPY), they found that the returns to the Overnight strategy easily beat the IntraDay one.

We looked at the figures ourselves using SPY back to 1993, and while we came up with different numbers the pattern is clear. The NYTimes piece omitted dividends, which would always accrue to the Overnight Strategy and not to IntraDay, since you have to own a security at the close of business on the record date to earn the dividend. So in this case and the one below, Overnight returns will be even better by the amount of the annual dividend.

The stock market is full of patterns, and identifying a profitable one takes far more than simply discovering one that’s worked in the past. For instance, the relative advantage of Overnight over IntraDay on SPY has declined over the years, probably because the hedge funds who look for these things long ago found it and started exploiting it. The best results came in the years either side of the dot.com bubble (1998-2002). Since the IntraDay strategy is by definition a day trade, the persistent success of Overnight versus IntraDay back then is probably a tangible measure of day traders gradually ceding their capital to more sophisticated participants.

It’s also important to identify a reason for any anomaly. A series of rainy Sundays tells you nothing about next weekend’s weather (correlation versus causality). There needs to exist some economic reason for the anomaly for it to continue. Is there a reason to expect persistence in the Overnight versus IntraDay phenomenon, even though the margin has diminished? The NYTimes article speculates that buying in the morning offers traders some ability to respond to adversity during the day, and that closing out a long position in the afternoon protects against an inability to immediately react to an overnight event causing losses. Since humans continue to be the ultimate investment decision makers, this is a plausible explanation.

.avia-image-container.av-2rk2o9-75f70bc78f1bf3bcae7666b555774574 img.avia_image{ box-shadow:none; } .avia-image-container.av-2rk2o9-75f70bc78f1bf3bcae7666b555774574 .av-image-caption-overlay-center{ color:#ffffff; }

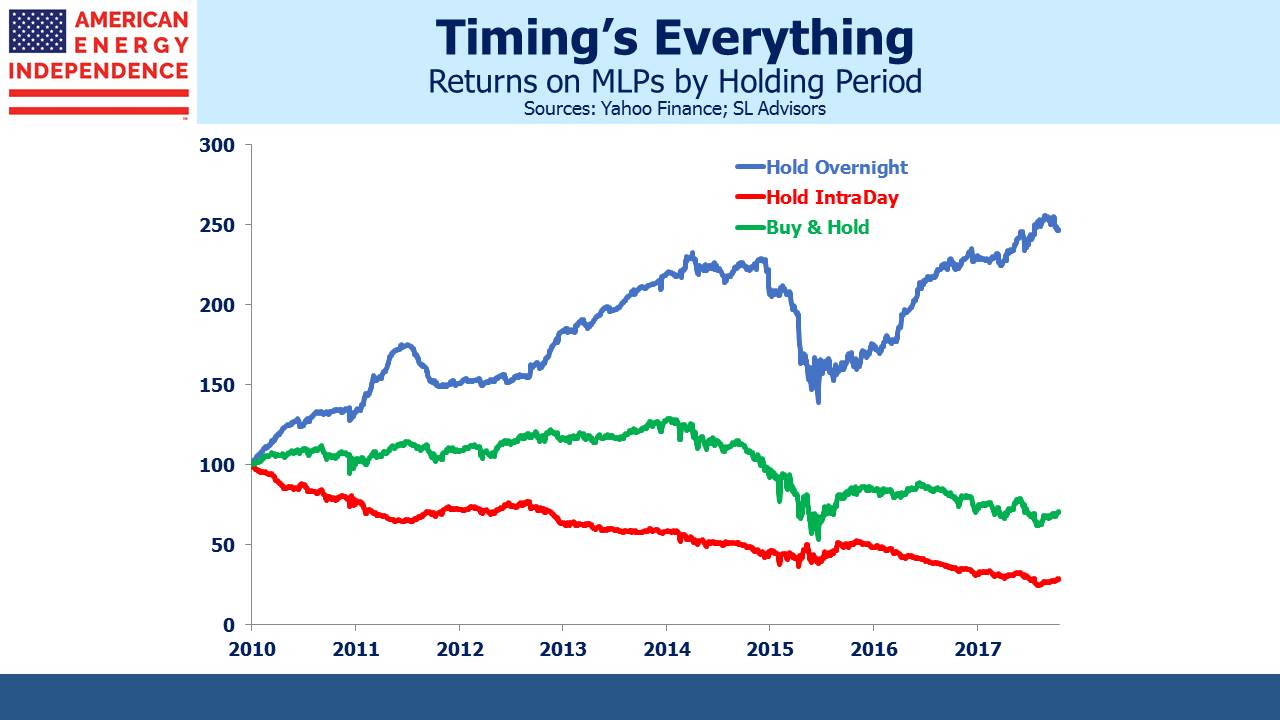
Because MLPs are more retail-dominated than the broader stock market, human foibles are more likely to show up there. The data doesn’t go back as far as SPY, but we looked at Overnight versus IntraDay using AMLP, which launched in 2010. The superiority of Overnight is far more significant than with SPY. Although AMLP has lost 29% of its value before distributions since 2010, the Overnight strategy grew by almost 150% while IntraDay lost 70% of its value. It looks as if MLP investors bounce out of bed full of optimism, only to have those positive feelings ground down by a sector that has regularly spent the trading day selling off from the open.

This means that if you’re considering investing in the sector, you may want to wait until the afternoon. Buyers tend to execute their intentions early. For this group, caffeine-fuelled exuberance gradually gives way to low blood-sugar despondency. After lunch, your buy order will face less competition. In energy infrastructure, it seems, your money really does work harder for you at night.

Put another way, a strategy of shorting AMLP intra-day would have generated a positive return of 150% before transactions costs over the past seven years. Unfortunately, transactions costs of even 0.025% per trade (i.e. 0.05% daily) wipe out the profit. AMLP remains a good short (see MLP Funds Made for Uncle Sam) because of its structural deficiencies, but bad as they are they’re not sufficiently catastrophic to support a day-trading, active shorting strategy.

We are short AMLP


Energy Infrastructure Stability Should Encourage More Buying

Volatility is not the investor’s friend. Some will immediately take issue with this – volatility caused by falling prices can mean opportunity, and volatile rising prices are surely welcome. While true, investments that gyrate cause investor stress which often leads to poorly timed sell decisions. Although a company’s long-term profitability should be more important, the downside of liquid equity markets is that they offer a constant evaluation of your decisions.

For many years before the Shale Revolution took hold, MLPs were known for stable, attractive yields. Companies paying out 90% of their Distributable Cashflow found income-seeking investors. This idyllic relationship suffered a nasty break-up once growth opportunities led to reduced distributions. Although justified, in order to lower leverage and fund new projects (see Will MLP Distribution Cuts Pay Off?), many investors felt betrayed.

As investors recall only too well, the result was a collapse in MLP prices bigger than occurred during the 2008 Financial Crisis. Midstream infrastructure businesses responded by strengthening balance sheets and, in many cases, converting to corporations. Older, wealthy Americans attracted to stable, tax-deferred MLP distributions are a poor match for growth businesses. The narrowness of the investor base, combined with uncertainty over how FERC will implement its revised policies on cost of service pipeline contracts (see FERC Ruling Pushes Pipelines Out of MLPs), have convinced most of the biggest energy infrastructure companies to organize as corporations. This makes their stock available to a far wider set of buyers.

For years, MLP prices were roughly as volatile as the S&P500. This relationship broke down in 2014 when the Energy sector endured its own bear market, leading to substantial performance divergence between the two.

But there are signs that the lower volatility of the past is returning. Companies are continuing to reduce leverage. 4X Debt/EBITDA (Earnings Before Interest, Taxes, Depreciation and Amortization) is now preferred to 5X. Financing of growth projects is far less reliant on issuing public equity. Distribution coverage is going up, even at the near term expense of distribution growth. Enterprise Products Partners (EPD) last year told investors to expect slower distribution hikes so they could redirect cash towards attractive projects. It’s worth noting that the high volatility of 2016 (defined as average daily moves of >1% over the prior year) is historically rare, occurring only 8% of the time since 1996.

.avia-image-container.av-38cqdc-ad1c7ba34fe861c0cc124398edc45c3c img.avia_image{ box-shadow:none; } .avia-image-container.av-38cqdc-ad1c7ba34fe861c0cc124398edc45c3c .av-image-caption-overlay-center{ color:#ffffff; }

Perhaps most importantly, the shift to a corporate structure is dramatically broadening the investor base, and this added stability is further reducing the sector’s volatility. The American Energy Independence Index provides broad exposure to North American energy infrastructure, with 80% corporations and only 20% in the biggest MLPs . It has 16% less volatility than the Alerian MLP Index, a meaningful improvement.

.avia-image-container.av-2r8iq8-97ce3e74a4cf289711f9c89b38943178 img.avia_image{ box-shadow:none; } .avia-image-container.av-2r8iq8-97ce3e74a4cf289711f9c89b38943178 .av-image-caption-overlay-center{ color:#ffffff; }

Given the well-established trend of larger MLPs to convert to corporations, this metric is likely to continue pointing away from an MLP-focused approach to the sector. As volatility returns to the lower levels that have predominated over the past 20-odd years, it’s likely that returns will also improve.


Why Electric Cars Help the Shale Revolution

A friend of mine recently returned from a trip to Texas and Louisiana, where he met with many contacts and friends in the energy infrastructure sector. In-person discussions and site visits can often leave a more powerful impression than reviewing events from a distance. My friend, an experienced investor, returned with his already optimistic view on the Shale Revolution strongly reaffirmed.

Some of the charts below illustrate why. Permian region oil output barely dipped in 2014-15 during the collapse in crude pricing. The widely described drilling efficiencies lowered break-evens (see America’s Path To Energy Independence: The Shale Revolution), and as the oil price recovered, so did production.

.avia-image-container.av-2k8gl2-9f97d94aabf5fd259b8fdcfd4a2c2ace img.avia_image{ box-shadow:none; } .avia-image-container.av-2k8gl2-9f97d94aabf5fd259b8fdcfd4a2c2ace .av-image-caption-overlay-center{ color:#ffffff; }

Today, Permian output is visually quite striking, rising at an increasing rate. This higher growth rate is what’s causing the infrastructure bottlenecks. Year-on-year increases of 0.8 Million Barrels per Day (MMB/D) were not obvious based on recent history and clearly few were ready. This is why the WTI basis between Midland, a collection hub for Permian crude, and Houston, recently reached $20 per barrel. There’s insufficient pipeline capacity to move the crude (pipeline tariffs are typically $1-$3 per barrel).

.avia-image-container.av-2vhrmu-22a3b6170a9c1817fafb1b5adc36cfd3 img.avia_image{ box-shadow:none; } .avia-image-container.av-2vhrmu-22a3b6170a9c1817fafb1b5adc36cfd3 .av-image-caption-overlay-center{ color:#ffffff; }

.avia-image-container.av-2xpi06-f0d6590edf8bf9bfa0c09807acbfe917 img.avia_image{ box-shadow:none; } .avia-image-container.av-2xpi06-f0d6590edf8bf9bfa0c09807acbfe917 .av-image-caption-overlay-center{ color:#ffffff; }

Clearly, even crude by rail (typically $7-$10 per barrel) can’t solve the problem, since the basis trades even wider than this, at the $20 cost of moving the marginal barrel. Trucks and truckers ($10-$20 per barrel or more) are in high demand, and because new pipelines are likely to be available late next year, large investments in truck fleets look unattractive given that the problem is temporary. Fortune Magazine’s Lone Star Rising provides a great feel for the local effects of the current oil boom.

Moving the associated natural gas that is often produced with crude oil in the Permian is also hitting infrastructure limitations. In fact, it’s likely that any moderation in crude output will be caused by waiting for the infrastructure to catch up. Permian natural gas is delivered to the Waha hub, and its basis versus the Henry Hub benchmark looks set to widen from $1 per Million Cubic Feet (MMCF) to $2. With natural gas trading at under $3, it’s not inconceivable that there may be no bid at Waha, a possibility mentioned more than once by energy executives at the Orlando MLP conference recently. Oil producers are hoping that regulators in Texas will allow more flaring of natural gas in the interim.

As a result, the U.S. has some of the cheapest natural gas in the world. Exports of Liquified Natural Gas (LNG) are currently 3.6 Billion Cubic Feet per Day (BCF/D). The U.S. Energy Information Administration expects LNG exports will rise sharply to 9.6 BCF/D by the end of 2019, reaching 13 BCF/D by mid-decade. The growing global trade is causing a shortage of specialized LNG tankers.

Although the Shale Revolution is a U.S. phenomenon, its impact is being felt around the world. Global crude oil demand of around 98 MMB/D is growing at 1.5 MMB/D annually. Less attention is given to depletion of existing oil fields, which is commonly estimated at 3-4%, or 3-4MMB/D. New supply needs to cover this shortfall as well as meet new demand, which means the world needs 4.5-5.5 MMB/D of additional output every year.

Wood Mackenzie recently forecast that decline rates would reach 6.3% for non-OPEC, non-U.S. shale, within three years. They expect U.S. production growth to be triple that of the next biggest country between now and 2025. However, even the most optimistic forecasts of U.S. output leave the world in need of other, conventional sources of supply to balance the market.

Global oil demand is expected to grow for at least the next couple of decades, albeit it at a slower rate, and it’s widely assumed that Electric Vehicles (EVs) will reduce overall demand. Forecasts from the EIA, the International Energy Agency, Exxon Mobil and Wood Mackenzie are all broadly similar in this regard.

An unusual view, but one persuasively made by my partner Henry Hoffman, is that EVs are a huge positive for the U.S. shale business – and not simply because their need for electricity will drive demand for natural gas. Since conventional oil projects take many years to return capital invested (they are “long-cycle”), their investment decisions needs to consider the evolution of EVs and how they might impact long term oil demand and pricing.

EV adoption rates are uncertain, and conventional oil projects are exposed to an EV upside case which will, in some instances, make pursuing them too risky. Shale producers need give little consideration to EVs, because the short-cycle nature of their pay-off is well short of the timeframe over which EVs may have an impact. Because shale wells return cash invested typically within a couple of years, production can be hedged in the futures market. Such wells have very sharp decline rates, so oil demand even five years in the future is barely relevant to today’s investment decision.

Uncertainty about the rate of improvement in EV technology clearly hinders 10-20 year oil investments, which plays to the advantage of the U.S. shale producer. This is not a view that’s widely held, yet it’s probably already having an effect (see Why Shale Upends Conventional Thinking). It strikes me as a really big idea, one that is likely to depress conventional exploration for many years, keeping crude prices higher and underpinning continued growth in U.S. shale. It was almost certainly a factor in Exxon Mobil’s (XOM) announcement earlier this year of a five year, $50BN investment in North American oil and gas production (see The Positives Behind Exxon Mobil’s Earnings). The entry of the biggest integrated oil companies into shale will lead to more predictable output since they won’t be as reliant on external financing. It also validates shale as a long term story.

.avia-image-container.av-2y905y-94c08a462be6dd739343e8ed2254cb56 img.avia_image{ box-shadow:none; } .avia-image-container.av-2y905y-94c08a462be6dd739343e8ed2254cb56 .av-image-caption-overlay-center{ color:#ffffff; }

Betting on higher crude has been a losing trade for hedge funds until recently (see WSJ: As Oil Soars, Few Hedge Funds Are Left to Profit), reflecting conventional wisdom that shale supply will act to rein in higher prices. By contrast, we think crude prices will trend higher over the medium term because of underinvestment in conventional supply. Shale investors should regard growing EV adoption as fundamentally supportive.

For more on America’s Energy Renaissance : The Shale Revolution, watch Simon Lack, Managing Partner of SL Advisors, discuss why he believes the Shale Revolution is the most fantastic American success story.