What Do They Know That We Don’t?

The other day a client asked if we’d looked at insider buying among management teams of pipeline companies.

So far this year, Energy Transfer (ET) dominates with $108MM, representing 63% of all the insider buys so far. Kelcy Warren receives plenty of criticism, not least from this blog (see Energy Transfer’s Weak Governance Costs Them), but he’s certainly invested in his business. He’ll be frustrated at having made those purchases in February, because ET lost more than half its value during the March collapse. But investors appreciate his conviction.

.avia-image-container.av-oc7yho-22cecea50cb76dc3a37254fe61ed5993 img.avia_image{ box-shadow:none; } .avia-image-container.av-oc7yho-22cecea50cb76dc3a37254fe61ed5993 .av-image-caption-overlay-center{ color:#ffffff; }

Kinder Morgan (KMI) saw $25MM of insider buying, along with $7MM of sales. Rich Kinder is a long-time buyer of his eponymous stock. He alienated an entire class of investors in 2014, when KMI cut the dividend to finance a backlog of growth projects, and simplified their structure in a tax-adverse manner for many. He created a verb — to be “Kindered” is when faithful investors are hit with both the abrupt cancellation of promised distributions and an untimely tax bill (see Kinder Morgan: Still Paying for Broken Promises). But Kinder has bought KMI at regular intervals, including at prices much higher than today’s.

Enterprise Products Partners (EPD) saw $12MM in buying from the Duncan family. And Nustar Energy LP saw almost $5MM in buys. That three of these four are MLPs (as was Kinder Morgan years ago) shows that management teams can accumulate real wealth more easily at the helm of an MLP, with its weak corporate governance, than at a corporation.

Magellan Midstream (MMP) was an outlier among respected companies, in that it had insider sales of just under $1MM.

There was no activity at Macquarie Infrastructure (MIC), perhaps unsurprisingly since they withdrew 2020 guidance and suspended their dividend.

Plains All American (PAGP) saw $4MM of buying even as they cut their distribution by 50%, while still planning to spend half of their previously planned growth capex budget. Many investors would have preferred still less spending and a maintained distribution, but this company has lost 90% of its value since the August 2014 peak. Poor capital allocation has a long history at PAGP.

Most other names saw some insider buying, including several well-run companies. Enbridge (ENB), Cheniere (LNG), Oneok (OKE), Pembina (PPL) and Williams Companies (WMB) fall into this category. This is a very positive step by all these buyers, because the science around viruses is a key factor driving energy demand in the months ahead. Nobody has the information they’d like.

The biggest insider selling was at Targa Resources (TRGP), where Rene Joyce, a member of the Risk Committee, was forced to sell to meet a margin call. TRGP saw no insider buying either. Back in 2014 TRGP briefly touched $140 a share, when ET was rumored to be interested in an acquisition. Joyce’s forced sale at $7 reflects the same judgment that caused TRGP to spurn ET’s approach.

Given the recent leverage-induced catastrophe in MLP closed end funds (see The Virus Infecting MLPs), if Rene Joyce was to move to either Kayne Anderson or Tortoise, it seems likely both his old firm and his new one would improve their risk management.

We are invested in all the names mentioned above.


Pipeline Companies Trim New Projects

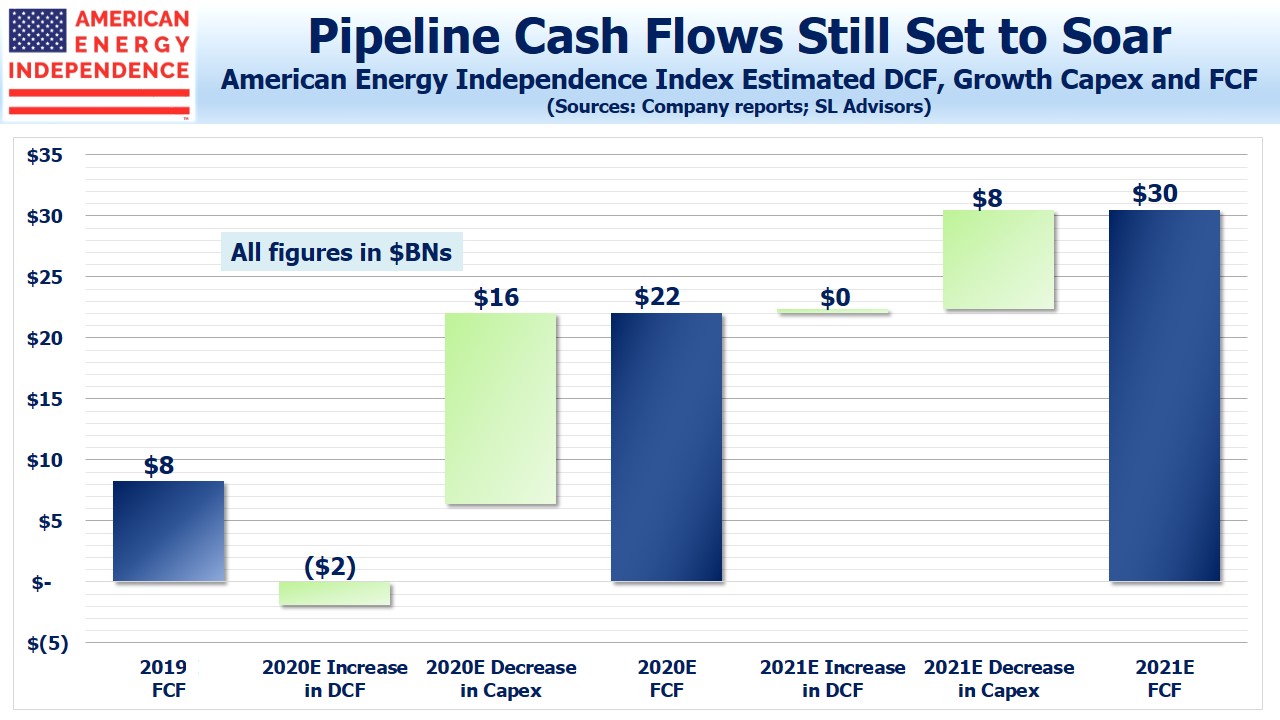
Coming into 2020 the pipeline sector was in good shape. Spending on growth projects peaked in 2018, and lower growth capex combined with rising cashflow from existing assets were set to drive Free Cash Flow (FCF) higher. Across the companies that are in the American Energy Independence Index it was on course to more than double, from $9BN last year to $21BN this year (see Updating the Coming Pipeline Cash Gusher).

Some companies have been providing updated guidance in recent weeks. The top ten companies represent 60% of the sector by market cap. Four of them have already revised their spending lower for the remainder of the year, with only Enbridge reiterating prior growth project guidance.  We expect the remaining five to revise their numbers in the weeks ahead.

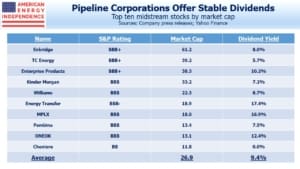
Global crude oil demand is estimated to have fallen by 25% or more in April, and the collapse in crude prices is the dominant energy story. But pipelines carrying natural gas, natural gas liquids and facilities supporting Liquefied Natural Gas (LNG) exports represent 62% of the sector’s market cap, versus just 28% for petroleum products. Natural gas demand has so far shown little coronavirus impact (see Natural Gas Demand Still Stable). Midstream MLPs are more weighted towards crude oil than pipeline corporations, which has hurt recent relative MLP performance (see The Disappearing MLP Buyer).

.avia-image-container.av-m6iw1a-d594b79f152618c940d7d95e9c765df5 img.avia_image{ box-shadow:none; } .avia-image-container.av-m6iw1a-d594b79f152618c940d7d95e9c765df5 .av-image-caption-overlay-center{ color:#ffffff; }

Our recently updated FCF blog assumed 2020 growth capex of $37BN. Reductions here will provide a cushion to offset any shortfall in cashflow, since a dollar not spent is a dollar of additional FCF. Four companies on the list (Oneok, Pembina, Williams and Inter Pipeline) have lowered growth spending by $1.4BN, around 23%. Enbridge said on their recent update that they’d raised the return hurdle for new projects. Enterprise Products is likely to lower their spending, last estimated at $3-4BN. Others have yet to provide any new guidance.

It’s also worth noting that first quarter spending was already completed by the time these updates were provided, so the 23% reduction is in practice more like a 31% cut for the remaining nine months of the year. If we assume a 23% cut in the industry’s originally planned $37BN 2020 spending, that’ll free up an additional $8.5BN to support FCF.

We are invested in the names listed above.


Natural Gas Demand Still Stable

Crude oil drew the headlines this week. Trump’s Wednesday tweet forecasting a 10 Million Barrel per Day (MMB/D) agreed supply reduction (“Could be as high as 15 Million Barrels”) caught markets off guard. The demand collapse is astonishing. The world was consuming around 100 MMB/D of crude oil and liquids before the coronavirus. Estimates are for a 20-25% drop in April. Every producer is feeling the financial pain, which ought to concentrate minds as OPEC holds an emergency video meeting on Monday.

Natural gas demand is both more regional and more stable. Some midstream energy infrastructure companies, such as Williams (WMB) and Cheniere (LNG) are entirely natural gas focused, even though their stock prices move with energy sentiment. Crude moves the S&P Energy ETF (XLE), of which they are components, so their stock prices follow.

.avia-image-container.av-1je3fw3-90666e1e5595696d4054a67d8ef8a9f1 img.avia_image{ box-shadow:none; } .avia-image-container.av-1je3fw3-90666e1e5595696d4054a67d8ef8a9f1 .av-image-caption-overlay-center{ color:#ffffff; }

U.S. natural gas production is heavily influenced by domestic prices. Although in recent years we’ve become a net exporter, over 90% of output is consumed domestically. Given the collapse in global crude demand, we’re interested in domestic natural gas demand.

The seasons dominate. Winter is the peak period as households and commercial buildings need heat. The power sector uses more in the summer as electricity demand rises for air conditioning. The chart shows the monthly pattern.

.avia-image-container.av-4xo2dv-ccce0e6baa50d768cb001c1ed845773a img.avia_image{ box-shadow:none; } .avia-image-container.av-4xo2dv-ccce0e6baa50d768cb001c1ed845773a .av-image-caption-overlay-center{ color:#ffffff; }

The Energy Information Administration (EIA) releases weekly data, which can provide a clue about how demand is being affected by the shut down’s effect on the economy.

We’ve taken the last two weeks, which cover late March to April 1. Since consumption is typically falling this time of year, a sequential weekly drop is normal. Multiplying by 31/7 to get the monthly rate, those two weeks are running at 2,393 Billion Cubic Feet (BCF) and 2,229 BCF respectively. These two figures sit comfortably between last year’s March total of 2,658 BCF and April’s 1,984 BCF.

.avia-image-container.av-nxzp3n-7682413030b959efc07e77f282440139 img.avia_image{ box-shadow:none; } .avia-image-container.av-nxzp3n-7682413030b959efc07e77f282440139 .av-image-caption-overlay-center{ color:#ffffff; }

Looking a little more closely, power demand is stronger than a year ago, continuing a trend of natural gas substituting for coal. And lower crude production will also mean less associated natural gas output from areas like the Permian, which will benefit those drillers focused on pure-play natural gas.

There’s no historical precedent for what we’re experiencing, and it wouldn’t be surprising to see natural gas consumption falling even after adjusting for the seasonals. So far, that doesn’t seem to be happening which supports the encouraging updates provided by natural gas oriented pipeline corporations.

We are invested in WMB and LNG.


Navigating the Collapsing Oil Market

To the list of previously inconceivable events, add Texas oil drillers asking for their regulator to impose production curbs. Pioneer Natural Resources (PXD) and Parsley Energy (PE) filed a request with the Texas Railroad Commission (RRC) to hold a hearing on the state’s oil and gas production. It’s over 40 years since they last considered such a move.

The U.S. energy industry has been hit with a 1-2-3 punch – coronavirus demand destruction; collapse of OPEC+ limits on output; Saudi Arabia’s launching a price war while increasing exports.

.avia-image-container.av-r7viuo-d448c8de158ab0e673a5444165c94e4c img.avia_image{ box-shadow:none; } .avia-image-container.av-r7viuo-d448c8de158ab0e673a5444165c94e4c .av-image-caption-overlay-center{ color:#ffffff; }

Senator Ted Cruz (R-TX) described a call between nine U.S. senators and the Saudi ambassador complaining about “economic warfare”. The Saudis blame Russia. “The Saudis are hoping to drive out of business American producers, and in particular shale producers, largely in the Permian Basin in Texas and in North Dakota,” Cruz told CNBC. “That behavior is wrong, and I think it is taking advantage of a country that is a friend.”

The petition to the RRC from PXD and PE included recent presentations from two energy consulting firms that paint a dire picture.

IHS Markit is forecasting a drop in global demand for crude oil of 14.2 Million Barrels per Day (MMB/D), and a 7.2 MMB/D drop for the year. This is far more than the drop during the 2008 financial crisis. The combination of collapsing demand and rising supply is filling up available global storage capacity, which is estimated at 1.3-1.6 billion barrels, assuming the excess oil can be moved there. The 1H20 forecast crude surplus of 1.8 billion barrels will use this all up.

.avia-image-container.av-p2nlow-db4a7df377f4a1e7320200489a89e5a1 img.avia_image{ box-shadow:none; } .avia-image-container.av-p2nlow-db4a7df377f4a1e7320200489a89e5a1 .av-image-caption-overlay-center{ color:#ffffff; }

Producers around the globe are already shutting in production, which can cause permanent damage to a reservoir depending on its structure. Shale oil production is easily curtailed through sharp decline rates by simply reducing the number of new wells drilled and completed. Once producing, a shale well’s operating costs are very low. Lifting costs (meaning the cost to produce after the well has been drilled) are just $3-5 per barrel. So this type of production is unlikely to be shut-in. New wells drilled will drop sharply, causing U.S. shale output to fall mostly through curtailed drilling of new wells and the normal fast decline rates for existing wells. The breakdown of OPEC+ has made many other producing regions in the world unprofitable.  Even Russia may need to start shutting-in production as spot prices drop below $15 a barrel.

.avia-image-container.av-qhog8g-c92af1d4bd5cc3f88e67b39387b98f47 img.avia_image{ box-shadow:none; } .avia-image-container.av-qhog8g-c92af1d4bd5cc3f88e67b39387b98f47 .av-image-caption-overlay-center{ color:#ffffff; }

The decision to drill new US shale wells to offset production declines will face a different analysis.  Producers will look towards the forward curve which is currently $11 higher one year out than spot prices, to lock in hedges for wells they expect to exceed their breakeven return threshold.  This slide from BTU Analytics shows that a drop in drilling activity of around 50% (which they estimate would occur with WTI prices in the mid $30s) would stabilize US production around 11 MMB/D.

.avia-image-container.av-398kgg-adb8215b309532d984d3c336058ed46f img.avia_image{ box-shadow:none; } .avia-image-container.av-398kgg-adb8215b309532d984d3c336058ed46f .av-image-caption-overlay-center{ color:#ffffff; }

Rapidan Energy Group’s forecast is for U.S. oil production to fall by 1.25 MMB/D. The two other forecasts on the chart, from the U.S. Energy Information Administration (EIA) and the International Energy Agency (IEA), were produced only a couple of weeks earlier, showing how rapidly situations are changing. Rapidan is forecasting an even bigger drop in 2Q20 global demand, of 16.4 MMB/D, but with a faster recovery so their 7.1 MMB/D full year demand drop is close to BTU Analytics.

Current prices are ruinous for all producers. President Trump recently said he’d be discussing oil prices with Russia. He told NPR, “”We don’t want to have a dead industry that’s wiped out. It’s bad for them, bad for everybody. This is a fight between Saudi Arabia and Russia having to do with how many barrels to let out. And they both went crazy; they both went crazy.”

The U.S. has limited leverage over Russia. We could curb imports of foreign oil, although that would cause problems for domestic refineries which generally aren’t equipped to handle the light grades produced by shale drillers. The U.S. military’s ongoing defense of Saudi oil infrastructure is gaining attention, and seems absurd when that country’s policies are so damaging to our domestic energy sector. A single presidential tweet on the topic wouldn’t hurt.


The Disappearing MLP Buyer

Approximately 80% of our investments in midstream energy infrastructure are corporations – we invest in MLPs selectively. There’s a big difference between investing in pipeline corporations with their wide investor base, and MLPs whose pool of natural buyers is withering.

That’s why eight of the ten biggest names in the American Energy Independence Index (AEITR) are corporations. Last week, Bloomberg published Pipeline Funds Imperiled With Even MLPGuy Seeing Their End. MLP-dedicated funds, and more importantly their investors, face some tough decisions in the months ahead.

.avia-image-container.av-k5cppl-ad4d4398902ab2e42d39cced24759b26 img.avia_image{ box-shadow:none; } .avia-image-container.av-k5cppl-ad4d4398902ab2e42d39cced24759b26 .av-image-caption-overlay-center{ color:#ffffff; }

MLPs long ago lost the support of their traditional investor: the older, wealthy American willing to accept the tax complexity of a K-1 in exchange for attractive, tax-deferred yields. The Alerian MLP ETF (AMLP) has cut distributions by a third since 2014, reflecting what MLPs have done (see When Will MLPs Recover?). These investors feel betrayed, and they’re not coming back.

The Alerian MLP Infrastructure Index (AMZI), which is what AMLP tries to track, has a float-adjusted market cap of just $61BN. This is too small to justify a sector-based approach, a point made in the past by CBRE’s Hinds Howard (known as @MLPGuy on Twitter). Regulatory limits cap holdings of big MLPs, causing smaller MLPs to be overweighted. The AEITR is 73% companies rated BBB or better, compared with  just  42% in the AMZI.

Publicly traded funds represent an important part of the MLP investor base. At the end of February, Wells Fargo estimated there was $30BN in such funds, of which Closed End Funds (CEFs) represented over 40%. Showing arrogant recklessness, these CEFs entered March with leverage of up to 40%, and in the subsequent forced deleveraging they blew up.

We’ve often warned about this, most recently in November (see Should Closed End Funds Use Leverage?). Their rapid demise contributed significantly to the overall selling of MLPs in mid-March. These portfolio managers owe everyone else an apology (see The Virus Infecting MLPs). It’s been the worst month in memory for pipelines — the AEITR is -40%. But the Kayne Anderson MLP/Midstream Fund (KYN) is down 65% for the month. The Clearbridge Energy MLP Fund (CEM) is -80%. The Tortoise Energy Infrastructure Fund (TYG) is -82%. This group has destroyed most of their client capital. They have no risk management. MLP CEFs no longer exist as a practical matter. They can’t do much more damage.

.avia-image-container.av-1cpsw2x-ba73fffcf2344f87803387f71689c291 img.avia_image{ box-shadow:none; } .avia-image-container.av-1cpsw2x-ba73fffcf2344f87803387f71689c291 .av-image-caption-overlay-center{ color:#ffffff; }

Open-ended MLP-dedicated mutual funds such as those run by Steelpath (now owned by Invesco), Center Coast Brookfield and Mainstay Cushing face a choice. The extreme volatility and diminished pool of names make it unlikely they’ll attract many new clients. Like AMLP, their complex, tax-inefficient structure has always been a burden, because they pay corporate taxes on profits (see MLP Funds Made for Uncle Sam). Invesco recently had to spend $400 million correcting mis-stated NAVs dating back to 2015 – evidently the tax treatment even confused the fund’s accountants. Today, all these funds are a long way from having to pay corporate taxes.

It must make sense for them to broaden their mandate to include pipeline corporations, whose market cap is roughly twice as big as MLPs. Doing so will place further downward pressure on MLPs as these funds diversify their holdings.

Tax-exempt U.S. institutions and non-U.S. investors rarely invest in MLPs, because they face onerous tax liabilities if they do. Valuations are so depressed that some may decide it’s worth the trouble. But they’re likely to stick to the big three of Enterprise Products (EPD), Energy Transfer (ET) and Magellan Midstream (MMP).

.avia-image-container.av-p0ovd5-d9fd7925462d693109f81acc5ac58e69 img.avia_image{ box-shadow:none; } .avia-image-container.av-p0ovd5-d9fd7925462d693109f81acc5ac58e69 .av-image-caption-overlay-center{ color:#ffffff; }

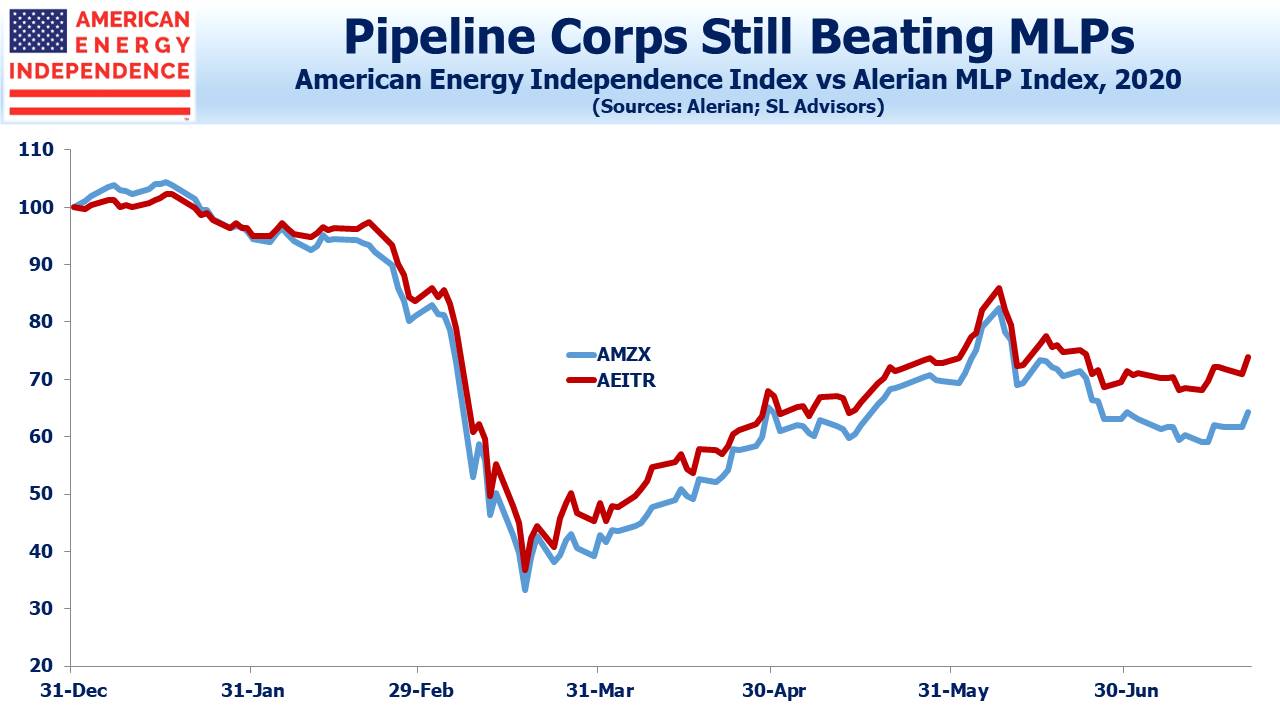
The result is that it’s hard to identify much natural demand for MLPs. By contrast, pipeline corporations can be bought by anyone. This absence of investors has led to even the three biggest MLPs performing worse than the three biggest pipeline corporations in the last month. The broader trend for pipeline corporations to outperform MLPs began early last year. The American Energy Independence Index is 80% corporations, and has beaten the Alerian MLP Index by 14% since then.

.avia-image-container.av-qm578p-d67b3e82dd229bda48e4c2c46b1f5801 img.avia_image{ box-shadow:none; } .avia-image-container.av-qm578p-d67b3e82dd229bda48e4c2c46b1f5801 .av-image-caption-overlay-center{ color:#ffffff; }

Moreover, compared with pipeline corporations, MLPs are (1) more exposed to crude oil with less natural gas, where demand is more stable, (2) more exposed to gathering and processing, which depends heavily on production from the specific areas served, (3) riskier credits, with more BBB- (one notch above junk) and below than corporations, and 4) less protective of investor rights, with poorer corporate governance and in some cases blatant conflicts of interest. In other words, the MLP-dedicated portfolio has more of what’s most vulnerable (see Today’s Pipelines Leave MLPs Behind).

The smaller MLPs are especially short of natural buyers. Years ago when the MLP industry had its own conference, StonMor (STON) was an incongruous participant as an MLP in the “deathcare” business (funeral homes and cemeteries). They had a complex structure even for an MLP, and they were out of place among energy investors. They’re now a corporation, and following various self-inflicted problems in 2016 are trading at roughly 5% of their value from years back. They didn’t fit in anybody’s portfolio.

MLPs unable to interest institutions will similarly struggle to attract natural buyers.

Investors in MLP-dedicated strategies should ask themselves: who are the likely buyers of what they own? For now, everything is so cheap that they could easily bounce. But over the longer run, we think MLP-dedicated funds will wish to diversify, which could mean selling most of their MLPs and buying pipeline corporations. A conversion of one of the big three would probably force the issue.

This will hurt performance, and nobody wants to be invested in the last fund to make that shift. Diversified exposure to midstream energy infrastructure through corporations, with just a handful of big MLPs, offers plenty of upside once we get past the coronavirus. But CEF investors saw their MLP allocations reduced in a fire sale, thanks to incompetent portfolio management. Having incinerated most of their investors’ capital, MLP CEFs won’t be a source of demand going forward. High net worth investors have been abandoning MLPs for years. ESG funds buy the biggest pipeline corporations (see our video ESG Investors Like Pipelines) but not MLPs because of their weak governance.

Open-ended ETFs and mutual funds that are loaded up with MLPs are likely to diversify. So if a portfolio of MLPs no longer makes sense, their only place is as part of a bigger portfolio. And if an investor owns just a few MLPs, she’s likely to focus on the big ones. A portfolio of MLPs has an uncertain future.

Disclosure: SL Advisors manages investment products designed to incorporate the advantages described above.


Update From Williams Companies

Yesterday Williams Companies (WMB) provided an investor update on their business. WMB isn’t directly involved in crude oil, and they’re best known for owning Transco, a natural gas pipeline network running down the eastern U.S.

.avia-image-container.av-1ld4gap-cbc3e5c020dc48b809f509c1c1a81ac5 img.avia_image{ box-shadow:none; } .avia-image-container.av-1ld4gap-cbc3e5c020dc48b809f509c1c1a81ac5 .av-image-caption-overlay-center{ color:#ffffff; }

So far, natural gas demand is un-impacted, and slightly above historical norms.

WMB provided some information on their overall sensitivity to the drop in economic output. Natural Gas Liquids (NGL) prices have collapsed along with crude oil, and this affects 2% of their business on the Gathering and Processing (G&P) side. Somewhat counter-intuitively, natural gas prices have firmed with the drop in crude. This is because Permian oil production results in associated gas, which has weighed on prices in recent months. The looming drop in Permian output will reduce natural gas supply, benefiting natural gas dedicated plays where WMB earns 38% of its EBITDA and 85% of that is associated with gas directed drilling. 7% of their EBITDA comes from oil-driven G&P.

.avia-image-container.av-zz4jmp-d7bfa95b81e7556efd8a6ac6ebaf30ca img.avia_image{ box-shadow:none; } .avia-image-container.av-zz4jmp-d7bfa95b81e7556efd8a6ac6ebaf30ca .av-image-caption-overlay-center{ color:#ffffff; }

On the gas transmission side, which includes Transco, they expect no near term impact. Two thirds of their gas transmission customers are utilities and power companies, and 90% are investment grade credit.

.avia-image-container.av-olibfl-63b402f6b7938cdc2e5945791fa6cf83 img.avia_image{ box-shadow:none; } .avia-image-container.av-olibfl-63b402f6b7938cdc2e5945791fa6cf83 .av-image-caption-overlay-center{ color:#ffffff; }

Overall, WMB expects 2020 EBITDA to come in at the low end of their prior guidance, due to weak NGL prices and lower output from oil drilling. They expect cash flow to support their dividend, which currently yields over 12%, as well as any spending on growth projects which they expect to revise down.

We are invested in WMB.


Markets Glimpse Light

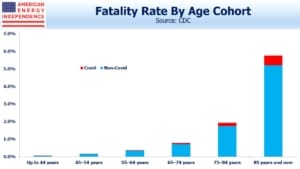
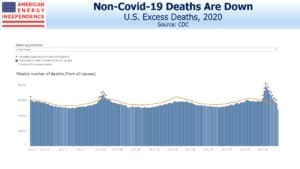
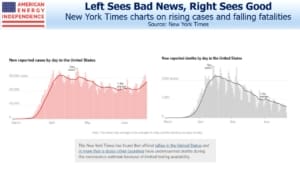
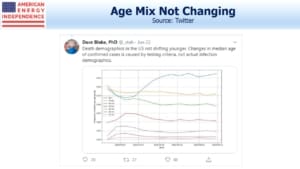
As our response to Coronavirus shifts from purely medical to political, markets have seen a glimmer of light. So far, decisions have been made, whether right or wrong, based on advice from epidemiologists. But as the economic cost has exploded, it’s provoked the obvious question: if the most vulnerable cohorts are identifiable, and the vast majority unlikely to require hospitalization, does everyone need to be at home?

Comparing fatalities with lost jobs seems crass; but something this big is a political issue that considers the overall impact to the country. A study from Oxford University suggested that up to half the UK population may already be infected. This would imply a very low fatality rate and very limited hospitalization, a huge positive if it turns out to be accurate.

When Thomas Friedman of the New York Times and Donald Trump agree that we need some certainty about when restrictions on life will be lifted, you know where the debate is headed. Coronavirus remains most importantly an issue of science, and we won’t offer any amateur views. But decisions are likely to reflect not only medical input from here. Barring a sudden deterioration, we expect governors such as New York’s Andrew Cuomo to soon define a timeframe that will see many people return to work.

.avia-image-container.av-1z7rcd-7ae93ef5133806a19d3726a4d7fad3a7 img.avia_image{ box-shadow:none; } .avia-image-container.av-1z7rcd-7ae93ef5133806a19d3726a4d7fad3a7 .av-image-caption-overlay-center{ color:#ffffff; }

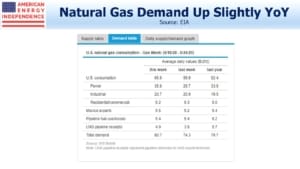
Pipeline investors care about volumes. Weekly data from the Energy Information Administration shows little impact so far on natural gas demand. Residential/Commercial is down – mild winter weather has probably depressed Residential, and Commercial may also be lower. But overall the figures look stable.

.avia-image-container.av-tyj1ql-8723abdbebe8e9bff62c5b81ba20f805 img.avia_image{ box-shadow:none; } .avia-image-container.av-tyj1ql-8723abdbebe8e9bff62c5b81ba20f805 .av-image-caption-overlay-center{ color:#ffffff; }

EIA supply figures look similarly stable, although the chart from Criterion Research is a few days more current and shows a sharp drop. Ultimately though, if demand stays flat supply will recover.

.avia-image-container.av-j9i0tp-05d16856ebc05aad7d513afb855139ed img.avia_image{ box-shadow:none; } .avia-image-container.av-j9i0tp-05d16856ebc05aad7d513afb855139ed .av-image-caption-overlay-center{ color:#ffffff; }

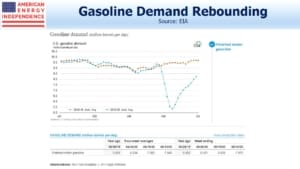
Gasoline demand hadn’t yet dropped, based on this chart through Monday. Drivers filling their tanks in case of distribution problems probably helped, but demand is obviously going to fall with most of us at home.

.avia-image-container.av-viunkd-141d4f5b4500f9b2f0fa405452d6fdda img.avia_image{ box-shadow:none; } .avia-image-container.av-viunkd-141d4f5b4500f9b2f0fa405452d6fdda .av-image-caption-overlay-center{ color:#ffffff; }

Unemployment claims on Thursday will be important. JPMorgan is forecasting a 6X jump from last week, to 1.5 million. The highest forecast is for 4 million. For reference, on October 2, 1982 the figure was 695,000. In the depths of the financial crisis on March 28, 2009, we hit 665,000. So we’re likely to see the biggest figure in history.


Recapping Another Memorable Week for Energy

None of us will forget the past couple of weeks. Investors and money managers are grappling with collapsing markets, working remotely and the challenges of ever stricter controls on our movement.

Below we’ll highlight some information that investors may have missed, combined with what we’ve learned from multiple conversations.

Pipeline companies that said anything publicly were reassuring. Ten days ago and well into the market crisis, Oneok (OKE) cut growth capex by 20% and reaffirmed 2020 guidance. On Monday Enbridge (ENB) provided a reassuring assessment of their business prospects (see Enbridge Fireside Chat). Since then, Pembina (PBA) cut growth capex by 40% and reaffirmed EBITDA guidance, and Enterprise Products Partners (EPD) declared their normal quarterly distribution. Targa Resources (TRGP) slashed their distribution by 90% which was no great surprise, and lowered growth capex by 30%. Williams Companies (WMB) announced a poison pill lasting a year, to fend off any unscrupulous buyer seeking to acquire the company at a rock-bottom price.

MLP closed end funds and leveraged MLP exchange traded notes were almost wiped out by forced develeraging (see The Virus Infecting MLPs). Incredibly, many of these funds, run by well-known MLP managers such as Tortoise and Kayne Anderson, were leveraged up to 40% as recently as the end of February. In looking at the size of these funds and volume figures, it’s plausible that they were a significant portion of the selling in this sector earlier last week. While coronavirus was unpredictable, the arrogance of these fund managers in maintaining maximum leverage exposes a complete absence of risk management at their firms, and others like them. They have caused a steeper fall than would have happened otherwise. Their NAVs have shrunk far enough that they’re now too small to have much impact going forward.

.avia-image-container.av-18cmgc7-4ddc0d9de90ae3ebf630dd888947a3bb img.avia_image{ box-shadow:none; } .avia-image-container.av-18cmgc7-4ddc0d9de90ae3ebf630dd888947a3bb .av-image-caption-overlay-center{ color:#ffffff; }

Entering 2020, midstream energy infrastructure was set for a doubling of Free Cash Flow (FCF) (see Updating the Coming Pipeline Cash Gusher). The analysis was based on guidance all provided prior to the coronavirus outbreak, although recent updates have been encouraging. We had estimated 2020 growth capex at $37BN for the components of the American Energy Independence Index (AEITR). Average reductions of 20% would free up $7BN in FCF, and since we’re almost through 1Q20 they represent a bigger cut in previously planned spending for the remainder of 2020. We see the industry as broadly in pretty good shape to withstand the type of drop in energy demand that seems likely.

Making forecasts over the next year or two is reliant on the path that the virus takes, the success we have in defeating it and resolving the economic damage. In countless conversations with investors this week, we have stressed that while we can offer our insights on the sector we cover, we won’t pretend to be virus experts. We have a constructive view that the severe health threat posed by the virus will be met within a few months. Someone with a more negative view might infer, say, a severe drop in domestic energy consumption for a couple of years, and that would alter the outlook for pipelines. Our portfolio companies are >75% investment grade with customers that are around 80% investment grade. Exposure to crude oil, and gathering and processing networks, is small because stocks with that type of exposure have already fallen so far.

We have found investors are mostly sitting tight, regarding the drop as too sudden and sharp to warrant a hasty response. There are investors with cash looking for a good entry point. And to bring home the widespread economic damage, we’ve spoken to clients who anticipate providing financial support to children and other family members who have lost their jobs.

The AEITR is down 55.6% for the year, and the S&P500 is  down 28.6%. From October 9, 2007 to March 6, 2009, the S&P500 fell 56%. On Friday, it was 32% off its high of February 19th, a very long month ago.

Finally, this chart caught our attention.

.avia-image-container.av-kqsbg7-bfe05348a5dddf9c0324aa39cf6414d2 img.avia_image{ box-shadow:none; } .avia-image-container.av-kqsbg7-bfe05348a5dddf9c0324aa39cf6414d2 .av-image-caption-overlay-center{ color:#ffffff; }

Outcomes vary widely by country. South Korea stands out as handling the health crisis as well as anybody. Germany is carrying out 160,000 tests a week, has 19K cases and 67 deaths (as of Friday 4:30pm NY time). The 0.3% fatality rate is still higher than flu, but contrasts with Italy’s 4,032 deaths and 8.6% fatality rate. Although there can be many reasons for the difference, infection numbers may be low depending on testing availability, while deaths are probably counted correctly. So Germany’s figures are likely more representative. U.S. infection numbers will increase as testing becomes more widespread. But if the curve eventually flattens to look more like South Korea, that would be the best news we’ve had in a while.

We are invested in ENB, EPD, OKE, PBA, TRGP and WMB.


The Virus Infecting MLPs

Closed end fund investors are passionate about the product. Because they generally own a portfolio of publicly traded securities, their NAV per share is easily calculated. The fixed share count means their share price can deviate from the NAV, and this attracts investors keen to buy something for less than it’s worth.

MLP closed end funds have been around for years. They’re a low-octane version of levered ETFs. If you’re good at market-timing, a skill claimed by far more than actually possess it, you can navigate the ups and downs. Leverage magnifies your exposure, and strategies with fixed leverage have to rebalance in the direction the market has moved (i.e. buy high and sell low).

We have warned investors about this before (see Lose Money Fast with Levered ETFs).

In 2015 we pointed out how the Cushing MLP Total Return Fund (SRV) had persistently destroyed value, because of leverage (see An Apocalyptic Fund Story).

.avia-image-container.av-134nwnd-27005fac84fce756ac522a86342711e4 img.avia_image{ box-shadow:none; } .avia-image-container.av-134nwnd-27005fac84fce756ac522a86342711e4 .av-image-caption-overlay-center{ color:#ffffff; }

MLP closed end funds use leverage. Because they are more than 25% invested in MLPs, they are non-RIC compliant and therefore their profits are subject to corporate income tax. The interest expense on their borrowings can be deducted against taxable income, thereby reducing or even offsetting the tax obligation that few holders realize exists.

But adding leverage to a single sector fund is a dumb idea. Investment grade midstream energy infrastructure companies generally operate at around 4.0X Debt:EBITDA. Non-investment grade are a little higher. The manager of a sector-specific leveraged fund is essentially rejecting this leverage as too conservative, even though such a fund has little diversification in a sharp fall in the market.

This is an expression of arrogance, that the managers of these funds have some insight superior to the collective opinion of CFOs and rating agencies. They don’t. They are just willing to gamble other people’s money that they do.

.avia-image-container.av-pr4ikp-287628c67413fa61f3faa0568a8089d7 img.avia_image{ box-shadow:none; } .avia-image-container.av-pr4ikp-287628c67413fa61f3faa0568a8089d7 .av-image-caption-overlay-center{ color:#ffffff; }

An investor pointed out to me leverage at some of these funds, from fact sheets recently published at the end of February. Goldman was running a fund with 35% leverage. Tortoise had one with 40%. YTD these funds were down 85% and 95% respectively as of 2pm today.

Given the collapse in March, these funds have all been forced sellers. As long-only investors we are down a lot. But the delevering of MLP CEFs has exacerbated the drop for everyone. Leveraged MLP closed end funds are a financial virus that is infecting the rest of the sector, by driving prices even lower. They harm all investors, but most especially the poor souls who sadly bought them. Fortunately, most of these funds are nearly dead, with little capital remaining to protect.


Enbridge Fireside Chat

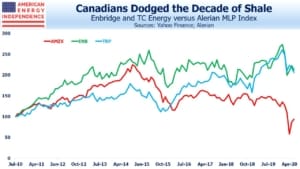
Earlier today Enbridge (ENB) CEO Al Monaco held a “virtual fireside chat” with an analyst from RBC. ENB, like the other Canadians, is run more conservatively than many U.S. businesses. We’ve often noted that a bit more Canadian management would be beneficial in the U.S. energy sector.

The slides below are from the ENB presentation deck that was published at the same time.

.avia-image-container.av-mgeojg-be535ce8d68e7fc4b2a9ff362c92ec93 img.avia_image{ box-shadow:none; } .avia-image-container.av-mgeojg-be535ce8d68e7fc4b2a9ff362c92ec93 .av-image-caption-overlay-center{ color:#ffffff; }

We estimate that within the American Energy Independence Index (AEITR), 80% of the customers are investment grade. ENB does better than this with 95% as this slide shows.

.avia-image-container.av-ptqtmk-668609374e131f0629148c41b9017527 img.avia_image{ box-shadow:none; } .avia-image-container.av-ptqtmk-668609374e131f0629148c41b9017527 .av-image-caption-overlay-center{ color:#ffffff; }

This chart lists the profile of their natural gas customers. Monaco noted that these customers are often “must-run” facilities such as power plants in the north east U.S. and Canada. He also said that many of their liquids customers run the most competitive, complex refineries.

.avia-image-container.av-19jq8ik-c9e5e6e120b30744ccc4f266af615893 img.avia_image{ box-shadow:none; } .avia-image-container.av-19jq8ik-c9e5e6e120b30744ccc4f266af615893 .av-image-caption-overlay-center{ color:#ffffff; }

This slide shows how their EBITDA showed no visible hit from the 2014-16 collapse in crude prices, even though Canadian tar-sands is among the most expensive crude oil to produce.

.avia-image-container.av-1qwiiqk-e269caf82a588b8881863c6d95d1fe3c img.avia_image{ box-shadow:none; } .avia-image-container.av-1qwiiqk-e269caf82a588b8881863c6d95d1fe3c .av-image-caption-overlay-center{ color:#ffffff; }

This chart lists their top ten liquids customers along with their credit ratings.

.avia-image-container.av-2qlkiu4-6c7f7f003497275a6af47a7c184fd85e img.avia_image{ box-shadow:none; } .avia-image-container.av-2qlkiu4-6c7f7f003497275a6af47a7c184fd85e .av-image-caption-overlay-center{ color:#ffffff; }

ENB has been reducing their leverage in recent years. This is because their backlog of growth projects has been coming down. In 2015-16 they had a $25BN backlog, whereas today they have half that with $6BN remaining to fund for new investments over the next three years.

.avia-image-container.av-m2api4-75d1a97ec807b112687e63a858dcd596 img.avia_image{ box-shadow:none; } .avia-image-container.av-m2api4-75d1a97ec807b112687e63a858dcd596 .av-image-caption-overlay-center{ color:#ffffff; }

Monaco sounded very calm about his company’s position. We think they’re the kind of company that can get through just about any plausible economic disruption.

We are invested in ENB.